Last week, I put up an Alpha Feed post that went over some nuanced ways to approach the understanding of crypto liquidity. But like I said, there are more factors to consider.
Adding pieces to our liquidity puzzle, one key piece of the puzzle is that of our friendly retail population. In a less sophisticated market where riches are made and lost every day, the bulk of the market participants are retail. But there is no clear way to analyze the participation rate, right? Right! Sure, there might not be a quantitative way of doing this, but we might have something to work with if we resort to qualitative measures.
So, where would a layman wanting to get into crypto begin? Of course, through Google! Now, if we look at Google search trends for common crypto search terms, we might be able to draw a parallel between a rise/fall in retail funding/interest and the state of the market.
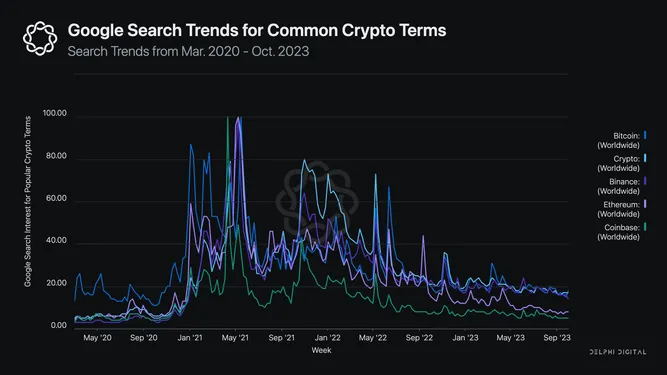
Anyone who has been in the market since the COVID-19 crash can tell by a brief glance that Google search trends for common crypto terms are pretty much confluent with the trajectory of the market. The retail participation doesn’t begin until BTC crosses $30K by Jan. 2023, but it shoots up vertically right after that. This helps explain why most altcoins didn’t rally until Feb. 2021, as they heavily depend on retail flows.
The search interest peaks around the first major BTC top in May. 2021 and experiences another significant uptick along with BTC’s new ATH in Nov. 2021. Since then, the search interest has pretty much followed the overall market trend and is downwards and to the right.
Now, what would follow a Google search? You’re right, YouTube! Analyzing the relationship between the average weekly views and subscriber growth/decline of popular crypto-related YouTube channels ought to shed some more color on retail participation.
Some of the most popular channels are The Moon, BitBoy Crypto, DataDash, Elliotrades Crypto, and Ivan on Tech. Using Social Blade to analyze the growth/decline in their subscriber and average view counts, we can see that it mirrors the trend observed with Google Search Trends.
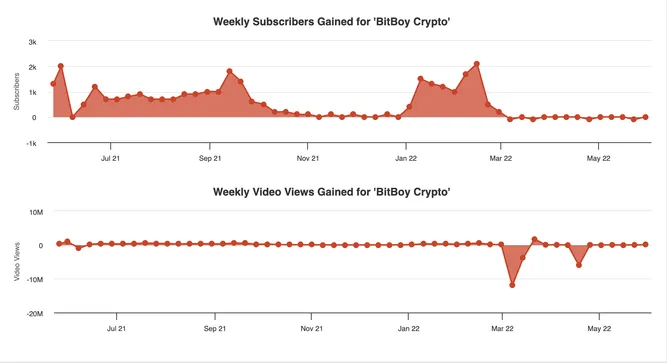
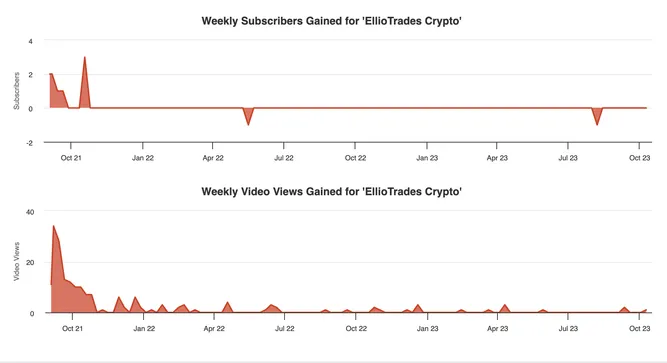
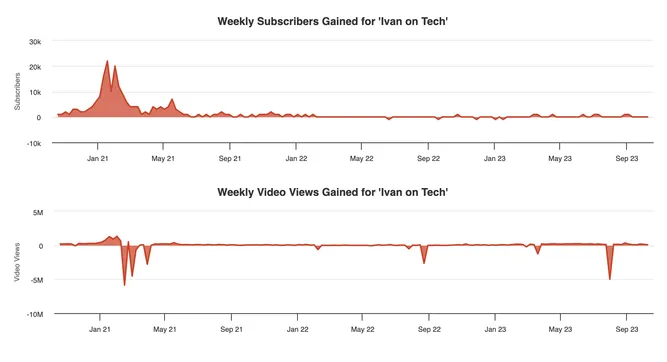
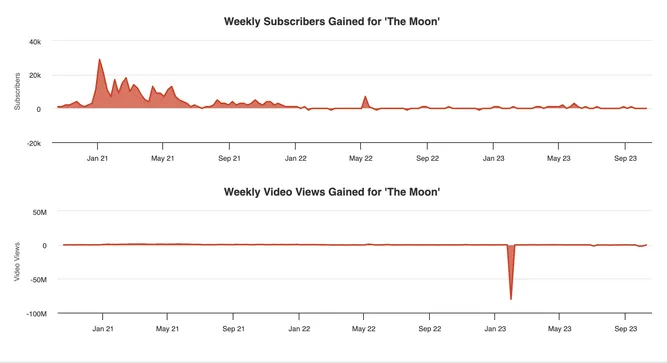
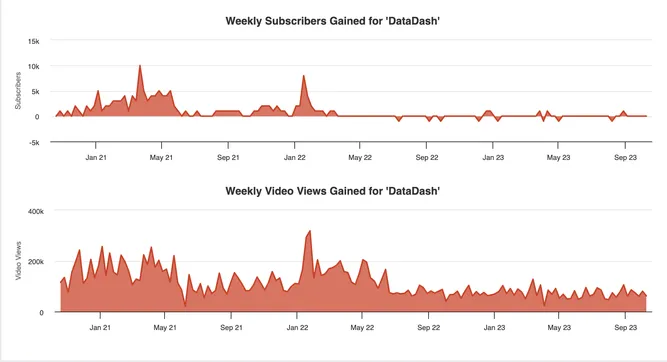
Although far from perfect, using these alternate metrics does provide some valuable insight into the market trend and the impact of retail participation.
You can take this a step further and perform a similar analysis on popular Twitter accounts, SubReddits, Blogs, podcasts, and so on.
And upon doing so, in all likelihood, you’d find these trends being mimicked.