Perpetual swaps/futures are the most dominant trading instrument in crypto. DeFi, CeFi it doesn’t matter — everyone wants perps. They’re incredibly useful for both retail and institutional investors. It’s perhaps the easiest way to access delta-one leverage. But are they truly the end of the line for crypto derivatives? To phrase it differently, can this market rely on just perpetuals for delta-one leverage?
I’ve been thinking about this out loud on Twitter. First, I thought it was a pretty bad instrument for long-term speculators. Perpetual funding costs can skyrocket over short periods of time, making it difficult to hold long-term positions as the cost of holding it soars. But then I ran some numbers and realized, maybe it isn’t all that bad. After all, they’re the most traded instrument in crypto. The market can’t be *that* wrong, right?
I thought it might be useful to do a quick exercise. I looked at two distinct periods in the market. Imagine a hypothetical trader goes long on day 1 and closes out on day 365. Ignoring all execution costs, what impact will funding have on said trader’s PNL? And how does funding paid stack up against the notional size of their position?
The first period I wanted to look at for this analysis is for a 2 BTC positon held over the last one year: Apr.4, 2022 – April.4, 2023. Ranged price action with relatively less funding spikes.

I know, I know — most of you hate dual Y axes chart, but please bear with me. Assuming a 2 BTC long position was opened in Apr. 2022, the notional size in USD on the day of opening was $93,193.66 (2*$46,595.83). Notional on the last day was $56,359.28. Yeah, obviously a highly underwater position, down over $36K since opening it, but we’re not concerned with that right now. My goal is to figure out whether the cost of obtaining this leverage was reasonable or not.
Over this one year period, the position paid a net funding of $325. Much lower than I expected.

Over the course of marking funding payments against notional size on an ongoing basis, obviously the data trends up as the position paid funding on most days. But over time, it peaked at just over 0.7% of notional. That’s quite honestly a really low cost of leverage. But we are ignoring the fact that it was a massively losing position. So what happens when we track this for a winning position?
Moving on, the second period I chose was the calendar year of 2021. Raging bull market, lots of Fed brrrr. Seems like a good trending period to track for this purpose.
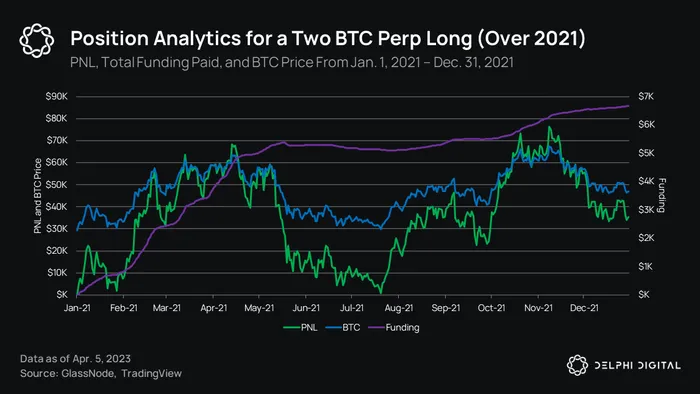
Right off the bat, it’s clear that funding is much much higher than the previous position. Funding gets extreme during trending periods — be that up or down. On day 1, BTC closed at $29,412.84, implying a notional position of $58,825.68. The year closes out with a notional position size of $94,244.16, resulting in a cool gross profit of $35,418. Total funding paid over this period was $6,662.45, so the position’s net profit was $28,756.

But the cost of leverage here is clearly exorbitant relative to our first case study. Funding/Notional peaked just under 9%. For some, this may seem like just the cost of doing business. And they would be right. But what if you could reduce that cost by using a different instrument. Say, a futures contract.
Futures have no funding curve. The real cost of leverage with futures is the premium you have to incur over current spot price to enter the position. Sometimes, there’s a discount rather than a premium and you essentially have leverage that “pays”. Futures are a good choice for various types of people. Investors with a specific time horizon, options dealers that need to delta/gamma hedge, and people looking to lock in a sell price for their spot assets. The same holds up for perps too.

(Source: Amberdata Derivatives)
If we look at the June 2023 futures, we can calculate the annualized basis (or cost of leverage) at 3.2%. Skip one year ahead to the March 2024 contract, annualized basis is about the same 3.2%. Compared to our first case study, futures are more expensive. Compared to second, futures are cheaper. But in the bull market scenario, we’re likely looking at anywhere from 10-20% annual basis anyway based on the last cycle. So where do futures excel?
Futures are great for larger players because your position cost is predictable. Funding rates for perpetuals change every 8 hours (or 1 hour on some exchanges). This makes predicting your cost of leverage difficult. Futures make that more straightforward, which is why institutions and large funds might prefer them.
Anyway, this was just an exercise I wanted to run because I always assumed perpetuals would be more expensive than futures. But clearly, that isn’t always the case, and I now have the data to confirm the alternate view.
Thanks for attending my TED talk!