During trending periods, it is always important to continually assess the health, strength and likelihood of continuation or reversion of the trend. The trend for much of 2023 has been up only, albeit with a few hiccups along the way (namely the recent events surrounding the banking crisis).
One of my favorite ways to assess the high level trend is to look at OI dominance split between BTC, ETH, and Altcoins (excluding BTC and ETH). Below is a simple chart from Coinalyze showing this data for the last 2 years.

BTC is blue, ETH is green, and Altcoins are orange. We can clearly see there is typically a plateau area with regard to Altcoin OI dominance. We rarely see Altcoin OI dominance exceed roughly 33%-35% for extended periods of time over the last 2 years.
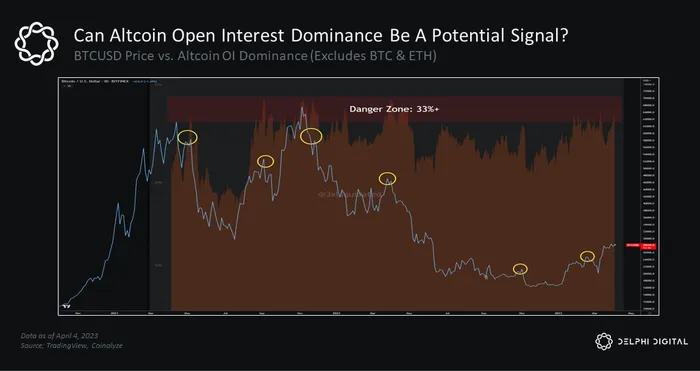
The above chart overlays the Coinalyze altcoin OI dominance chart with the BTCUSD price chart, from May 2023-Present, and a relationship between becomes more apparent. It appears as though when altcoin OI dominance reaches its extremes (usually in the regions of 33%-35%) BTC price tends to experiences some difficulty. At the time of writing, altcoin OI dominance has been hovering in the 32%-33% range.

Using Delphi’s Backtest Builder, we looked at the forward returns after these extreme altcoin OI dominance levels have been breached. (This was a very simple backtest model for the sake of showing potential pricing dynamics). We can see the forward 10-day returns have generally not been favorable.

Looking 30 days into the future, we see the beginning of what looks like a recovery after all instances turned negative for quite a while. In fact, it took about 17 days on average before prices began to recover.
What is the reason for this dynamic?
It is actually tough to say. And truth be told, the sample size is not exactly significant. The parameters around how dates were selected can likely be improved upon as well. But, I think the overall thesis at play here is a rather simple one of risk exposure.
Trends are generally started in the best assets, or most healthy assets. In crypto markets, this is BTC until further notice. As the trends continue to mature, we might see flows move from the best stuff to stuff with a little bit more risk (but also more return potential). This is ETH. As trends reach their final stages, we might see flows move from this more risky stuff to absolute degenerate garbage risk. This is stuff like Doge, AI coins, Dinocoins, etc. We haven’t seen any of that recently have we?

This is the high level crypto risk curve:
- BTC
- ETH
- Everything Else
In general this dynamic is one that I think of in similar terms to calendar effects in traditional finance markets. Calendar effects refer to certain recurring patterns or anomalies that are observed in financial markets based on the time of year or month. These effects can be seen in various financial variables such as stock prices, trading volume, and returns.
There are several types of calendar effects, including:
- Seasonal Effects
- Day-of-the-Week Effects
- Month-of-the-Year Effects
- Holiday Effects
Where calendar effects are time of year based, OI dominance across crypto assets is more market structure based, as it reflects the current risk appetite and exposure of market participants over time as well as at any point in time.
This topic was covered in more detail during the recent Bull vs. Bear episode which can be found here.