Welcome to our second installment of Charts of the Week. To see last week’s edition, click here.
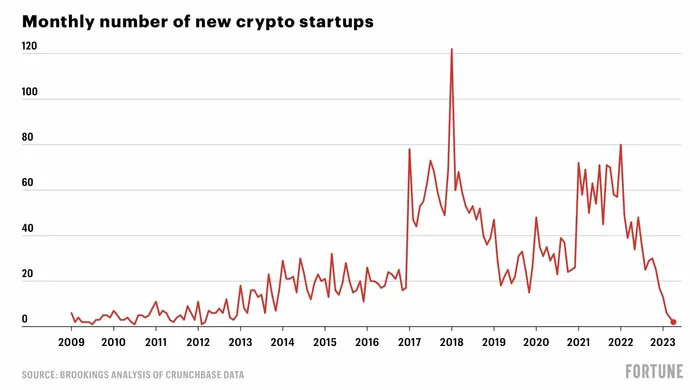
This week saw a fairly depressing chart make the rounds on CT, showing new crypto startups nuking amid the bear market.
We also got an update from Electric Capital’s Crypto Developer Report.
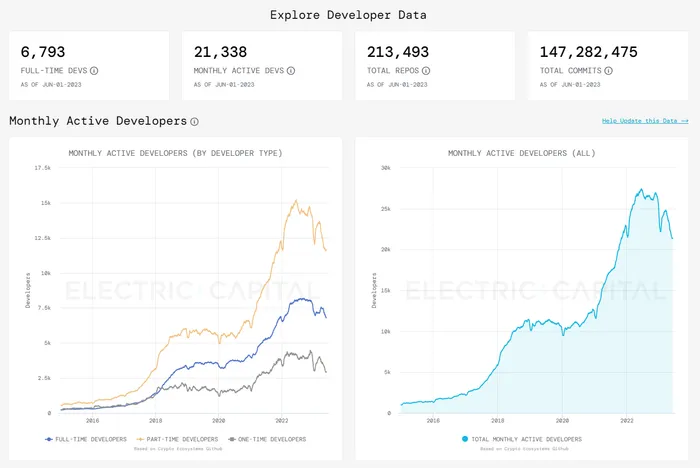
The report showed that while crypto’s top-line developer count has declined alongside new company formation, under the hood, many ecosystems are experiencing strong growth in spite of market conditions.
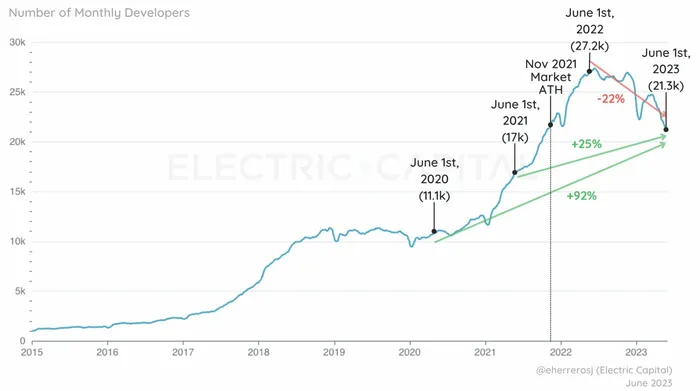
At this stage in the bear market, dispersion reigns supreme. Developers appear to be coalescing around a small number of “winners.”

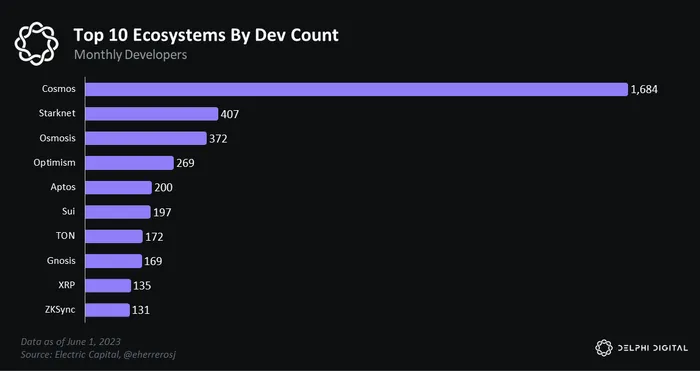
By dev count — Cosmos, Starknet and Osmosis currently lead the pack.
By 1-Year growth — Aztec, Sui and TON come out on top.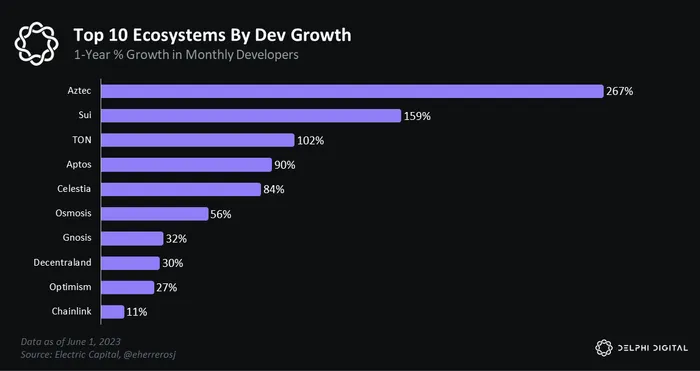
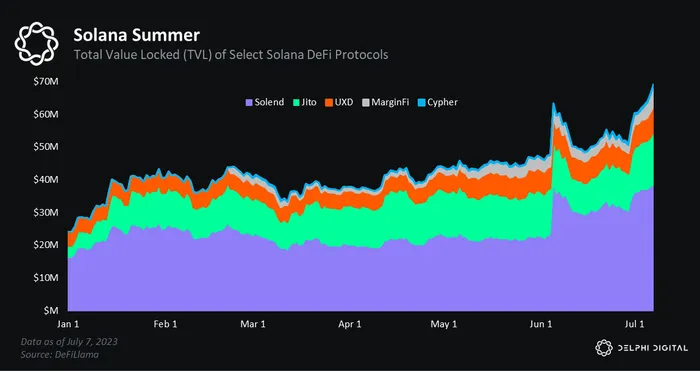
One ecosystem notably absent from Electric’s analysis was Solana. After a brutal 2022, Solana DeFi is starting to catch a bid. Across the five DeFi protocols highlighted below, Solana’s TVL is up 185% YTD, jumping from $24M to $69M. Nice…
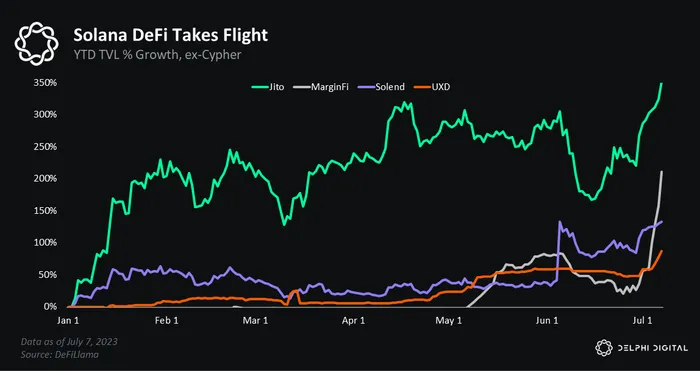
In terms of YTD growth in TVL –Cypher, Jito and MarginFi are pumping the hardest.
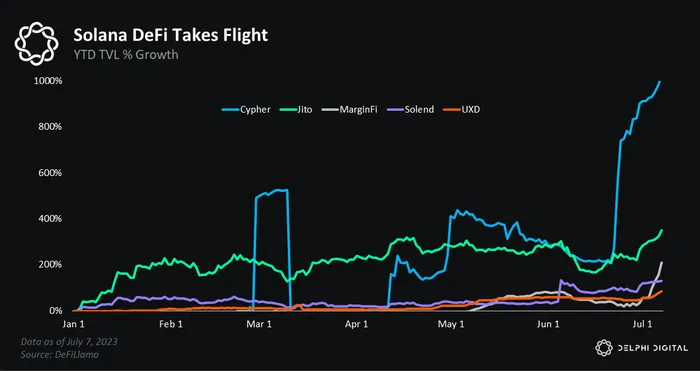
Granted, most of these protocols are coming off low bases, so the growth rates should be taken with a grain of salt.
In more markets-ey news, GBTC’s discount continues to narrow. This comes after it traded at a deep discount thru 2021 and 2022.
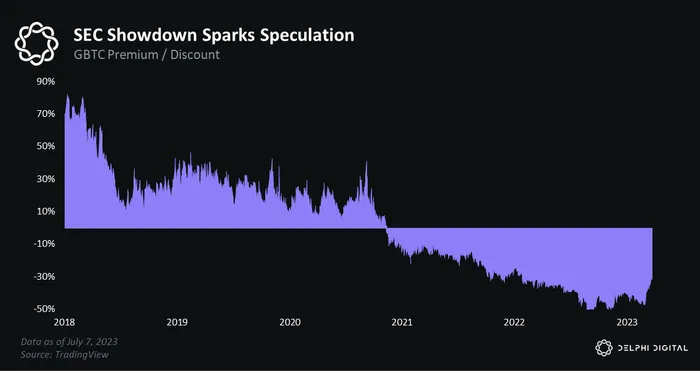
Much of the price action has been driven by the expectation that Grayscale (the sponsor of GBTC) will prevail in its lawsuit against the SEC. The thinking is that a legal victory will enable Grayscale to roll over GBTC into an ETF product, which should structurally narrow the instrument’s current discount to NAV.

Another wrinkle to consider is BlackRock’s ETF filing on June 15. Ever since Larry ‘Gigachad’ Fink threw his hat into the ring, GBTC’s discount has sharply narrowed. The thinking here is that the SEC may see the writing on the wall vis-à-vis the Grayscale lawsuit and opt to save face by letting BlackRock (its preferred sponsor) thru before allowing Grayscale to convert.

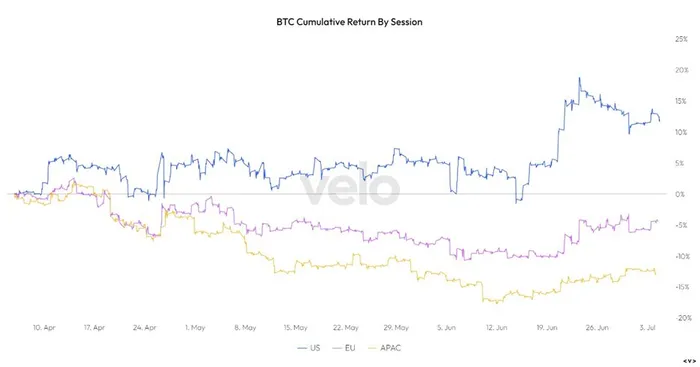
On a similar markets x politics nexus, a recent report from Reflexivity Research revealed that the majority of BTC’s gainz have occurred during U.S. trading hours, particularly following BlackRock’s mid-June ETF filing.
Confusingly, BTC flows present a slightly more nuanced picture. After propelling the 2020-2021 bull run, the U.S. has been in distribution mode since the summer of 2022. Asia has emerged as the driver of marginal BTC demand. 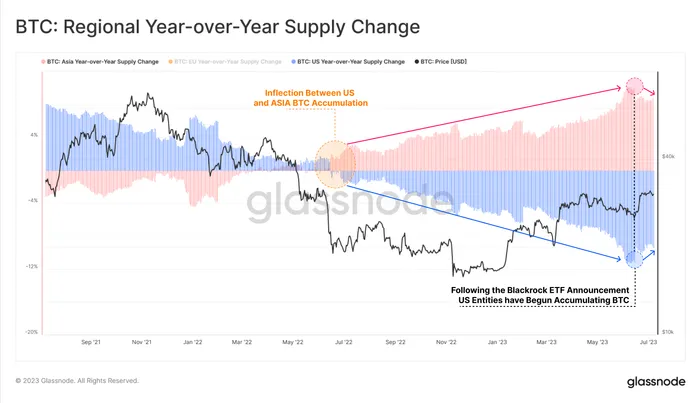
However, following BlackRock’s ETF announcement, the share of Bitcoin supply held/traded by U.S. entities has experienced a notable uptick (see YTD flows chart below), marking a potential inflection point in supply dominance if the trend is sustained.

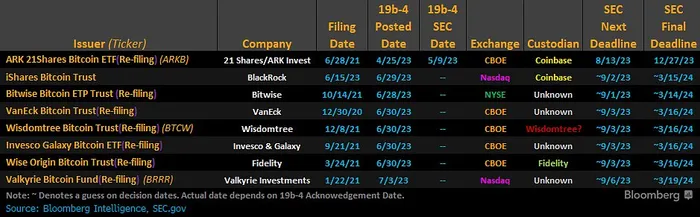
To conclude this week’s orange coin section, here’s how the field looks in the BTC ETF race. As Bloomberg’s ETF analyst notes: “there’s still a lot of unknowns right now.”
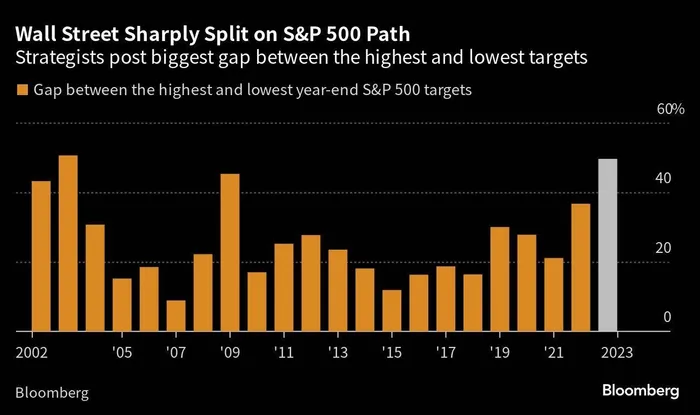
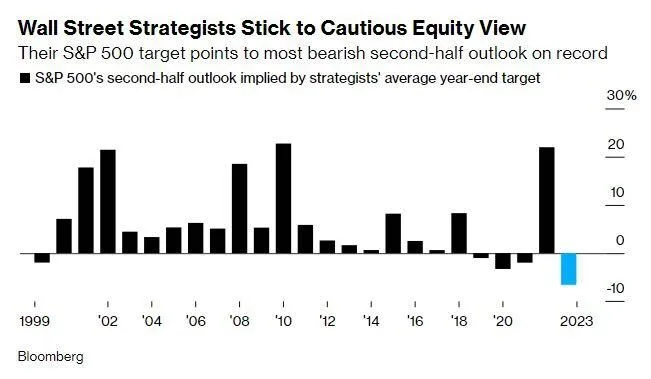
Shifting over to macro land — after a scorching start to 2023, equity strategists appear to be just as confused as the rest of us.
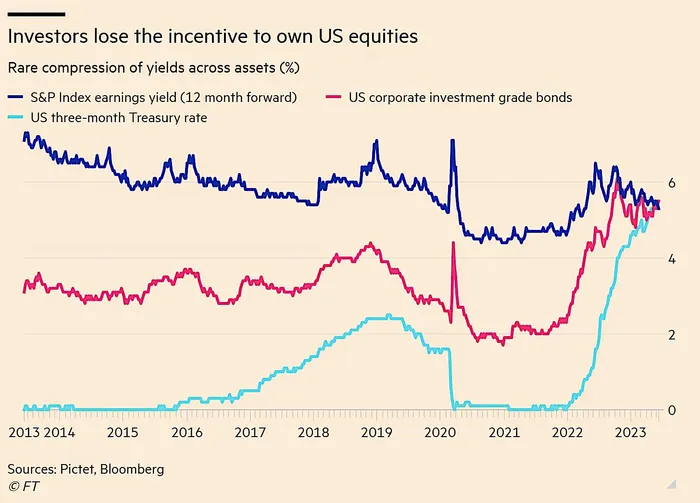
2023’s scorching rally has been called “unloved,” as a lotta institutional capital was left on the sidelines.
For example, value investooors have had a brutal year.

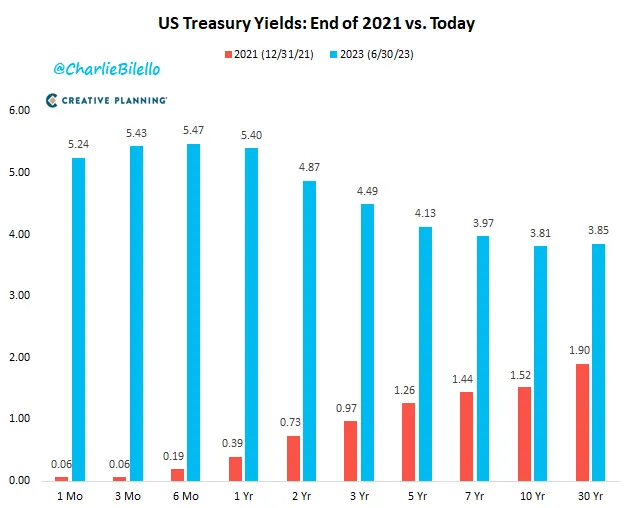
This is mostly due to the fact that Treasuries now offer the same yield as boomer dividend plays. And good ole Treasuries are, like, way safer and stuff, which is no bueno for yield-bearing stonks.
Another driver behind everyone being pissed off (technical term) is the market’s historically bad breadth. Per BofA, “only 23% of stonks outperformed the S&P 500 in May, the lowest of any month in our data history since 1986.”
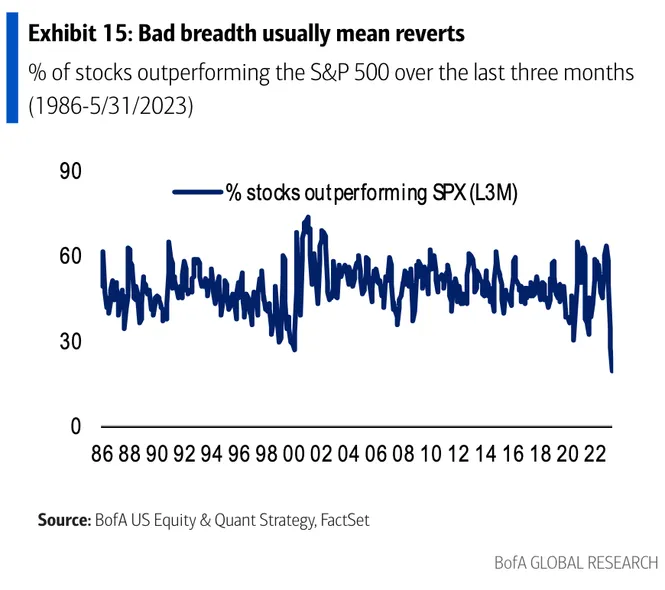
So basically, what’s happening is a handful of people are making a lotta money (à la Nvidia investors) while everyone else watches from afar.
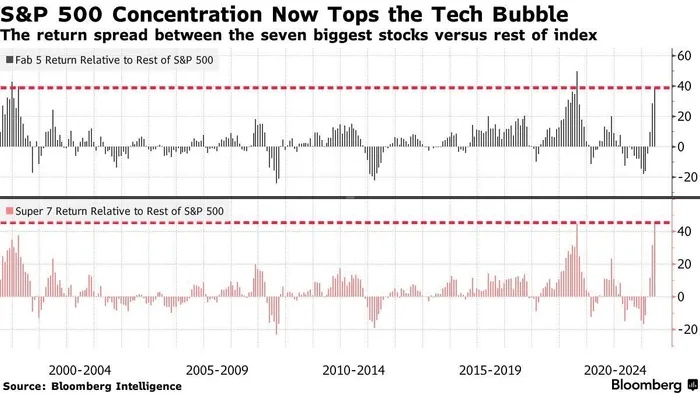
This is leading to all sorts of anger, jealousy and confusion over whether this is just a bear market rally (“ha, you just got lucky!”) or if this thing really has legs (“fk, I need to ape in now!”).
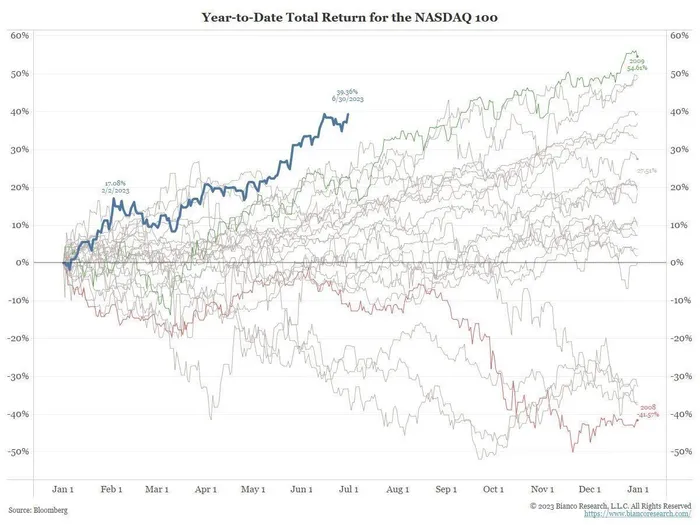
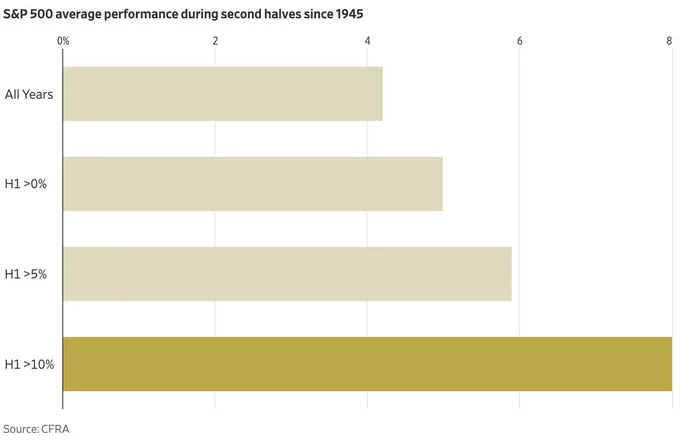
Fwiw backtests suggest that good first-half performances tend to lead to good second-half performances.
The most obvious threat to markets is the view that goes something like this:
“yea sure, we might’ve pamped 1H 2023. but that’s only because it takes like ~6 months for rates to ripple across the economy and actually make their impact felt. this has been the fastest tightening cycle ever. be patient; the pain will come. Remember, Druck predicted a hard landing in 2H 2023 — he still has ~6 more months to be proven right…” Gulp….
Let’s end with a few random but cool charts.
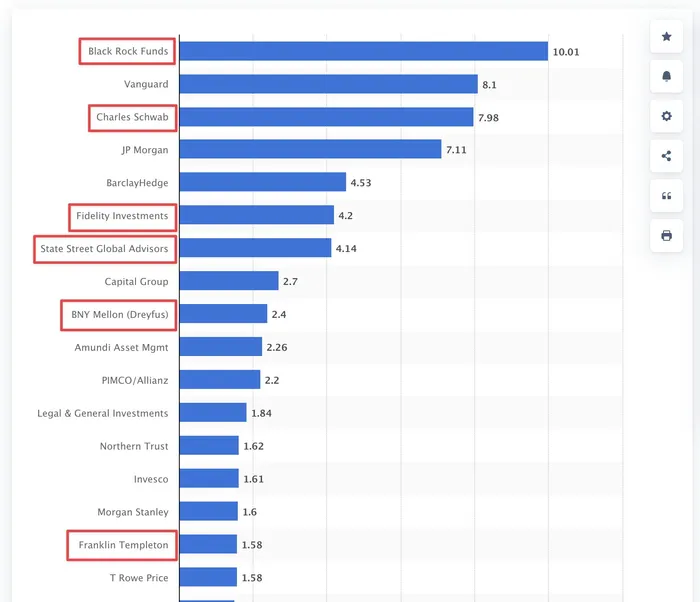
These are the world’s largest mutual fund groups by assets (in trillions). The ones circled in red have launched or plan to launch a crypto product.
chatGPT traffic declined from May to June. Unique site visitors worldwide decreased by 5.7%, and time spent on the site decreased by 8.5%. However, ChatGPT remains the 22nd most visited website globally, with around 1.7 billion monthly visits.
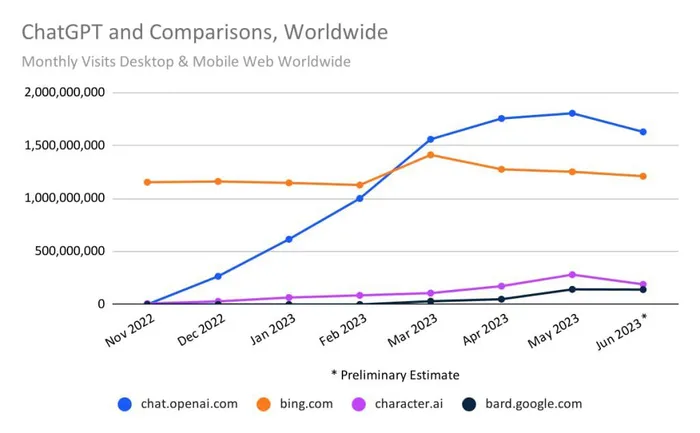
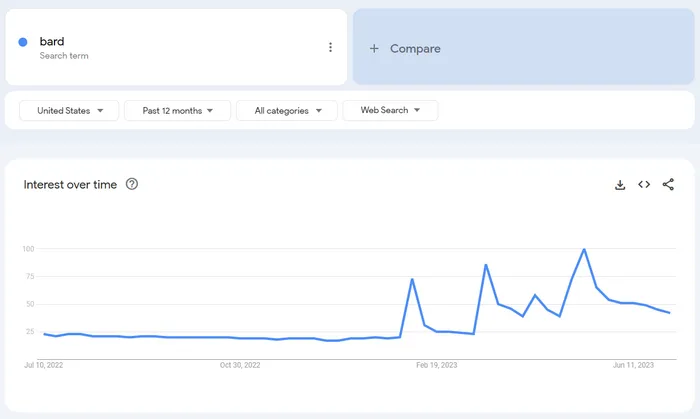
Some have speculated this is due to the novelty wearing off or because it’s summer vacation and students no longer need GPT (or Bard / any AI) to do their homework.
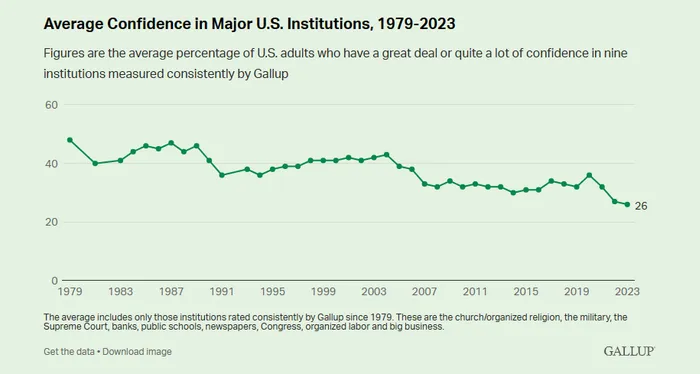
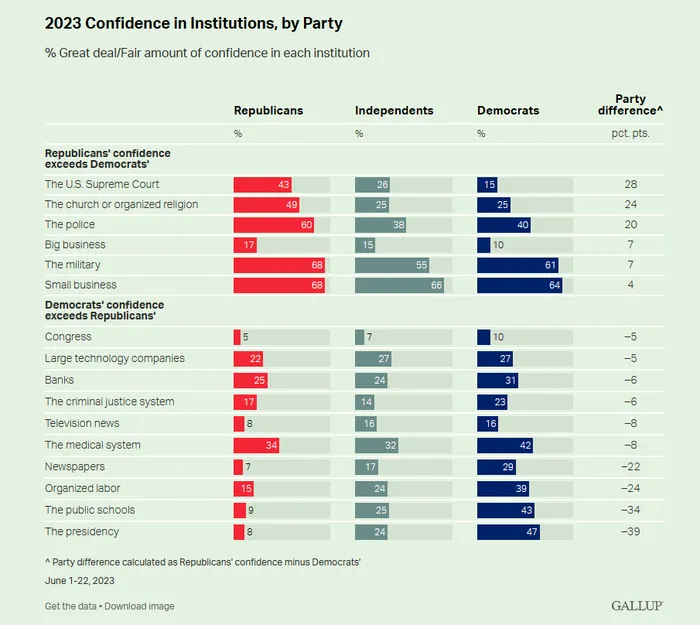
Gallup recently released new polling data that disturbingly finds that Americans’ faith in major societal institutions hasn’t improved over the past year following a slump in public confidence in 2022.
Unsurprisingly, sentiment splits along party lines wrt institutions like the Supreme Court and the presidency.
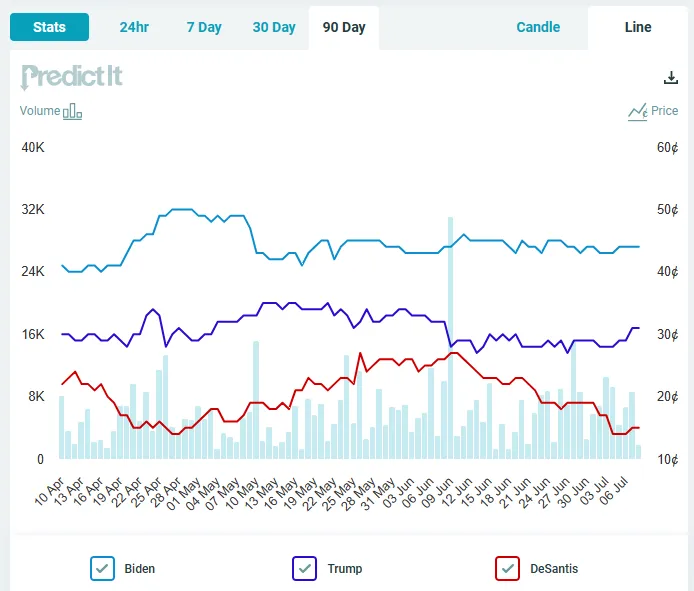
The pessimism has not yet affected the betting markets ahead of the 2024 presidential election, which have been mostly unchanged in recent months.
And to end on a more techno-optimistic note, OpenAI just released Code Interpreter to chatGPT Plus users. Plus users must opt in via settings.
This means if you’re willing to fork over $20/month, you get an enthusiastic AI data analyst (who never gets tired of Excel) with some pretty crazy capabilities. Here are a few examples of the kinds of data visualizations Code Interpreter can output:
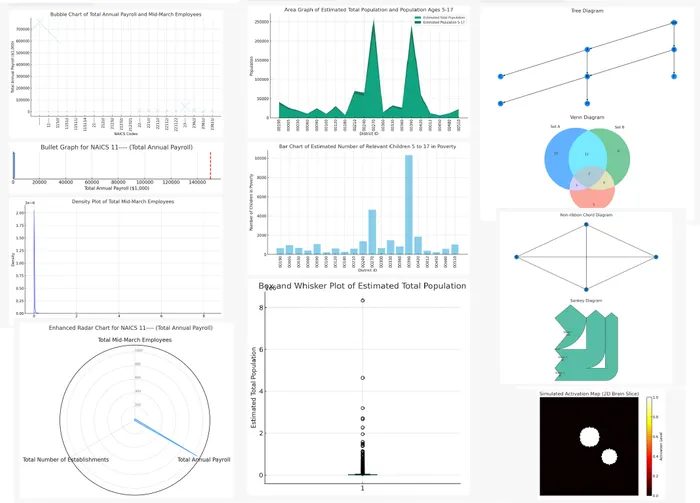
Ethan Mollick (@emollick on Twttr) is a great follow if you’re looking to learn more. He wrote a thread and blog post on his months-long experiments with the Code Interpreter that I’d highly recommend.
Signing off, see ya next week!