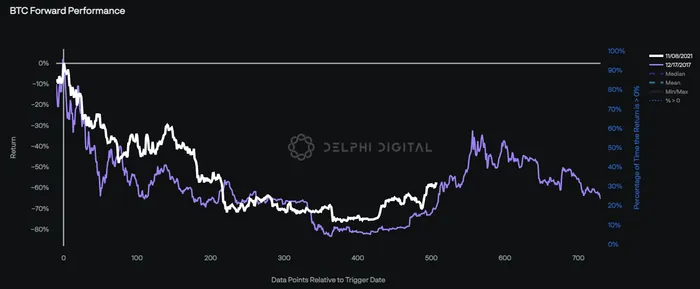
BTC continues to track the trend of its last cycle drawdown, including its recent recovery.
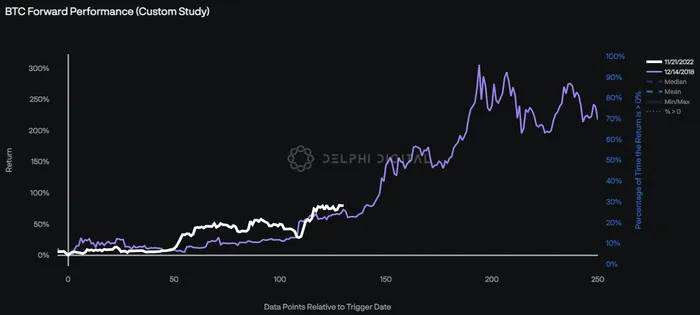
Using the Backtest Builder in our Datahub, we can visualize BTC’s rally from its November low to see how it’s tracking its post-bottom trend in December 2018 too.
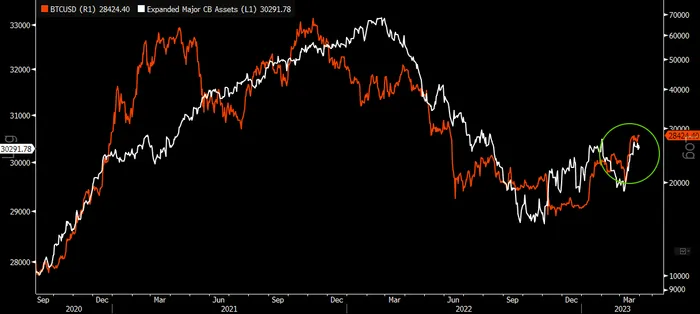
Both reversals were also characterized by shifts in macro sentiment, specifically bottoms in the global liquidity cycle and expectations that “peak tightness” may be behind us.
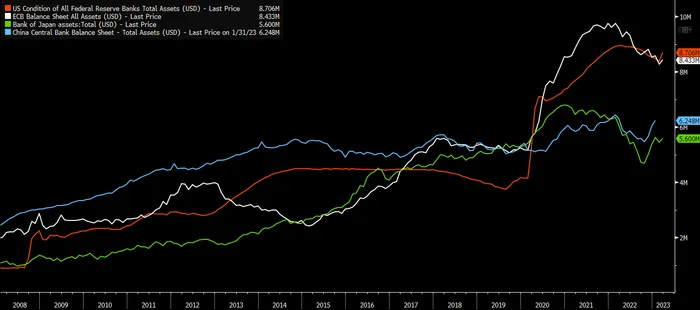
Major central bank balance sheets have expanded after bottoming in October, most recently led by the almighty Fed.
We’ve discussed ad nauseam how influential global liquidity is on asset prices, which is why a continuation of this trend is critical to avoid another retest of prior lows in my view.
Interestingly, the crypto market’s December 2018 bottom also coincided with the Fed’s last rate hike of the past cycle. The market is currently 50:50 on whether the Fed will raise rates another 25 bps at the early May FOMC meeting as consensus for rate cuts in 2H 2023 continues to gain steam.


