In our Market Frameworks reports, I often talk about market imbalances/inefficiencies. A few examples are volume gaps, liquidation events, and time/volume imbalances. In the below example we will look at recent price action demonstrating what time/volume imbalances are, and how I think about them. Using a TPO chart, we can easily see where an asset spent the most time and transacted the most volume. More often than not, time and volume distributions are very similar, and show no real actionable dislocations.
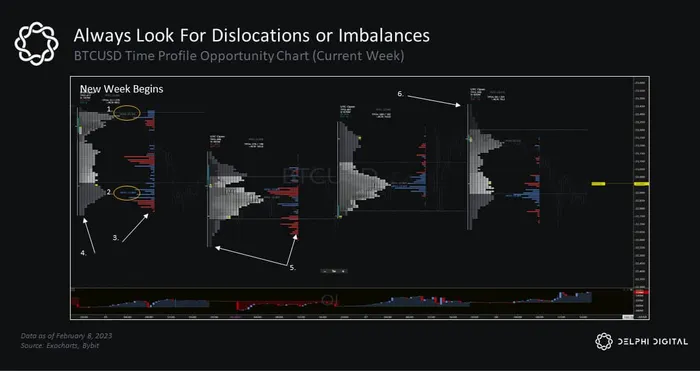
In the above chart, we can see each individual daily distribution, for both time spent and volume transacted. Focusing in on the first day of the week, we can make a few observations.
- The time distribution does not resemble a normal distribution, but more of a bimodal distribution. The level in which most time was spent occurred at the top of the daily price range, denoted by the tPoC label at $23,385 (time based point of control)
- The volume distribution does not resemble a normal distribution either. The level in which most volume was transacted occurred at the bottom of the daily price range, denoted by the vPoC label at $22,885 (volume based point of control)
- Decently wide price range on the first trading session of the week with selling into the lows, can be considered a trending day.
- Daily TPO chart has an unfinished auction/ledge (more than 1 TPO rotation, compare to the other TPO charts) at the bottom of the profile.
We can see a very obvious time/volume dislocation. Remember, we know that these metrics ‘want’ to resemble normal distributions as market activity continues. This means that fair value (for the week) is likely to be somewhere in-between the tPoC and the vPoC levels. Because of the time/volume imbalance and trapped sellers, we can likely expect prices to move towards the weekly session highs as these imbalances and offsides positions are purged from the market, (which did happen over the following sessions).
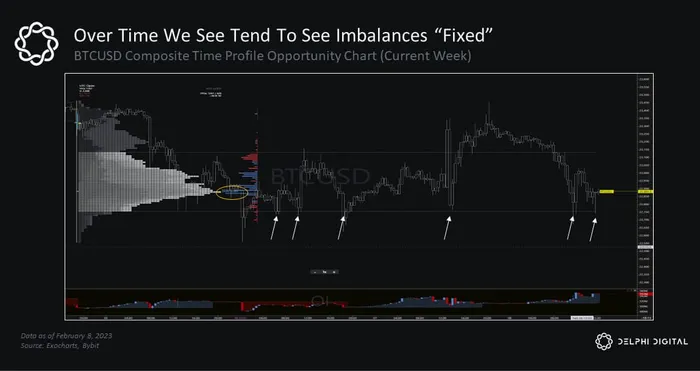
Using the above composite TPO chart, we can see how these time and volume imbalances tend to be ‘fixed’, as both levels are now at the same price level $22,870. We can also see how the composite distributions for the last 4 days are much more representative of a normal distribution (though not quite normal yet) versus the individual daily distributions. Sure seems like prices reflect statistical efficiency far more than fundamental efficiency.
