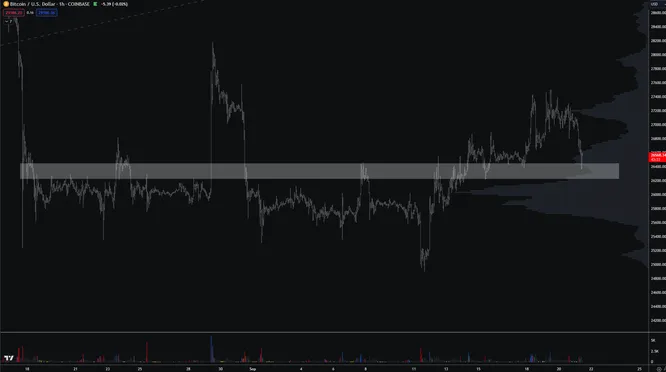
Last week on September 21, we discussed some intraday market dynamics as BTC pulled back from mid $27Ks into the mid $26K region.
More specifically, we noted a few things:
- “Prices have moved down consistently over the last several hours
- We see open interest levels increasing during this same time period
- We see funding rates gradually increase to the highest levels seen this week
- We also see SPOT CVDs with lacking participation
When we combine these factors, it is more likely than not that we have dip buyoooors moving in to fight this downside move.”
We concluded this short analysis with the below chart…

and left readers with the following takeaways:
ultimately bulls will want to see this lower timeframe region hold if they are to get another move higher. At the moment, this does not look too likely to me. I prefer to wait for some form of ‘wash-out’ before stepping in for a reversion type move.
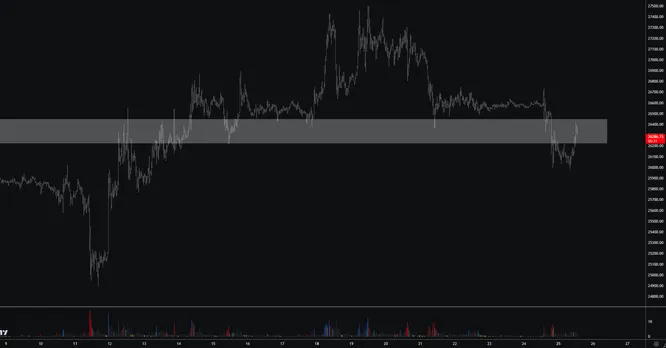
It has been several days since the original post was published…

and things have played out almost exactly as expected.
Bulls were able to defend the September 21 low at around $26.5K for a short time before ultimately succumbing to the bears, as prices sliced through the local lows before finding some respite at the $26K level.
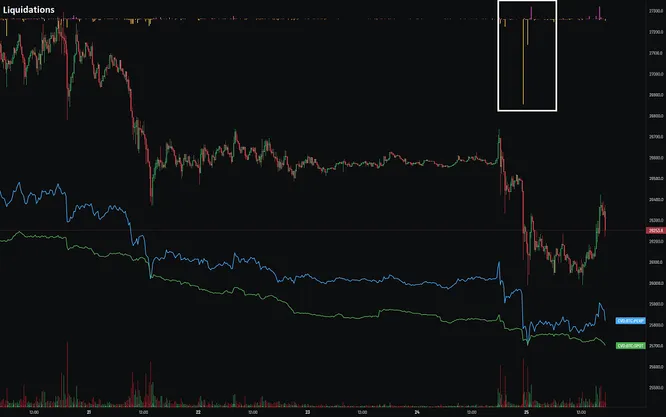
Last week, I mentioned how “I would prefer to wait for some form of wash-out before stepping in” for a shorter term mean reversion trade.

The above chart from v3.aggr.trade helps visualize this washout a bit more. The top pane shows liquidations (yellow = long liquidations, pink = short liquidations… or in other words… a washout). We can clearly see a washout occurring at this region when compared to the original price dump we wrote about on September 21.
This short exercise is a perfect example of what it means to wait for the situations that YOU want to trade, and not letting the market dictate which trades you take.