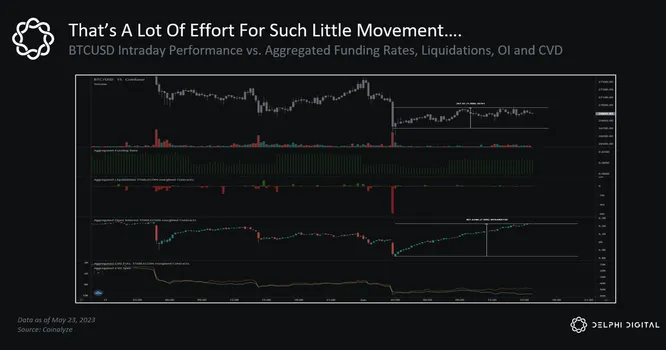
As many know, when analyzing market movements I always harp on about not using any single metric in isolation. Rather it is important to keep metrics in context with one another, as well as with general price movements. Think about it like a puzzle; it is hard to discern what the final image will be with only a few pieces put into place. When you get a decent amount of pieces put into their places (context), the overall picture becomes a bit more clear. Much like markets.
Market metrics like Open Interest, Funding Rates, Liquidations, and even CVD (cumulative volume delta) have become in vogue over the last crypto cycle. So much so that important context often gets overlooked with the new influx of people using and discussing these metrics online.

Since the lows at roughly $26.5K, prices have recovered to back to nearly $27K, gaining about 1% out of the local lows. Interestingly, we have seen aggregate open interest increase nearly 7%, with an additional 400M in OI added during this same time period.
Looks like quite a bit of effort (7% increase in OI) was needed for BTC to move up a meager 1%. Especially damning due to the liquidation wick prior to this time period. Remember, in the aftermath of liquidations, order books become more thin and prone to larger movements in price (which we have yet to see). Keep this exercise in mind when applying these metrics in future analysis.
While it is tough to know the exact positioning of participants during this time, given the added context around funding rates, it is same to assume that there is a decent amount of new long exposure tacked on in this region.