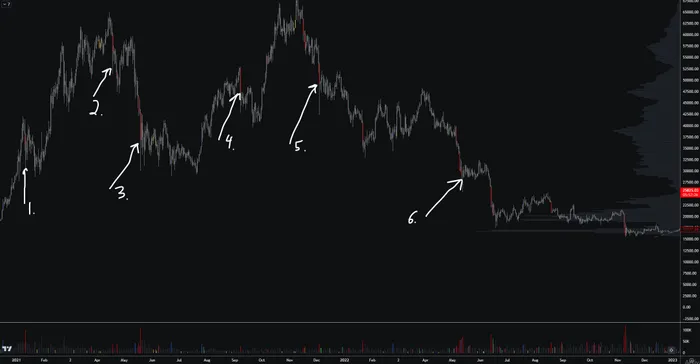
In the above tweet from yesterday, August 21st, I posted a chart that highlights similar liquidation cascades over the last 2 years. I wanted to specifically focus on liquidation events leaving behind very large wicks (30%+ of total candle size) to see if there is anything we can glean from prior price action. I’ve included the chart below, as well.

At quick glance, we see several of these “inverse god candles” over the last few years. More specifically, we see 6 of these events taking place. In each of these scenarios, BTC did eventually return and revisit the lows initially set by these liquidation cascades. Intuitively, this should make sense as well.

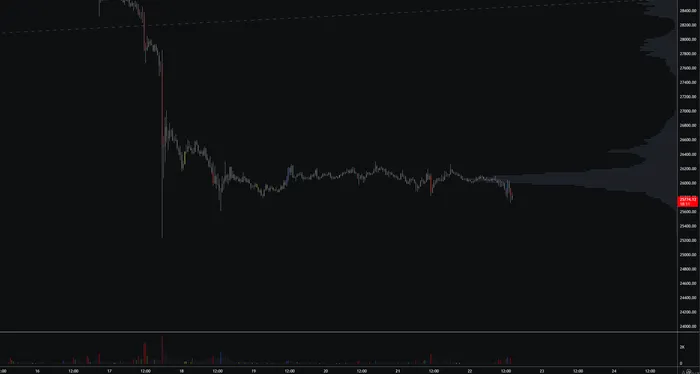
When we look at the most recent BTC liquidation cascade, it is hard to ignore the similarities. Given that BTC has finally broken down out of its 2 month range (post-initial ETF hype) on the back of this large liquidation event, the path of least resistance is likely continuation lower.

Low time frame price action looks to be supportive of this idea as general market apathy continues.

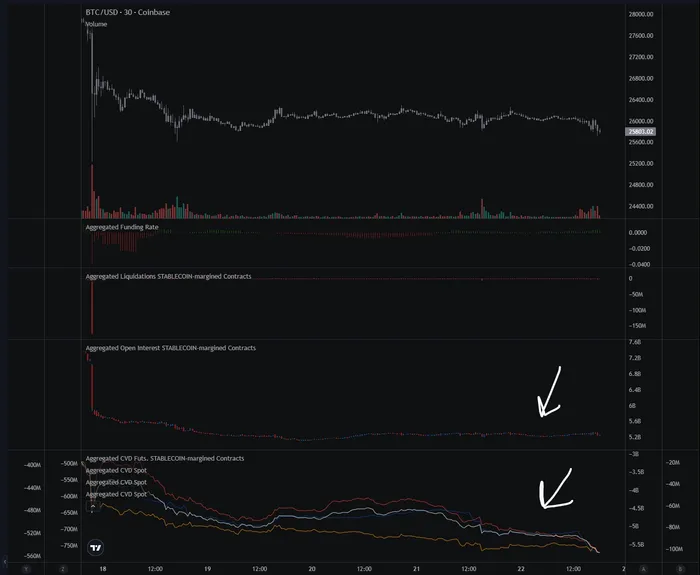
Market apathy that can be best visualized by depressed OI and spot activity. Ideally, bulls will want to see some semblance of spot/OI appetite return, but after such a big wipe, I expect it will take some time as it did in all prior instances.
Patience!