Welcome to the first installment of Charts of the Week, a new weekly series where we cover the coolest charts in the world.
Shoutout to Delphi’s resident gigabrains — Ashwath and Jason — for the inspiration behind this format. And without further ado, let’s get to some charts!
First off, we have Bloomberg’s latest ETF tracker, which may or may not be my new screensaver…
We should note that 8/13 is the date. If the SEC lets that filing thru, all the rest should follow. Steady lads…
![]()
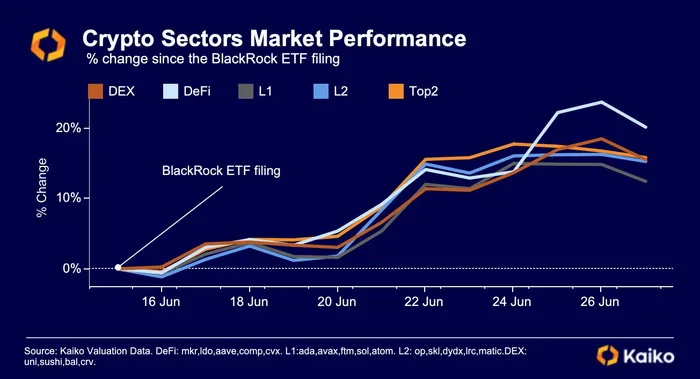
Amid the ETF hype, we’ve seen a clear risk-on move across the crypto space, with alts outperforming majors like BTC and ETH.
Next up is BTC’s 30D correlation with tech equities, which continues to roll over since it peaked at the beginning of the year. BTC’s ETF-related pamp and tech stonks’ minor correction largely drove the recent plunge.

We generally view a falling correlation as an encouraging sign. It allows asset managers to add BTC (and other internet money) to their books with confidence that it won’t just trade like tech stonks with extra beta. In the investment world, uncorrelated assets are worth their weight in gold, err, digital gold!
Moving away from the orange coin — staked ETH now exceeds ETH on centralized exchanges.
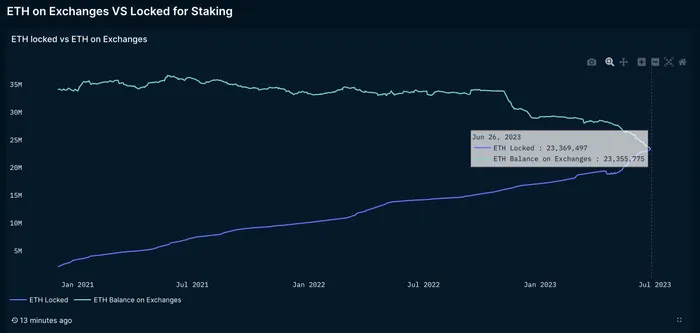
ETH held on CEXs has been sinking for most of the year. And investor flight only accelerated this month amid Sith Lord Gary’s lawsuits against Binance and BasedCoins.
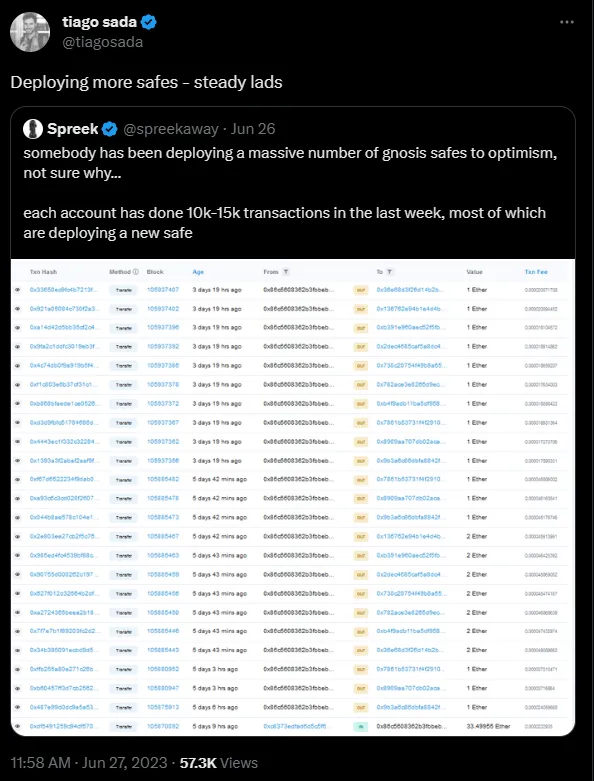
Eyeball scanner gud? New gnosis safes on Optimism are surging thanks to Worldcoin.

To date, Worldcoin has deployed over 1.4M safes.
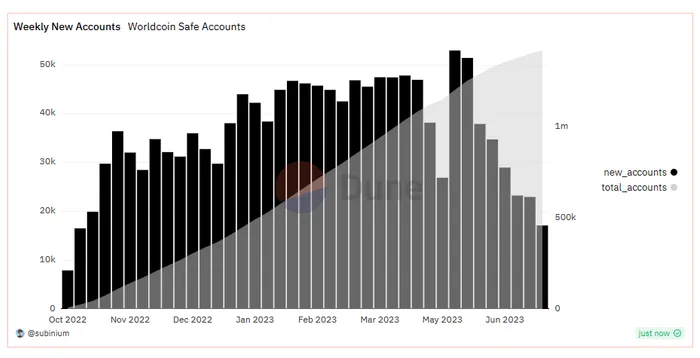
For context, Worldcoin — the eyeball scanning company founded by OpenAI’s Sam Altman — issues every Orb-verified human a smart contract wallet deployed on Polygon. Under the hood, this smart contract wallet uses Safe{Core}, an account abstraction stack by Safe — a decentralized custody protocol.
On the macro front, inflation continues to cool. The PCE index — one of the Fed’s preferred inflation gauges — is nearing the Fed’s self-proclaimed inflation target of 2%.

Despite the deflationary impulse emanating from stuff like, uh, milk…
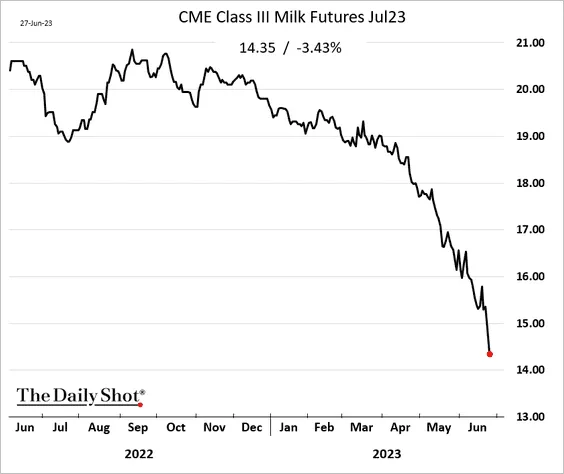
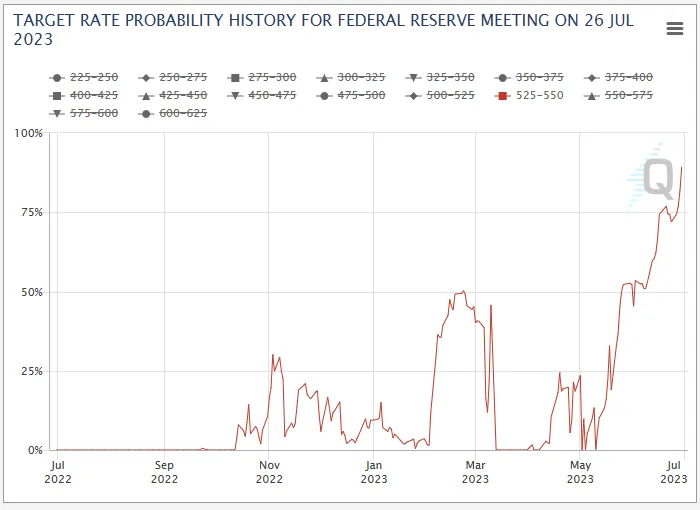
…traders are pricing in “higher for longer” rates.
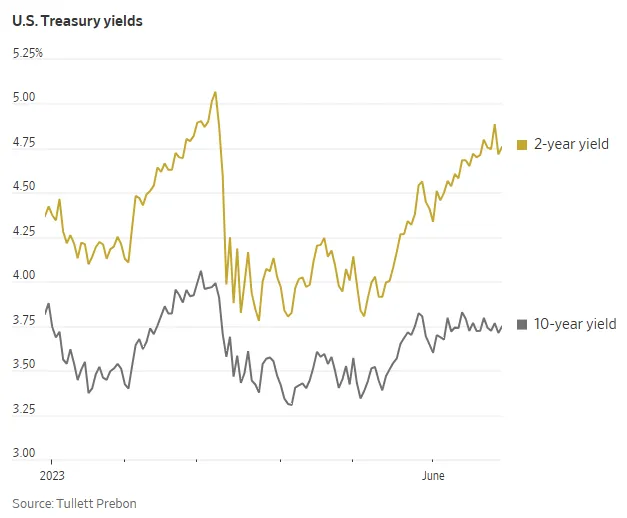
As a result, the Fed funds rate is now expected to peak in November.
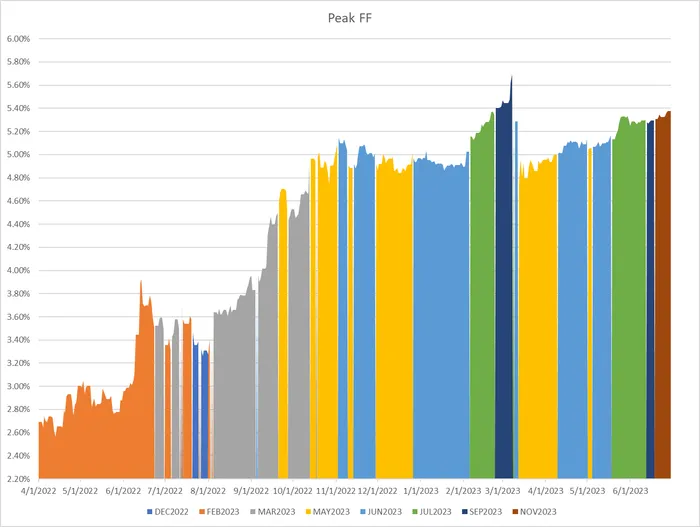
h/t @CourtHoover for the above visualization
There are several drivers here. Firstly, Fed hawkishness.

Despite pausing at the last meeting, JayPoww doubled down on the Fed’s intention to raise again before year-end. This achieved its intended effect, with the market pushing out peak fed funds and also pricing in an 89% chance of a hike at the July meeting.
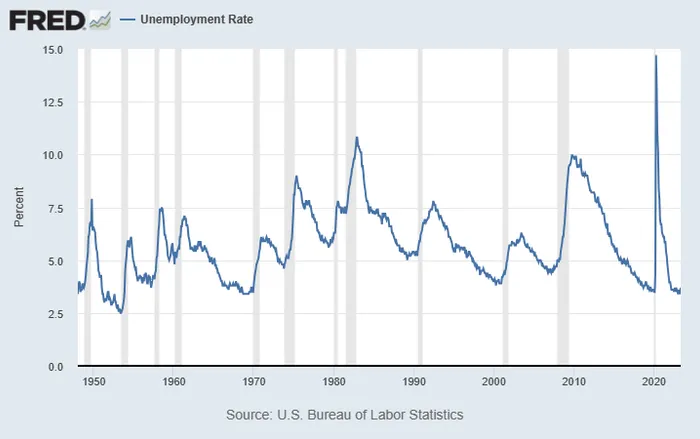
The second driver is the surprising strength of the labor market.
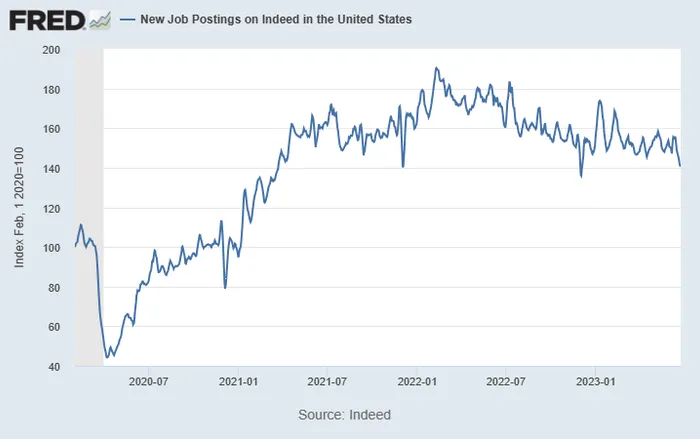
A historically tight labor market complicates the Fed’s calculus as it enables people to keep spendin schmoney, which provides an inflationary counterweight to the Fed’s hiking program.
However, it’s worth noting that the academic bandit squad at the Federal Reserve has been wrong many times before.
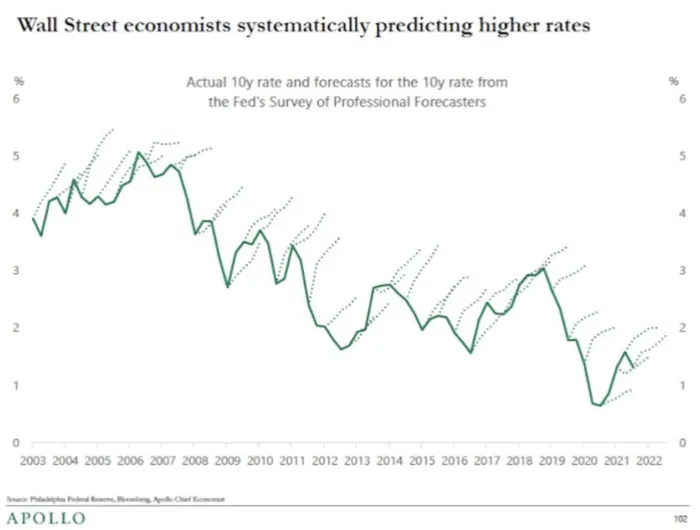
This is likely because, despite the Fed’s best wishes, it’s constrained by the $32T debt load and the $1.5T annual deficit, which necessitate low rates.
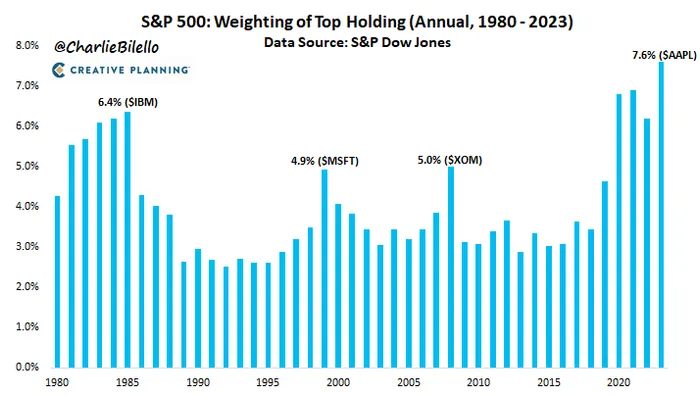
Shifting away from macro land — tech stonks continue to outperform, led by the granddaddy of them all: AAPL.
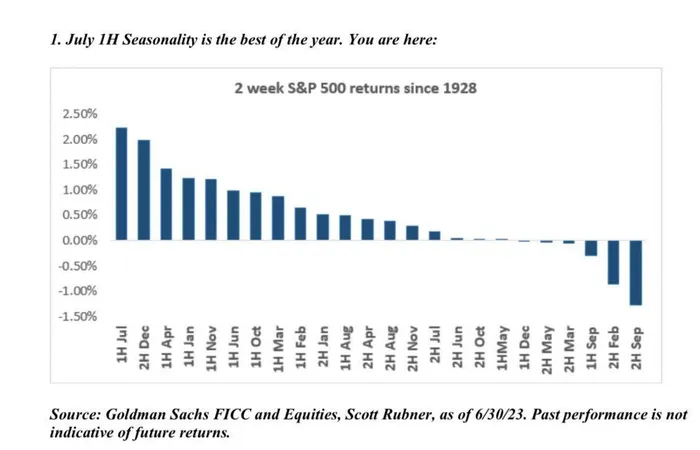
On the seasonality front:
“We are entering the best seasonal period of the year for US Equities. The first 15 days of July have been the best two-week trading period of the year since 1928…. July 17th is when equities start to fade.” – GS desk
And we’ll end this inaugural Charts of the Week with some, uh, deadly serious advice. On this July 4th weekend, be sure to stay away from floating, err, sinking death coffins!