I’ve teased the idea before that we’re likely in an environment more akin to something like 2015-2017. The more charts I drown myself in, the more I believe this is likely the highest probability scenario given where we are right now.
Risk assets like equities and crypto have been sniffing this out (as we’ve been noting for a while now).
If things play out as I expect them to, it has huge implications for the crypto market going forward. It also ties in well with the market cycle analysis we published in our latest Markets Deep Dive.
As we’ve noted before, a great starting point is to just look at how the market has been trading. The S&P 500 has been tracking its 2015-17 price action almost to a tee, including the timing of its double bottom.
 I remember all the doomsday calls back in 2015-16 and how widespread the uncertainty was.
Risk sentiment had soured, earnings were expected to take another hit, and many were calling for an even bigger selloff (even after global equities had already tumbled into a bear market).
Fast forward to today – there’s been plenty of uncertainty around a recession cutting the head off the rally in risk. But if you look under the hood, we’ve been in an earnings recession for a couple quarters now (similar to 2015-16).
 At the time, the outlook for global growth had also turned bleak as the US dollar was coming off its strongest surge in 15 years – again, similar to what we saw in 2021-2022.
 Gold has also been tracking its price action during that period.

Gold is a hedge against currency debasement, so it’s heavily influenced by changes in global liquidity cycles. Global Liquidity peaked in 2014, contracted through 2015-16, then resumed its uptrend.

Similarly, liquidity peaked in late 2021, contracted in 2022, and bottomed in Q4…which once again marked the bottom in risk assets.
But higher rates, high inflation, and renewed recession worries have all contributed to the general apathy toward risk assets this year.
Yet markets are forward-looking, and heading into this year equities were already pricing in a pretty significant growth slowdown — if not a full-blown recession…
 We’ve talked about how remarkably close the ISM has been tracking the trajectory of its prior cycles. And this is the big kicker behind this thesis. Turning points in the business cycle have historically been ripe opportunities to increase risk exposure.
 So what’s this all got to do with crypto? Everything. Because crypto market cycles are tied to bigger macro cycles.
Stick with me here, because everything comes full circle.
Despite all the parabolic charts, crypto markets are quite cyclical in nature. They’re also remarkably consistent, including:
- Timing from peak-to-trough bottoms
- How long it takes to recover to prior cycle highs
- Even the length of their subsequent price rallies to new cycle tops
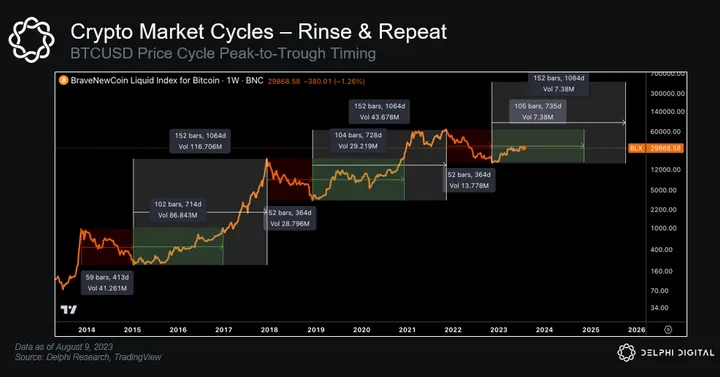 Using BTC as a benchmark, a crypto market cycle typically goes something like this:
- BTC hits new ATH
- Then suffers a ~80% drawdown
- Price bottoms 1yr after cycle top
- Takes ~2yrs to fully recover to prior cycle highs
- BTC rallies for another year before topping out at new ATH
The last few cycles have followed this blueprint almost to a tee.
Each of these cycles typically lasts ~4 years – and each of these cycles have lined up almost perfectly with cyclical changes in the business cycle.
 BTC’s price peaks have tended to occur right around the same time the ISM tops out. Active addresses, total transaction volumes, total fees – they all peaked alongside tops in the ISM too.
As the business cycle shows signs of recovery, so too does crypto activity levels.
 Even the timing of the Bitcoin Halving supports this, which is expected to occur in April 2024.
The last two halvings both occurred ~18 months after BTC bottomed and ~7 months before price broke to a new ATH.
If BTC follows its usual cycle playbook, that implies a new ATH by Q4 2024 (and new cycle peak by Q4 2025).
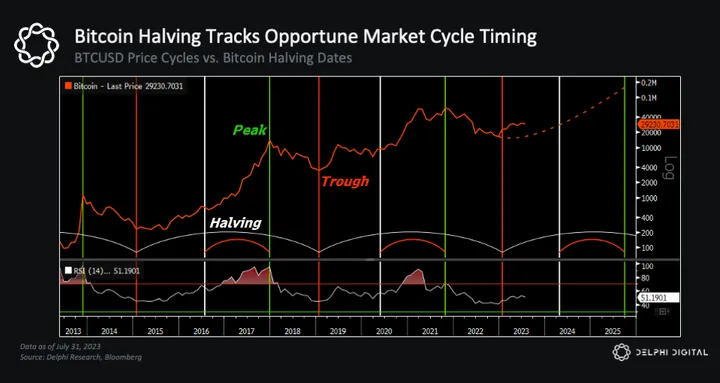 And just like prior cycles, the Halving is on track to happen at one of the most opportune times…after the ISM is expected to bottom and shows signs of recovery.
Rinse and repeat, like clockwork…
 Maybe I’m wrong, or maybe I’ve just been staring at too many Bloomberg screens for too many hours. But the more I stare, the more conviction I have that this is the highest probability outcome.
Now, just because the longer term outlook is getting brighter doesn’t mean we can’t – or won’t – suffer more corrections. This is actually the time when we could see another modest selloff or period of price consolidation (like we saw in 2019-2020), especially after the strong rally we’ve seen so far this year.
But directionally, this is why I believe the market will follow a similar path as prior cycles this time around – it’s not just by coincidence…