
This post outlines the performance of a backtested breakout setup built around the Hope Metric and R² divergence framework.
The goal is to quantify how BTC typically behaves after periods of emotional dislocation – defined by sustained low R² values, followed by a sharp re-alignment between sentiment and price. The setup captures what I believe is a structurally repeatable pattern in crypto markets: emotional tension building beneath the surface, then snapping back into price action.
👉 TLDR: Hope Metric setup that triggers after 3 or more days of R² below 0.3 followed by a break above has shown strong results since February. Across 7 triggers, BTC saw a median return of +6.2% by Day 5, with 86% finishing green. Adding a trend filter (BTC above 1D 20SMA) lifts Sharpe from 0.82 to 1.33, though that subset includes just 3 events. The sample is early, but the logic is sound and the number of signals will grow over time. This setup captures emotional snapback phases, ideal for long swing entries rather than blow-off moves… and its flashing again now. Read on for a more detailed dive.
Visualizing the Pattern
The chart below maps the core Hope Metric framework in action.
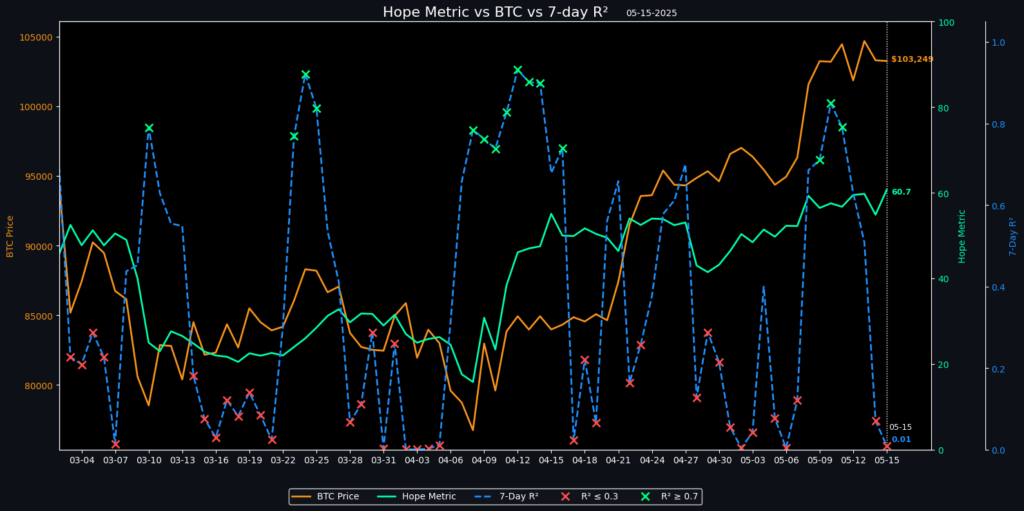
🟥 Red X = Emotional dislocation
...