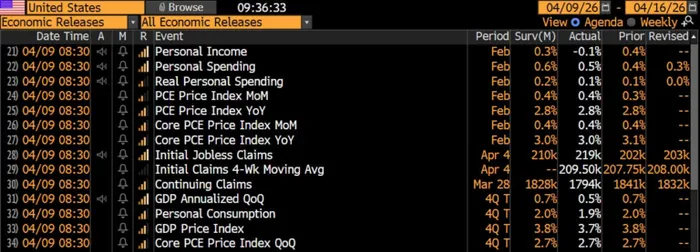
This morning’s PCE data confirms the US consumer was already softening back in February before the Iran war even kicked off. Headline inflation came in largely in line, but the more important signal is income and spending drifting lower. We’ve been flagging the deterioration in the credit cycle that was underway well before the conflict began. That’s now starting to show through in the hard data.
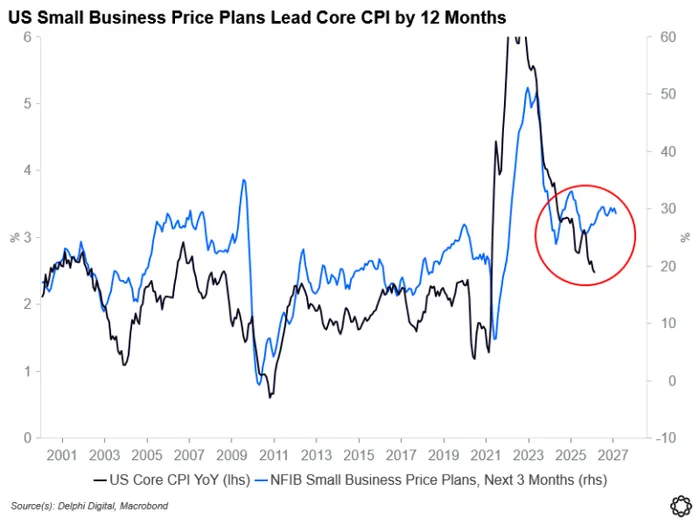
Looking at leading indicators, inflation pressures are unlikely to fade.
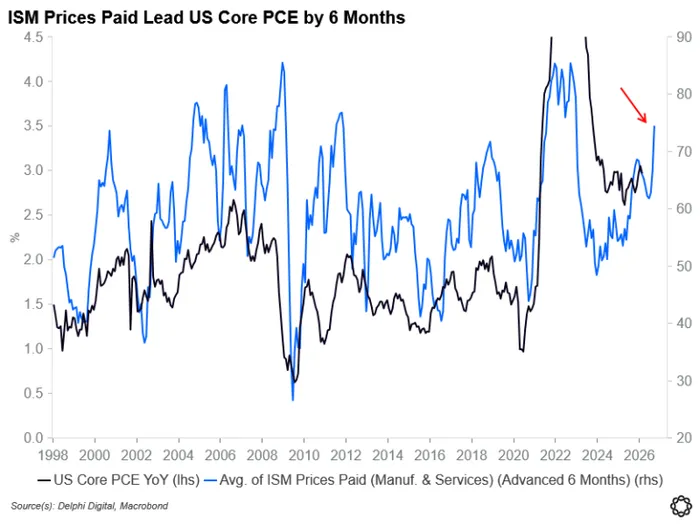
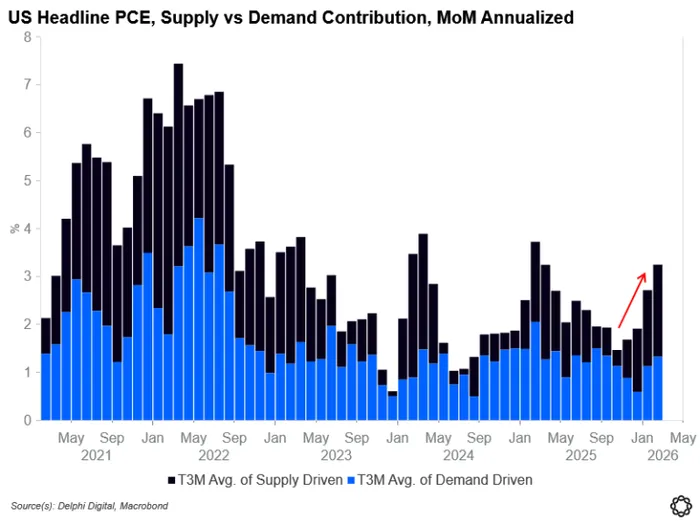
Not to mention the additional supply-driven inflationary pressures – which had been rising for the 5 months prior – likely coming from the war.
Leading indicators also suggest tomorrows CPI for March is likely to print higher.
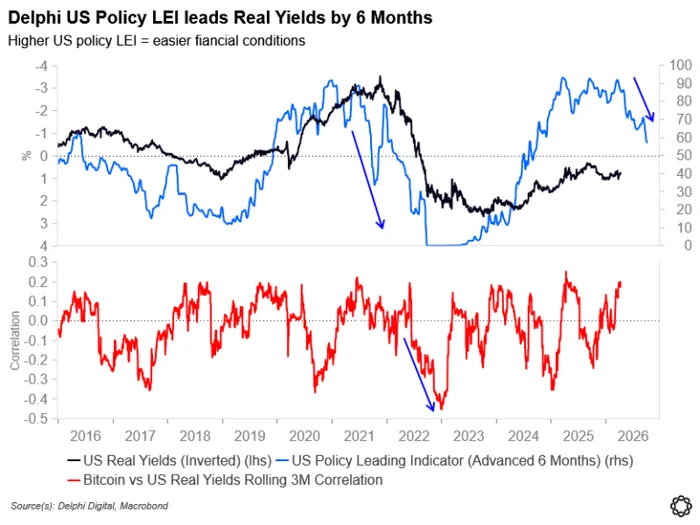
This is all conducive of the continued roll over in our US Policy LEI (falling = tighter monetary policy), which leads real yields by ~6 months (top pane in below chart). This is the same pattern that preceded the 2022 sharp rise in real yields.
If we repeat a 2022-type scenario of tightening monetary policy meeting an energy shock, the BTC implication is straightforward. The bottom pane in the chart shows Bitcoin-real yield correlation went deeply negative in 2022 (i.e. higher real yields = lower Bitcoin).