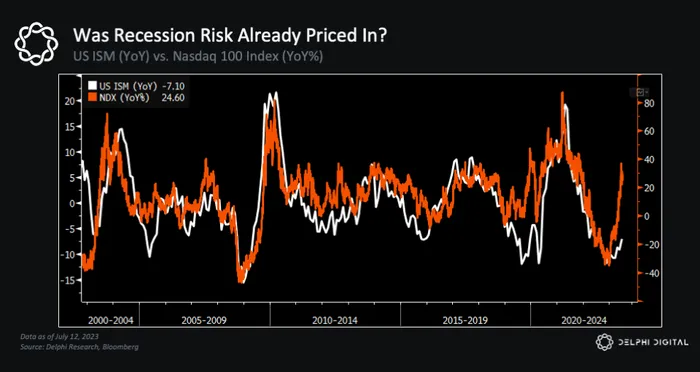
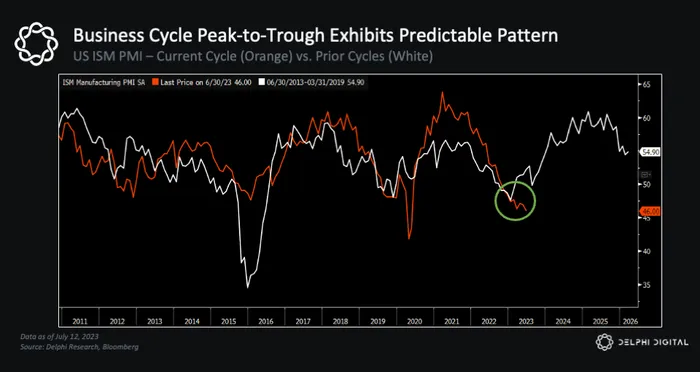
The US ISM is one of the best indicators for forecasting asset price trends, and it looks like its getting closer to the bottom of its two-year downtrend.
Markets are forward-looking, and heading into this year equities were already pricing in a pretty significant slowdown – if not a full-blown recession.
 What’s crazy is how closely the ISM has tracked the trajectory of prior cycles, including the timing of its peaks and troughs. Every 3.5 years, it’s rinse and repeat, like clockwork.
 Why does this matter? Because BTC usually shows signs of a reversal near ISM bottoms too – and so far, that’s exactly what we’re seeing.
 We dive into all this plus a breakdown of Coinbase’s ($COIN) latest rally in this week’s Bull vs. Bear.