A Fragile Absorption: The 2025 TGA Refill and the New Liquidity Regime
AUG 18, 2025 • 26 Min Read
Report Summary
Key Takeaways
-
TGA Refill Impact
-
The U.S. Treasury will refill its General Account (TGA) over the next 2–4 months, likely pulling $500–600B from the financial system.
-
Unlike 2023, buffers such as the Fed’s Reverse Repo Facility (RRP), foreign Treasury demand, and excess bank reserves are largely depleted—making this cycle more fragile.
-
-
Structural Vulnerabilities
-
Fed QT: Still draining ~$60B/month in liquidity.
-
RRP Depletion: Down to ~$28B (from >$2T in 2023).
-
Foreign Buyers Retreating: China and Japan have cut holdings by >$400B since 2021.
-
Bank Constraints: Regulatory limits + ~$482B unrealized losses reduce Treasury absorption capacity.
-
Global Reserve Shift: Dollar share of FX reserves falling (<58%), with rising allocations to gold and non-USD assets.
-
-
Market Implications
-
Short-term resilience (help from China’s easing, calm credit spreads, and low volatility).
-
Medium-term risks: higher funding costs, rising yields, and weak Treasury demand.
-
Crypto is most exposed given its high beta to liquidity cycles.
-
-
Stablecoin Reflexivity
-
Stablecoin supply contraction in past TGA refills (2023: –$5.1B, –4.15%) coincided with weaker crypto activity.
-
In 2025, with buffers gone, stablecoin contraction could hit harder.
-
However, stablecoins are increasingly buyers of Treasuries (>$120B holdings, projected to $1T by 2028).
-
New regulated stablecoins (e.g., USD1) may transform crypto into a liquidity absorber, not just a victim.
-
-
Timeline Outlook (2025)
-
Phase 1 (Aug–Early Sep): Risk assets may stay firm before refill begins.
-
Phase 2 (Sep): Liquidity shock from accelerated issuance.
-
Phase 3 (Late Sep–Nov): Fatigue phase; crypto underperforms.
-
Phase 4 (Dec–Jan 2026): Liquidity pressure eases; risk rally possible.
-
Summary
The report warns that the 2025 TGA refill is arriving in a far more fragile liquidity environment than in past cycles. Traditional absorption channels—Fed support, RRP, foreign buyers, and bank reserves—are weaker, making this round of Treasury issuance more disruptive to markets.
Risk assets, especially crypto, face short-term headwinds as liquidity is drained. Stablecoins sit at the center of this dynamic: historically collateral damage, but now evolving into major Treasury buyers. If stablecoin supply expands during the refill, it could soften the impact and signal a structural evolution in the liquidity regime.
Ultimately, the liquidity squeeze is temporary. By late Q4 2025, as the refill completes, conditions should ease, potentially setting the stage for the next rally across risk assets.
-
The Quiet Battle Over U.S. Liquidity
Beneath the surface of tariff headlines and inflation prints, a deeper liquidity tension is unfolding. It has the potential to reshape the balance of capital across Treasuries, risk assets and crypto markets in the months ahead.
As the U.S. move into the back half of 2025, the Treasury is preparing to refill its General Account (TGA). The TGA refill process is likely to begin within the next couple of weeks and has historically lasted for 2-4 months, resulting in an estimated pull of hundreds of billions of dollars out of the financial system. The last large scale TGA refill occurred in mid 2023, but was offset by over $2Tn in the Fed’s RRP facility, healthy bank reserves and strong foreign demand. Since then, each of these offsetting buffers have been eroded, leaving the current liquidity environment ripe for disruption.
From regulatory constraints on banks to fading foreign participation, the traditional channels that once absorbed Treasury supply are no longer as dependable. With less excess cash in the system, the liquidity impact of this TGA refill will be felt more directly. This could create a temporary headwind for risk assets – not an outright bearish turn – but enough to cap market enthusiasm at least until the process completes.
This report examines how the 2025 TGA refill intersects with a structurally tighter funding environment, what it could mean for digital asset markets and why stablecoins are becoming a meaningful part of that equation.
A quick primer on the TGA
The Treasury General Account (TGA) is the U.S. government’s primary operating cash balance held at the Federal Reserve. You can think of it as a centralized account for federal receipts and disbursements (from tax inflows and Social Security payments to Treasury redemptions and interest payments).
Like any bank account, the TGA balance fluctuates daily, rising with debt issuance and falling with spending.
During periods of fiscal constraint such as debt ceiling standoffs, the Treasury often draws down the TGA to fund obligations without new borrowing. Once that constraint is lifted, it must refill the TGA by issuing more debt than needed for immediate obligations. This is not just an internal cash management function but also a powerful macro liquidity operation that can pull hundreds of billions of dollars out of private markets.
Why This Refill Cycle Is More Fragile
While TGA refills are a recurring feature of U.S. fiscal operations, the current cycle is unfolding under materially more fragile conditions than in prior years.
Compared to 2023, the financial system now faces fewer liquidity buffers, tighter balance sheet capacity, and a diminished foreign bid for Treasuries. The structural ability to absorb large-scale issuance has weakened across all major channels. If the Federal Reserve maintains its tightening stance or delays a pivot, the resulting mismatch between supply and available demand could drive up funding rates and spill over into broader risk assets including crypto.
The Scale of the Drain
According to Seeking Alpha’s liquidity analysis, the Treasury may need to issue between $500-600 billion in net new debt over the next 2 to 4 months to restore the TGA to a healthy operating level.
That estimate was reinforced by the Treasury’s official Q3 borrowing projection released on July 29, forecasts $1.007 trillion in net marketable debt issuance for the quarter. The sharp upward revision reflects a lower starting TGA balance (~$457 billion), weaker-than-expected cash inflows and a near-term spending profile that remains elevated relative to prior expectations.
This magnitude is in line with the 2023 post-debt ceiling refill, which saw ~$550B in net issuance between June and August. But unlike last year, this cycle is starting with far less cushion.
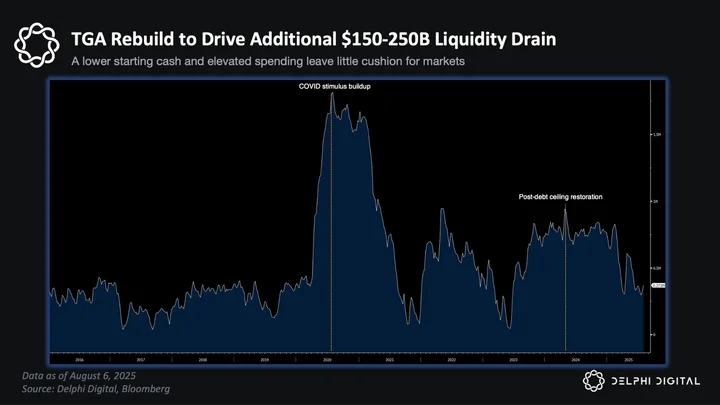
After falling below $300 billion earlier this year, the TGA is now being rebuilt toward a $850 billion target, implying another ~$250-300 billion of issuance-driven liquidity drain ahead.
This cycle, however, faces 5 significant structural vulnerabilities which we will explore in detail below:
- The Fed is still draining liquidity through QT
- The Reverse Repo Facility has lost most of its buffer capacity
- Foreign buyers have stepped away from the Treasury market
- Banks are facing structural balance sheet constraints
- And perhaps most importantly, the entire global reserve framework is shifting in real time
The Fed is still draining liquidity through QT
The Federal Reserve continues to actively drain liquidity from the financial system via quantitative tightening.
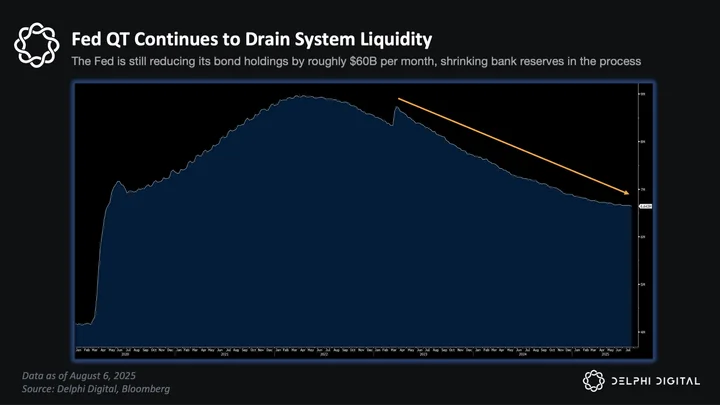
As of mid-2025, the Fed is still reducing its bond holdings at a steady pace (roughly $60 billion per month), directly shrinking the pool of bank reserves. This ongoing balance sheet runoff stands in contrast to 2019’s experience, when the Fed was forced to halt QT early to avert reserve scarcity in funding markets. No such pause has occurred this cycle.
In fact, even after the bank turmoil of 2023, the Fed kept trimming its balance sheet signaling a commitment to tightening financial conditions. The result is a persistent liquidity headwind: instead of providing accommodation, the Fed is withdrawing cash from the system. This makes the backdrop fundamentally more fragile than the prior TGA refill episode, as markets are now contending with a central bank that is simultaneously siphoning off liquidity while the Treasury is adding new supply.
The Reverse Repo Facility has lost most of its buffer capacity
A key buffer that softened the 2023 TGA refill is now largely depleted. During the last debt-ceiling episode, over two trillion dollars of excess cash was parked in the Fed’s Overnight Reverse Repo Facility (RRP), and much of the TGA rebuild was absorbed by money market funds drawing down those balances.
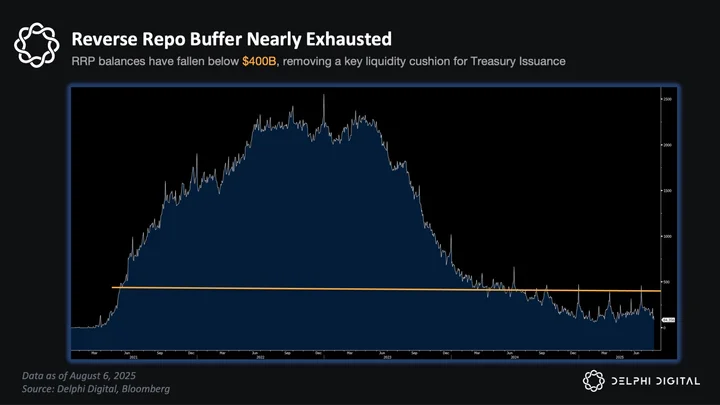
That dynamic acted as a release valve: RRP balances fell by nearly $1 trillion during the 2023 refill, while bank reserves held steady and funding markets stayed orderly. It allowed the Treasury to rebuild its cash balance without triggering broader stress.
But that cushion is now spent. As of mid‑August 2025, RRP balances have plunged to just $28.8 billion, the lowest level since April 2021. With that buffer depleted, any new Treasury issuance must now draw from more sensitive areas such as bank reserves, private repo, or money market reallocations.
In short, the money-market safety valve that protected markets in 2023 has largely been expended. The downstream effects from tighter reserves to rising short-term rates are already beginning to show. We explore those live stress signals in the next section.
Foreign buyers have stepped away from the Treasury market
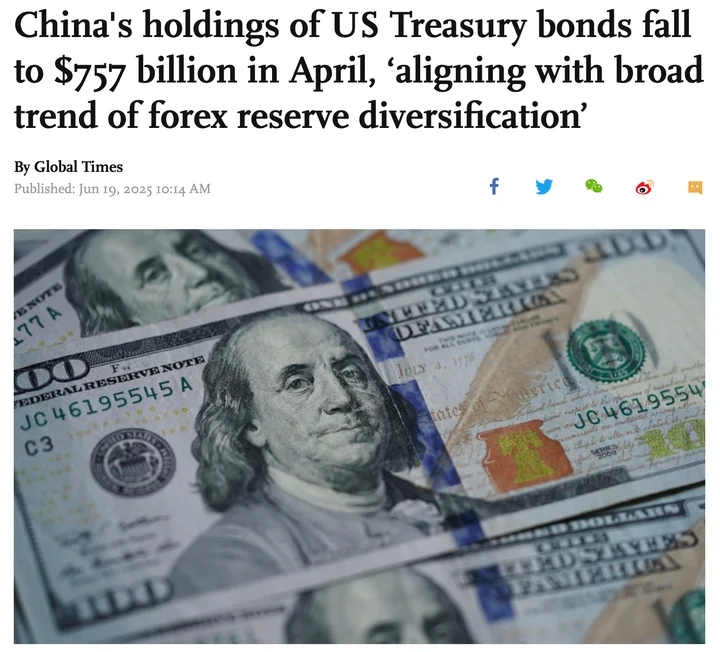
Another structural vulnerability is the retreat of foreign buyers from U.S. Treasuries. For decades, overseas central banks and investors – notably China and Japan – were reliable sources of demand, helping absorb American debt issuance but that support has waned.
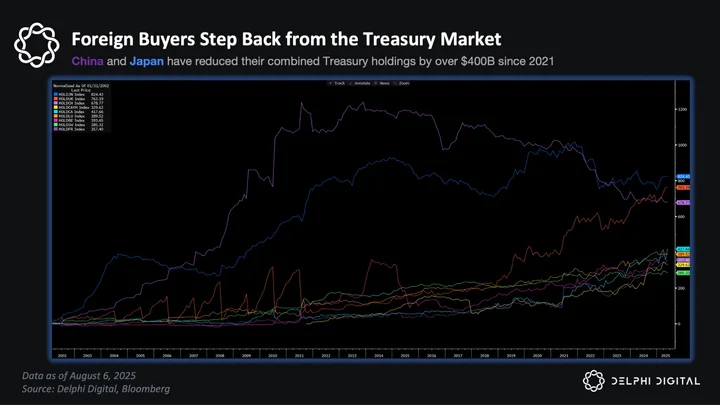
Treasury data show that China and Japan have collectively reduced their Treasury holdings by over $400 billion since 2021. China’s portfolio is now at its lowest level in more than a decade, hovering near $800 billion down from over $1 trillion just a few years ago. Japan’s holdings have similarly declined, recently settling near $1.1 trillion well off the ~$1.3 trillion peak.
This pullback reflects a mix of drivers from geopolitical friction and diversification goals, to domestic priorities like Japan’s yield curve control or China’s reduced dollar appetite.
Whatever the cause, the effect is clear: As foreign holders now account for a shrinking share of total U.S. public debt holdings, the burden of absorbing new issuance increasingly falls on domestic players. In 2023, money markets and U.S. institutions were already stepping in to fill that gap. Heading into late 2025, with another $500-600 billion in net issuance expected for the TGA refill, the absence of foreign demand on the long end of treasuries will place even greater stress on those same channels, at a time when overall debt levels continue to rise with no signs of slowing.
That could pressure yields higher to clear auctions or raise the risk of volatility if demand softens.
Banks are facing structural balance sheet constraints
The ability of the banking sector to absorb market shocks and finance Treasury issuance has been structurally diminished. Coming out of the 2023 liquidity cycle, banks are grappling with a set of balance sheet pressures that limit their willingness and ability to take on new assets like Treasuries.
A key constraint has been regulatory capital treatment, particularly the enhanced Supplementary Leverage Ratio (eSLR), which has required large banks to hold capital against even the safest assets like reserves and Treasuries. That picture may now be starting to shift.
In mid-2025, U.S. regulators proposed easing the eSLR rules for GSIBs. The new framework would replace the flat 5% threshold with a dynamic ratio tied to each firm’s systemic risk score, potentially reducing effective leverage constraints to the 3.5%-4.25% range and freeing up billions in capital.
In theory, that would give banks more headroom to expand balance sheets and re-engage with the Treasury market. For example, the 2020 exemption encouraged banks to accumulate Treasuries. However, the reversal to sell treasuries was just as swift once the exemption ended.
In today’s environment, that reluctance persists. Banks remain structurally more risk-averse than during the 2010s when they played a larger role in absorbing Treasury issuance.
As of Q4 2024, U.S. banks held approximately $482 billion in unrealized securities losses, a substantial sum that climbed 32.5% from the prior quarter
Treasuries and mortgage-backed securities make up the bulk of those paper losses, limiting risk appetite and balance sheet maneuverability. Unrealized mark-to-market pain especially on longer-duration Treasuries and MBS has materially weakened banks’ ability to take on additional duration risk. Most banks are now holding these assets to maturity, reducing secondary market activity and dampening demand for new issuance.
While the SLR reform is still in its proposal phase, large banks are unlikely to move until final rules are confirmed and market confidence improves. In aggregate, the banking system’s flexibility remains lower than in past cycles.
The global reserve framework itself is undergoing a fundamental shift
Finally, a broader paradigm shift in the international monetary system is undermining the backdrop of U.S. dollar liquidity. The post-2000 “dollar-centric” reserve framework where global central banks recycled trade surpluses into U.S. Treasuries and treated the dollar as the unquestioned primary reserve currency is gradually fracturing.
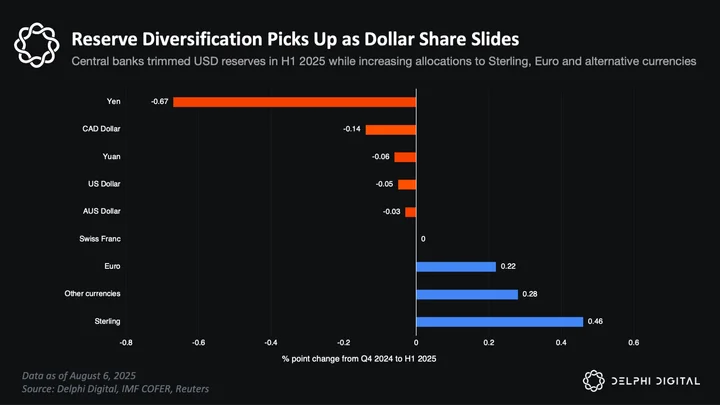
The USD’s share of global foreign exchange reserves has been on a downward trajectory, slipping to just under 58% by early 2025 (from about 65% a decade earlier, and over 70% two decades ago). Major reserve holders are diversifying into other assets and currencies such as Gold.
Central banks trimmed U.S. dollar reserve exposure by –0.05% in Q1 2025, while increasing allocations to sterling, euro and other currencies. The shift marks a continued move toward a more multipolar reserve system.
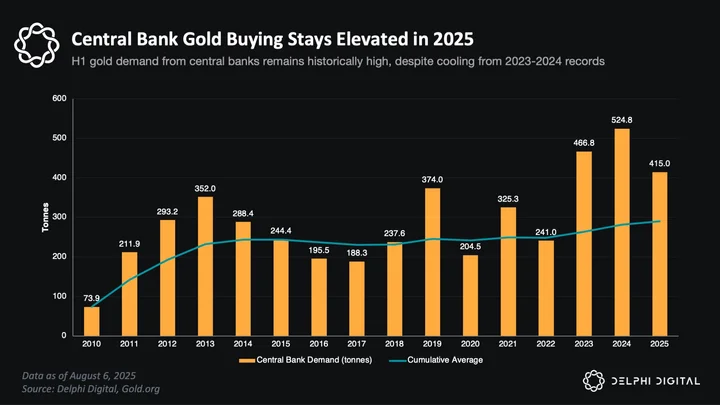
Central banks added 415 tonnes of gold in the first half of 2025, marking a continued pace of historically elevated demand. While down from the record-setting totals of 2023 and 2024, H1 2025 purchases remain well above trend with demand still 41% higher than the 2010-2021 average.
This aligns with findings from the World Gold Council’s 2025 survey, which found that 95% of reserve managers expect to continue increasing gold holdings over the next year.
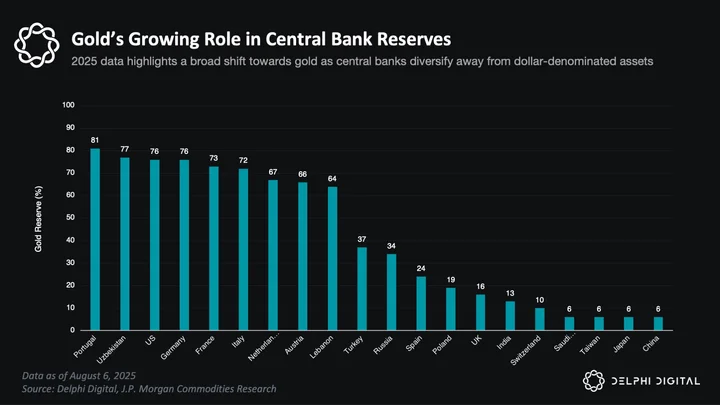
Research by J.P. Morgan shows that central banks like Portugal (81%), Germany (76%), and the U.S. (76%) already allocate the vast majority of their reserves to gold – but 2025 data shows a rising trend among others like Russia (34%), Turkey (37%), and India (13%). This reflects an ongoing shift away from USD concentration and toward strategic autonomy in reserve management. Even countries with relatively low gold allocations, like China and Japan (6%), are participating in the global pivot.
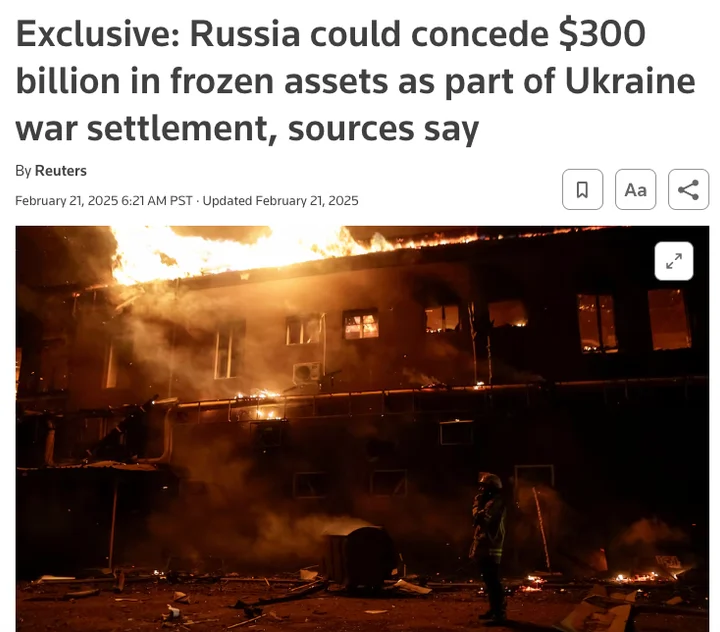
Alongside this, many are actively exploring non-dollar reserve currencies, bilateral trade arrangements and alternative settlement systems in an effort to diversify away from U.S. financial exposure. Geopolitical events have also catalyzed this shift – for instance, the freezing of Russia’s dollar reserves in 2022 raised awareness about the risks of over-reliance on U.S. assets.
Countries like China, Russia, and members of the BRICS are actively seeking to conduct more trade in non-dollar currencies and even discussing new reserve frameworks or payment systems outside dollar hegemony. This fundamental reorientation means the implicit support that the global reserve system used to provide to U.S. liquidity is no longer assured. In prior cycles, emerging market central banks and petro-states would swiftly absorb U.S. Treasury issuance as part of their reserve accumulation.
Taken together, these 5 structural vulnerabilities reveal a system with far less shock absorption capacity than in prior cycles. The Treasury’s need to raise hundreds of billions in new debt may collide with a reality where traditional buyers are either constrained, disinterested or already full. That forces the liquidity burden to shift elsewhere and raises the stakes for every part of the capital stack.
In the next sections, I examine what this setup means for liquidity, how it might impact crypto markets and risk assets more broadly.
Liquidity Supports Still in Play, But Headwinds Building
Over the past several months, global liquidity conditions have been shaped by a tug-of-war between central bank easing abroad and tightening forces at home. Some supports remain in place cushioning risk assets for now, but these tailwinds are showing early signs of fatigue.
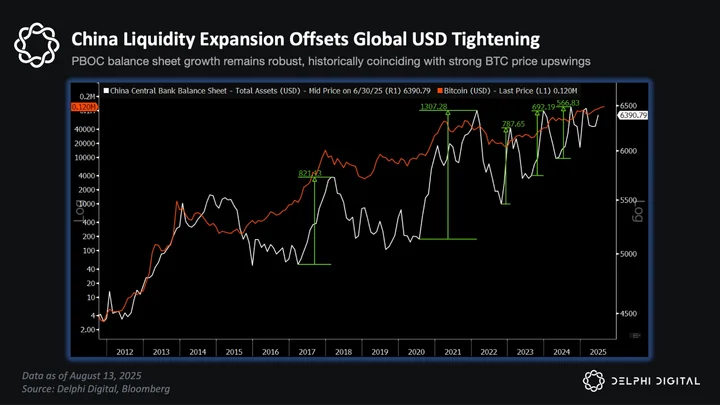
One notable offset to U.S. tightening comes from China. The PBOC has been expanding its balance sheet, injecting liquidity into domestic markets as part of its growth-support measures. While the intent is local, these flows can ripple outward, supporting commodities demand, regional trade partners, and global cross-asset sentiment.
Rates markets are also playing a role in keeping liquidity transmission channels open.
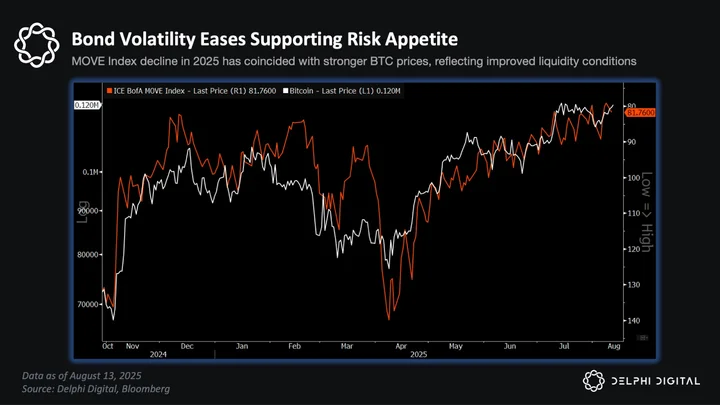
Bond market volatility, as tracked by the MOVE Index, has eased steadily since April. Lower volatility encourages demand for duration and supports leveraged trades like the UST basis trade. The risk is that a TGA-driven liquidity drain could cause a sudden spike in volatility, flipping this from a tailwind into a headwind almost overnight.
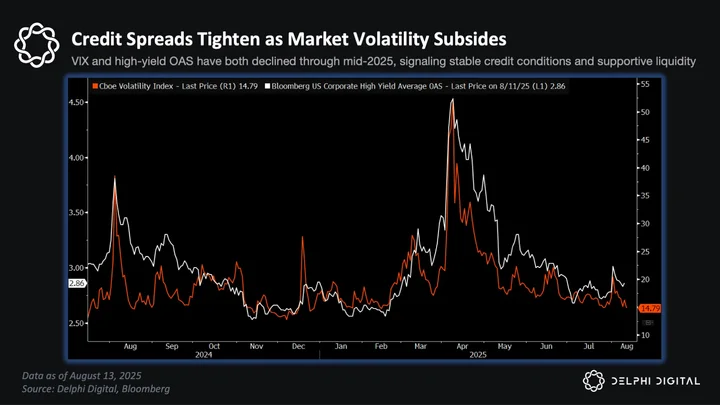
Credit markets are telling a similar story.
High-yield spreads have narrowed to near cycle lows, while equity volatility (VIX) remains muted. These conditions point to limited stress in funding markets, which continues to support risk-taking behavior. The caveat is that both spreads and equity vol are fast-moving early-warning indicators, if they start to widen in tandem liquidity stress can escalate quickly.
Tightening Forces Are Gaining Momentum
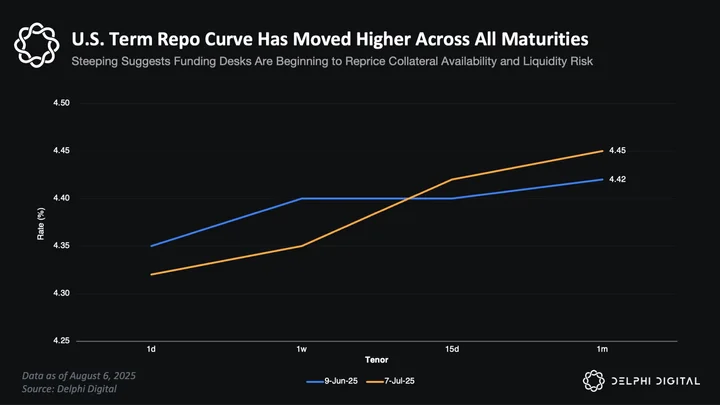
While external supports have kept liquidity conditions from tightening sharply, the U.S. is still on a clear tightening path. Short-term funding costs have been inching higher, with repo and short-dated Treasury yields gradually climbing.
This reflects both underlying reserve scarcity and the anticipation of heavier Treasury issuance tied to the TGA rebuild. If issuance ramps up without sufficient absorption channels, these rates could move higher at a faster clip, pressuring leveraged positions.
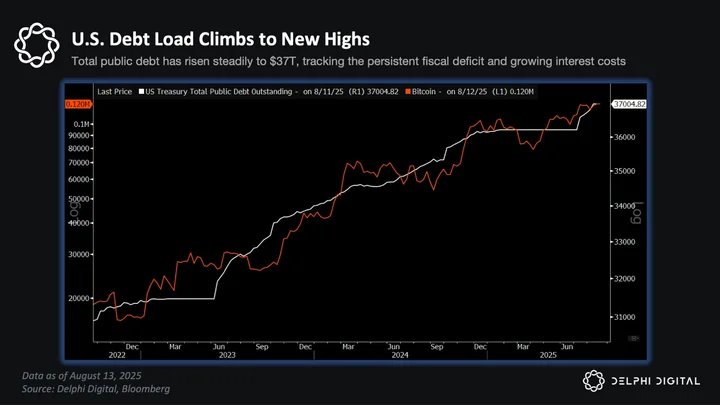
That issuance pressure is already visible in the debt trajectory.
Total U.S. public debt continues to rise, with steady month-over-month increases adding to the supply overhang. For markets, the concern isn’t just the level of debt, but the sustained pace of issuance required to fund it – particularly in an environment where traditional buyers are stepping back.
Foreign Demand Is Changing Shape
One reason the market feels tighter is because of a shift in who is absorbing U.S. debt.
Foreign buyers who are historically key players in long-term Treasury demand are increasingly favoring short-dated paper. Cross-border flows into the 1-3 year bucket remain positive, but there’s clear net selling at the 10-year and beyond. This skew leaves the long end more reliant on domestic buyers, who face their own balance sheet constraints.
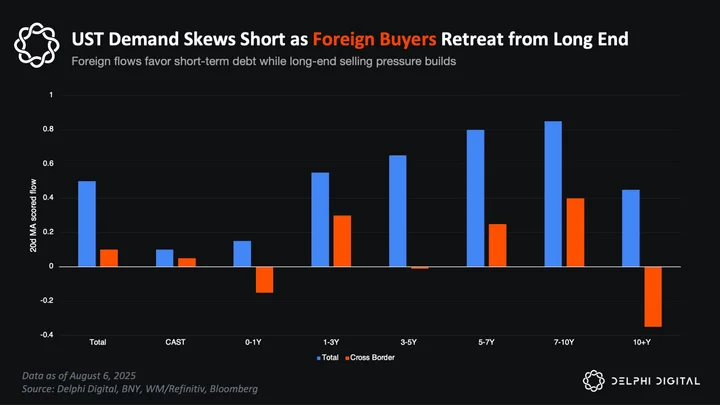
This matters because heavier issuance at the long end, combined with reduced foreign sponsorship, increases the duration risk U.S. investors must absorb. It also amplifies the sensitivity of long-term yields to auction outcomes, meaning any weak bid can trigger disproportionate moves in rates and broader risk sentiment.
Putting It Together
Taken as a whole, the picture is one of short-term resilience set against mounting medium-term strain. Global offsets, particularly from China’s liquidity injections, a calmer bond market and still-supportive credit conditions are keeping risk markets afloat for now. But these supports are cyclical and could fade quickly if U.S. funding costs accelerate or if volatility returns to rates markets.
On the other side of the ledger, the U.S. debt trajectory, the scale of interest payments, the steady grind higher in short-term funding rates, and weakening long-term foreign demand all point to structural tightening forces that will be difficult to counteract.
In our view, this balance skews toward tighter conditions over the next several months as Treasury issuance ramps and absorption channels thin, even if the near-term backdrop looks more stable than it did at the start of the year. For crypto, that means the liquidity floor that has held so far is increasingly at risk and given the sector’s high beta to dollar conditions, it is likely to feel the shift before broader risk markets do.
Crypto Feels It First: From Liquidity Drain to Stablecoin Reflexivity
This reflexiveness starts with stablecoins. They are crypto’s native dollar rails and act as both settlement infrastructure and real-time sentiment gauges. When stablecoin supply grows, it usually precedes rallies. When it contracts, crypto stalls and that pattern has held through multiple cycles.
How Past TGA Refills Hit Stablecoin Liquidity
The most recent 2023 TGA refill offers a clear case study of how Treasury cash rebuilding can drain crypto liquidity. Between June and August 2023, Treasury rebuilt its TGA by more than $550 billion through short-term issuance. Over the same period, aggregate stablecoin supply for the top five issuers contracted by $5.15 billion, a 4.15% decline.
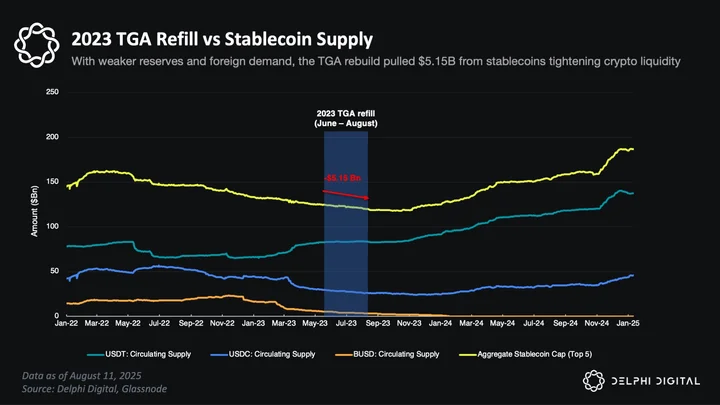
USDC and BUSD saw steady redemptions, while even Tether’s USDT which had been on a multi-month growth run flattened out. By mid-July 2023, aggregate stablecoin capitalization was down more than a quarter from its 2022 peak, despite BTC trading near local highs. Exchange liquidity thinned, volumes dropped and price momentum stalled.
The signal was clear – when Treasury pulled over half a trillion dollars into the TGA, fewer marginal dollars were left circulating on crypto rails and the sector’s price action were lackluster during the period.
That dynamic was very different from the October-December 2021 TGA cycle. At that time, markets were still awash in pandemic-era liquidity.
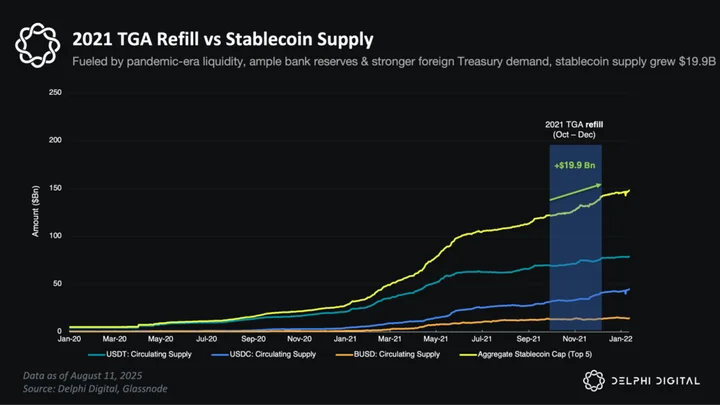
Aggregate stablecoin supply grew by $19.9 billion, or roughly 16%, even as Treasury issuance absorbed cash from the system. Abundant bank reserves, a still-fat Reverse Repo Facility and strong foreign demand for Treasuries acted as powerful buffers, allowing crypto liquidity to expand in parallel with the refill.
However, it is imperative to note that those conditions are long gone. The upcoming 2025 cycle will have far more in common with the mid-2023 refill, where tighter financial conditions and depleted buffers meant that every dollar raised by Treasury came directly from more sensitive parts of the system.
With RRP balances near multi-year lows, foreign buying diminished and bank reserve capacity constrained, the risk this time is that stablecoin supply contracts more sharply and transmits the liquidity squeeze into crypto markets faster and more forcefully than in 2023.
How TGA Refills moved Bitcoin
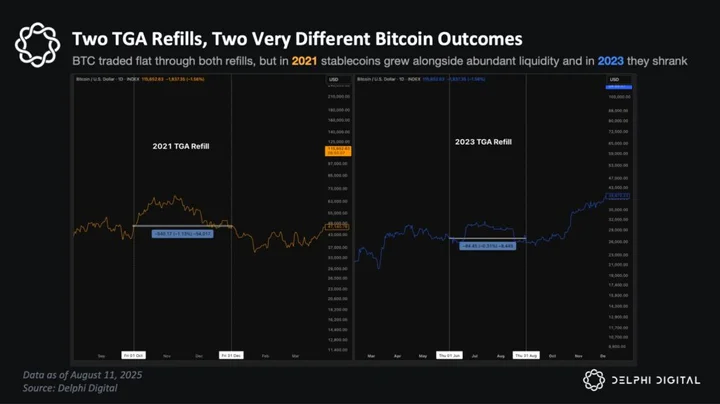
In 2021, aggregate stablecoin supply rose by $19.9 billion (+16%) during the Oct-Dec TGA rebuild. Bitcoin however finished the period essentially flat (-1.1%), implying that stablecoin growth did not translate into BTC upside. The post-COVID backdrop of QE, high bank reserves, and strong foreign Treasury demand meant the TGA drain barely touched crypto rails, allowing stablecoins to expand independently of BTC.
By 2023, those cushions were gone. Stablecoin supply fell by $5.15 billion (–4.15%) during the refill, but BTC ended the period almost unchanged (–0.31%). This implied sensitivity of roughly 0.07% BTC move for every 1% change in stablecoins was a fraction of 2021’s relationship. In that environment, the TGA drain translated into a stagnation in crypto prices rather than an acute selloff.
The takeaway is that crypto’s liquidity elasticity is not constant. It shifts with the macro regime and market state. In 2021, abundant buffers allowed stablecoin supply to expand even as BTC stayed flat, showing how Treasury issuance was absorbed without touching crypto rails. In 2023, with those buffers gone, stablecoin supply contracted while BTC again finished flat, highlighting how weaker liquidity dampened transmission into prices. Entering 2025 with even tighter starting points, the risk is that a new round of stablecoin contraction could translate more directly into BTC downside compared to the muted impact of 2023.
How TGA Refills moved Ethereum: Higher Beta Cuts Both Ways
Ethereum’s performance across the 2021 and 2023 TGA refill windows underscores how moving down the crypto risk curve increases sensitivity to liquidity shocks.
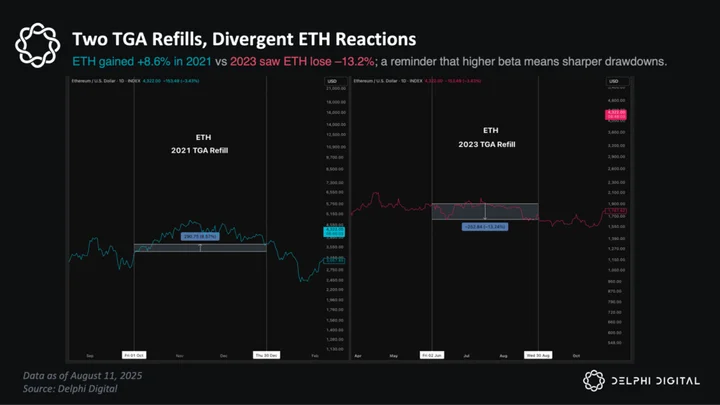
In 2021, during the same June-August period when aggregate stablecoin supply rose $19.9 billion (+16%), ETH gained +8.6%, while BTC finished essentially flat (-1.1%). Abundant post-COVID liquidity meant that the TGA drain barely constrained speculative flows, allowing ETH to outperform BTC on the upside despite a more muted overall backdrop.
However in 2023 during the refill, BTC finished the period essentially flat (–0.3%) but ETH fell –13%. This implies ETH’s downside beta to stablecoin contraction was materially higher than BTC’s in that cycle. The weaker liquidity backdrop meant marginal dollar drains hit the more speculative parts of the market disproportionately hard.
The implication for 2025 is more nuanced. The rise of spot ETH ETFs and growing institutional flows will change the composition of liquidity entering the asset, meaning the market impact of a TGA-driven dollar drain will not mirror 2023 exactly.
However, the broader principle remains intact: higher-beta assets tend to amplify drawdowns when liquidity tightens. If stablecoin supply contracts during the upcoming refill, ETH and other risk-curve assets could still see disproportionately larger declines relative to BTC, especially if an altcoin does not have the same BTC or ETH structural ETF / Treasury Co’s inflows to soften the blow. In a thin-liquidity regime, position sizing and capital rotation across the risk curve will matter more than ever.
Stablecoins Are Now Treasury Buyers
This cycle however introduces a potential structural twist. With new regulated stablecoins and tokenized money market funds on the horizon, stablecoins may not just reflect liquidity conditions but they could also actively absorb and redirect liquidity back into markets.
In other words, stablecoins might become part of the solution to a TGA-driven drain, rather than just collateral damage.
Traditionally, stablecoin issuers kept a large portion of reserves in cash and bank deposits. But by 2023-2024, that model shifted decisively toward short-term U.S. Treasuries. Tether and Circle, the two largest issuers, now allocate the bulk of their backing assets into Treasury bills, reverse repos, and money market funds that hold only government debt.
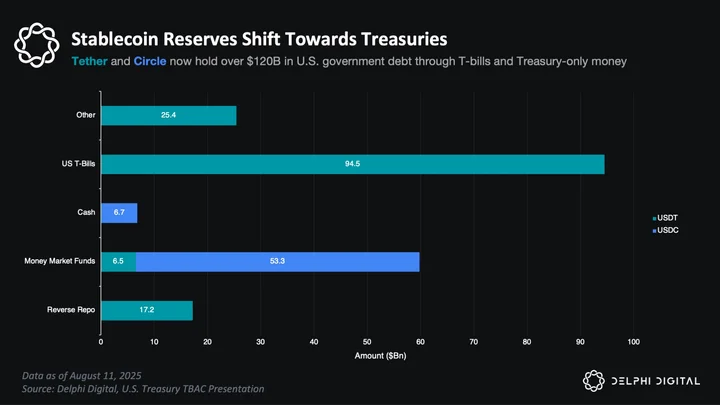
As of early 2025, Tether reports holding over $94 billion in T-bills (~66% of its reserve base), and Circle holds over $53 billion in Treasury-only money market funds. Industry-wide, it’s estimated that more than 80% of all stablecoin reserves are now invested in U.S. government debt. These figures imply over $120 billion in Treasury exposure across stablecoins, a total larger than the sovereign holdings of most countries.
Tether’s holdings of U.S. government debt now stand near $120 billion, a portfolio larger than that of many sovereign reserve managers. Meanwhile, Circle holds roughly 80-85% of USDC’s reserves in a BlackRock-managed fund composed entirely of short-duration T-bills and repos. Together, stablecoin issuers have become a major and growing source of demand for new Treasury issuance.
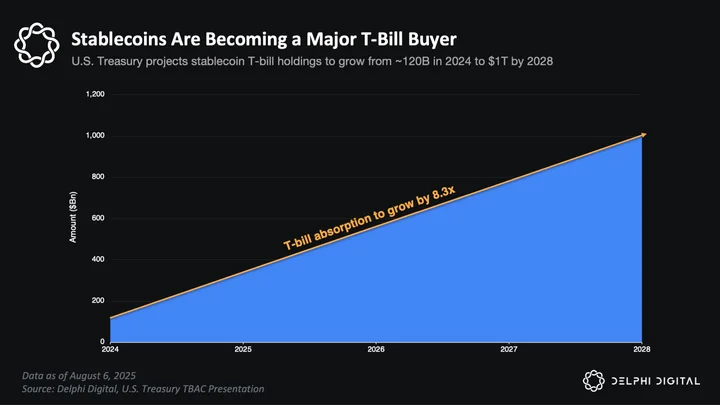
That demand is set to expand rapidly. U.S. Treasury projections show stablecoin T-bill holdings rising from about $120 billion in 2024 to $1 trillion by 2028, an 8.3x increase over 4 years. In a full-scale adoption scenario, Treasury demand from issuers could rise by $900 billion, creating a feedback loop between digital dollar growth and fiscal funding capacity.
This shift also carries broader market implications. As stablecoins gain share as a preferred cash rail, capital may migrate out of traditional bank deposits and into tokenized money backed directly by U.S. debt.
The Rise of Regulated Yield-Bearing Stablecoins
With regulated stablecoin structures like World Liberty Financial’s USD1 now live, a new form of market interaction is beginning to take shape. USD1 launched in early 2025 as an “institutional-grade” token backed by short-term U.S. government bonds and cash equivalents.

In just a few months, its circulating supply surpassed $2 billion, reflecting early traction from yield-seeking investors. By design, every token issued is tied to a T-bill purchase – effectively transforming on-chain demand into incremental demand for Treasuries.
This introduces a subtle shift where stablecoin issuance could in theory help absorb Treasury supply during periods of net issuance, re-routing liquidity through crypto platforms rather than draining it entirely from the space.
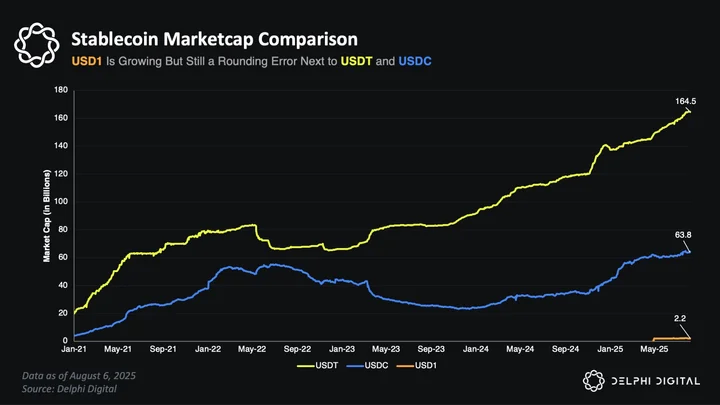
But the scale remains modest. USD1’s ~$2B footprint is notable, but still tiny next to incumbents like USDT and USDC.
It’s too early to say whether this model can meaningfully offset a liquidity drain of the size we’re seeing in the 2025 TGA rebuild. And importantly, the composition of reserves still matters. If backing skews heavily toward bank deposits or traditional money market funds, the liquidity still exits the crypto ecosystem. The same structural limitations apply, just via a slightly different wrapper.
A rising aggregate stablecoin supply, especially if driven by inflows into products like USD1 or tokenized T-bill funds, might paradoxically signal that some of the TGA-driven liquidity drain is being re-routed back into crypto. That would mark a bullish divergence from past cycles and suggest the crypto ecosystem is evolving into a two-way bridge with traditional finance.
Conversely, if stablecoin supply stagnates or declines as the TGA climbs as it did in 2023, that would indicate the liquidity sponge is drying out again with fewer dollars circulating through on-chain rails. Either way, stablecoins have become critical macro signals.
Timeline Overview of TGA refill
As mentioned above, the 2025 TGA rebuild is very likely to begin within the next couple of weeks. Liquidity drains of this magnitude rarely hit in a straight line but rather they tend to unfold in phases, each with its own market tone and positioning bias.
The outline below is a speculative scenario based on historical patterns and current liquidity signals. It should not be taken as a definitive forecast, but rather as a potential roadmap for how market conditions could evolve during the refill window.
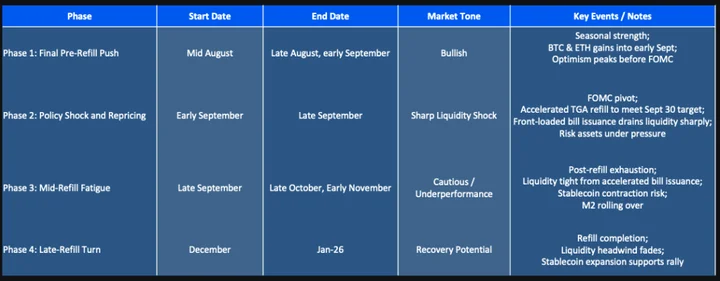
Phase 1: Final Pre-Refill Push (Early August through Late August)
Seasonal patterns and residual liquidity could keep risk assets firm into end-August. BTC and ETH could potentially have room to extend gains into early September, peaking ahead of the September FOMC meeting. This is often the point where optimism runs highest before policy reality sets in.
Phase 2: Policy Shock and Repricing (Early September through Late September)
The September 16-17 FOMC could mark a pivot, with an accelerated TGA refill front-loading issuance to meet the Sept 30 target. Depending on the rate of the TGA refill going into September, up to $500B could be raised in just a few weeks, creating a sharp liquidity shock as bill issuance drains cash from markets. Risk assets may come under immediate pressure.
Phase 3: Mid-Refill Fatigue (Late September through Early November)
Following the initial shock, markets may enter a drawn-out fatigue phase. Liquidity remains tight from accelerated issuance, stablecoin supply could contract, and broader money supply (M2) may roll over. Crypto as the highest-beta risk asset is likely to underperform in this stretch.
Phase 4: Late-Refill Turn (December into January 2026)
The liquidity headwind from heavy bill issuance begins to fade as the TGA target is met and issuance slows. The Treasury is likely to maintain a high cash balance for some time, so any TGA drawdown would be gradual rather than immediate. If macro conditions remain stable and stablecoin supply is expanding, markets could see a window for a renewed rally into early 2026.
One of the clearest of those macro indicators is the relationship between BTC and global M2 money supply, which provides an early read on shifts in liquidity conditions.
BTC vs M2: A Leading Liquidity Signal
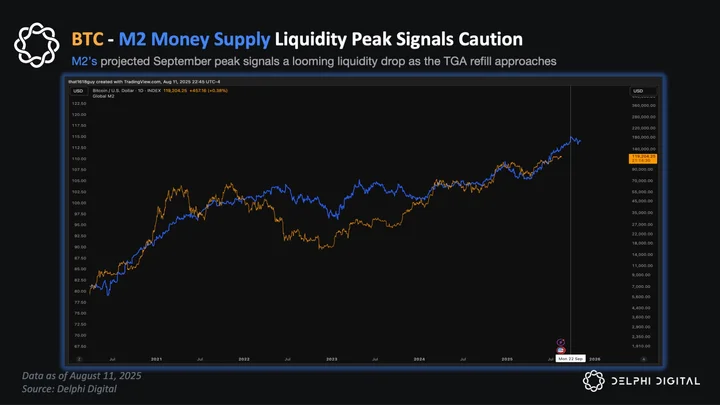
The BTC-M2 relationship offers a useful overlay to this timeline. Using a 10-week offset, the latest M2 data suggests a liquidity peak forming in September. In the past, such peaks have preceded multi-week slowdowns in BTC performance, especially when paired with policy tightening or large Treasury issuance.
On this chart, M2 (blue) has already rolled over from its recent highs, down roughly 8% from the projected September peak. This hints that liquidity conditions are set to weaken into the fall, a likely reflection of the upcoming TGA refill. Historically, when M2 rolls over, BTC tends to follow with a lag, reinforcing the case for caution as we head into the refill window.
The Combined Read
Together, these phases outline how the TGA refill could act as a rolling headwind rather than a single shock. The market impact will depend not only on the size and pace of Treasury issuance, but also on how liquidity channels respond in real time. Stablecoin supply, funding market stress, and macro liquidity measures will be the key signals to watch as each phase plays out.
Closing Summary
A Temporary Liquidity Headwind That Deserves Respect
The 2025 TGA refill is set to be a net negative for system-wide liquidity. Treasury will soon begin pulling cash out of markets to rebuild its account at the Fed, a process likely to start within the next couple of weeks and run for two months. With traditional buffers like the RRP largely depleted and bank balance sheets still constrained, every dollar raised will come directly from active market liquidity.
For risk assets, that means a cap on enthusiasm through late summer and early fall.
The backdrop is not one for chasing aggressive upside even if headlines turn positive. Caution makes sense, but this is not a call for outright bearish positioning. The refill is a defined, temporary event rather than an open-ended liquidity drain and the eventual completion will change the tone.
Crypto’s growing role as a liquidity participant also adds a new wrinkle.
If stablecoin supply expands while the TGA climbs, it could help absorb part of the issuance load and soften the blow to digital assets. If supply stagnates or contracts, the drain will likely be felt faster and more sharply in crypto than in other risk markets. The key is to monitor the stablecoin trend alongside Treasury balances. Rising stablecoins during the refill would mark a structural shift in how liquidity cycles work, signaling that crypto is evolving from a passenger to a participant.
Once the TGA rebuild winds down, likely in the back half of Q4, the liquidity picture should begin to improve and that could very well be where the next big opportunity lies.
0 Comments