Deleveraging, Volatility, & Mixed Market Signals
NOV 18, 2021 • 17 Min Read


Deleveraging Wave Sparks Downside Volatility
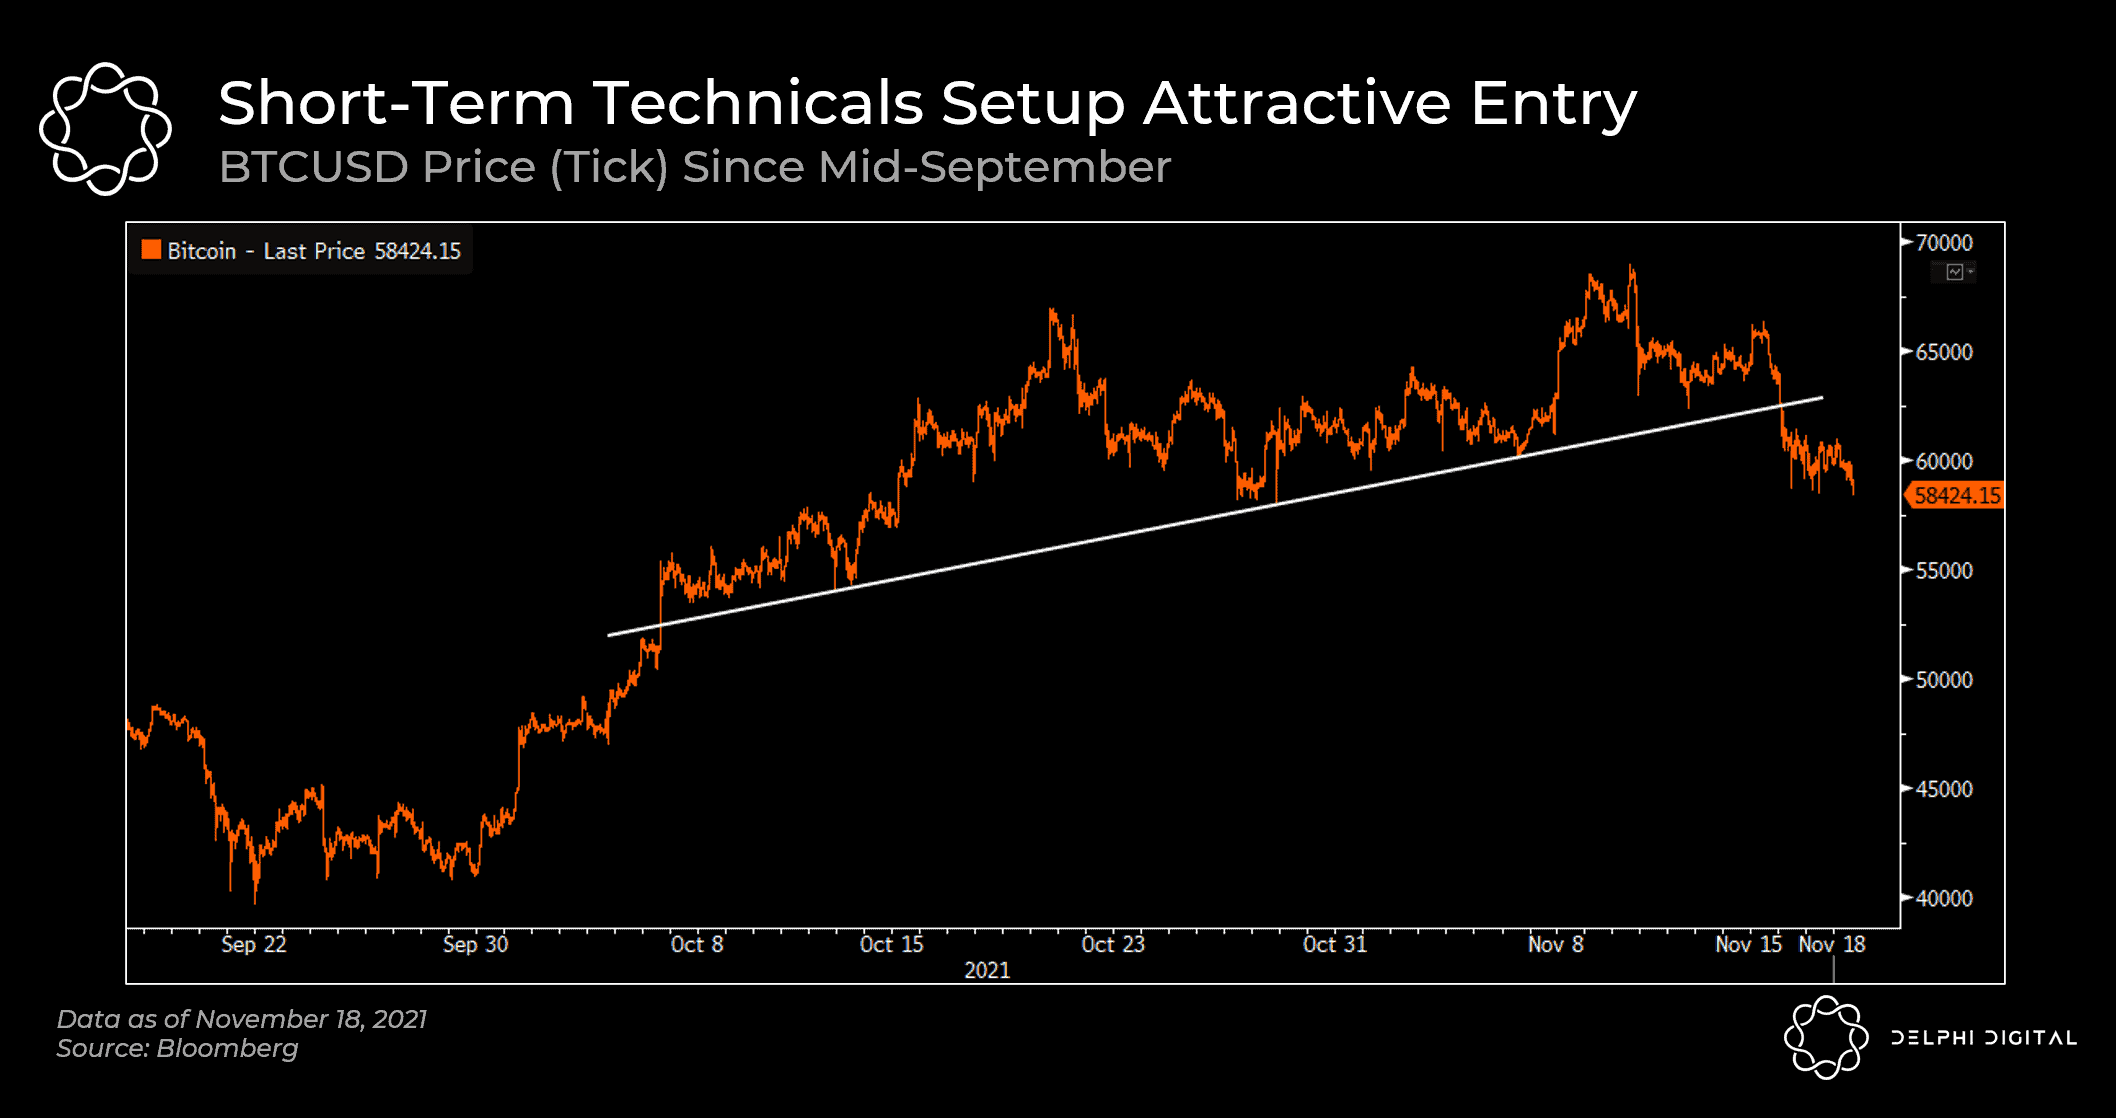
After a swift run up to new highs, BTC has stumbled in recent days and is now trading well below $60k. Short-term technicals don’t paint the prettiest picture, but the initial sell off was largely driven by a wave of liquidations rather than a fundamental shift in narrative, so the recent dip presents an attractive entry point in our view.
While the past week has seen significant deleveraging, it’s difficult to quantify the exact extent to which over-leveraged positions were wiped out. Binance, the largest spot and derivatives exchange by virtually every metric, significantly under-reports liquidation data as Binance’s API now only publishes one liquidation per second (during volatility spikes, there realistically can be upwards of hundreds or thousands of liquidations per second). Nonetheless, we have seen an increase in aggregate liquidations across major exchanges coinciding with each sizable price dip.
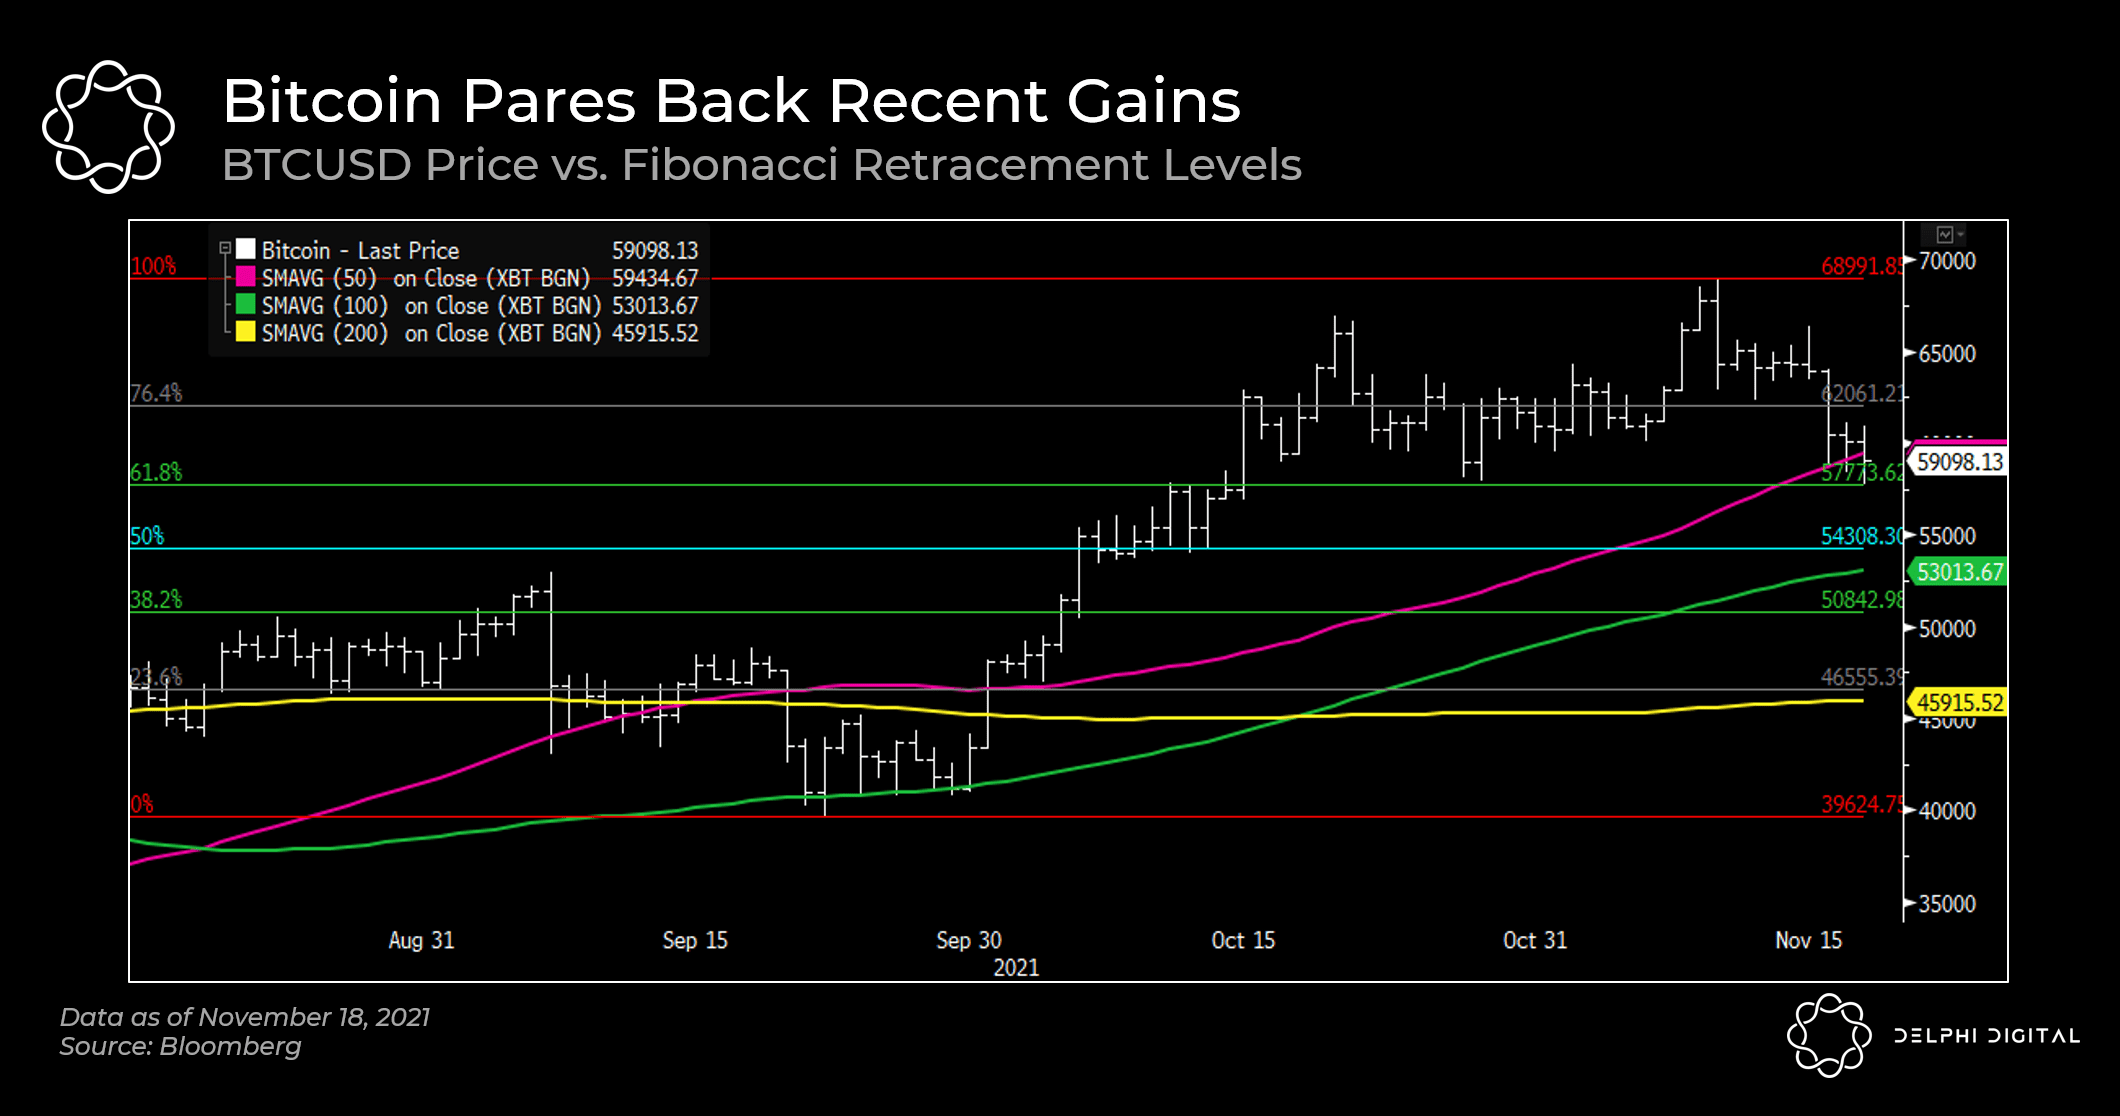
After paring back some of its recent gains, BTC is currently hovering around its 61.8 Fib retracement level dating back to mid-August before its September lull. If continued selling pressure forces BTC below ~$57,750 we could see it dip below $55k rather quickly. However, given increased institutional demand and general sentiment among BTC holders, we believe any drawdown will be relatively short-lived. Therefore, if BTC takes another leg lower it could set up an even more attractive entry for those with long-term conviction looking to accumulate.
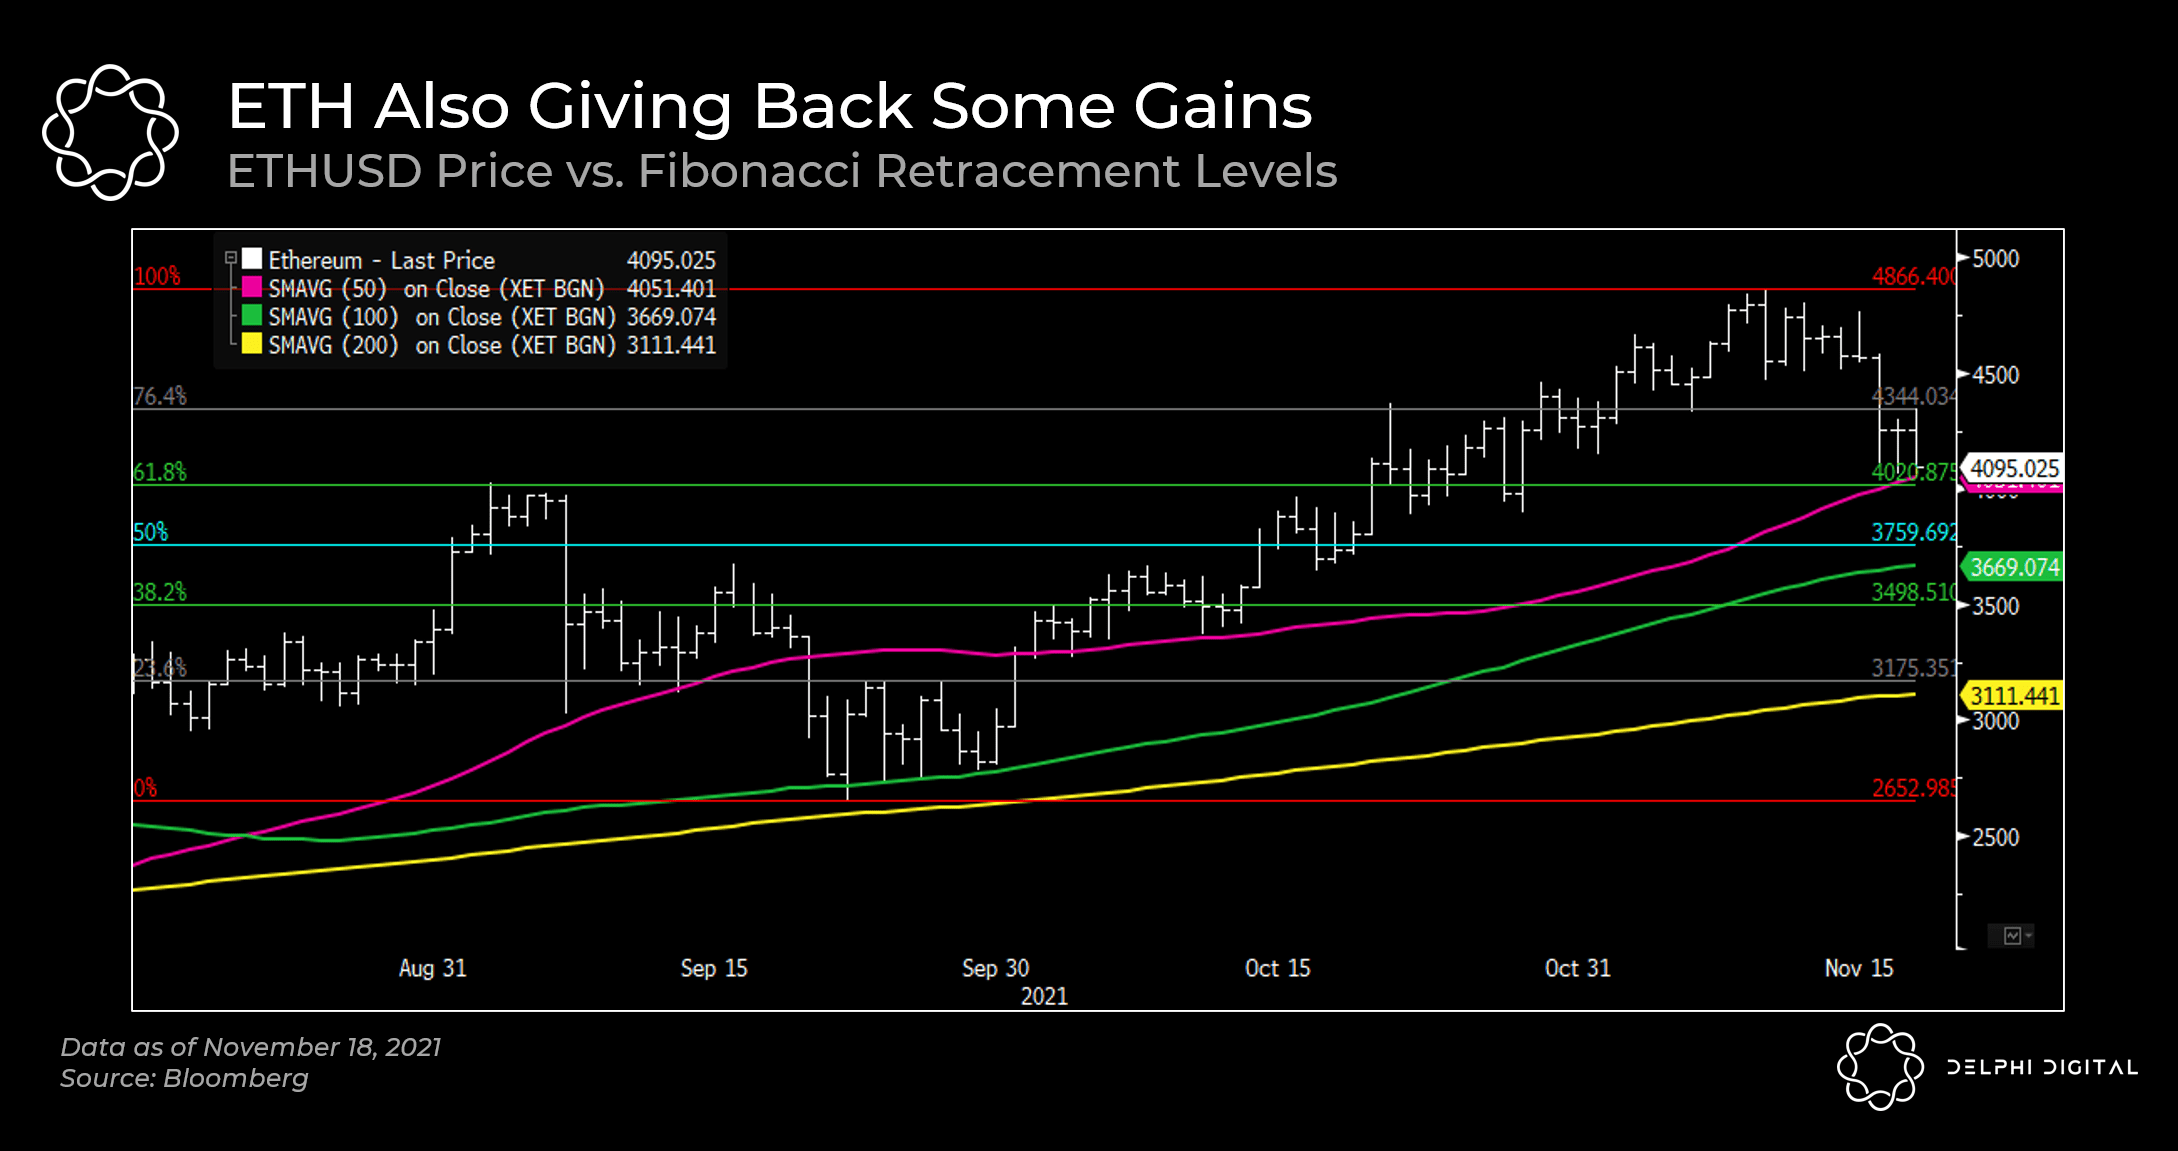
ETH is also trading at key support levels; we take a similar view as it relates to any short-term price weakness, especially given its plethora of tailwinds heading into year-end and beyond.

BTC’s weekly chart looks to be establishing an S/R flip. Or simply put, it’s turning a key level of resistance into support. If it holds, continuation of the bull market is all but confirmed. Spot volume delta, shown under the price chart, hasn’t budged much either, though it has been fairly stagnant since the rampant buying in Q4 2020 and Q1 2021; with the market starting to look shaky on lower time frames, we feel this is some much needed perspective.
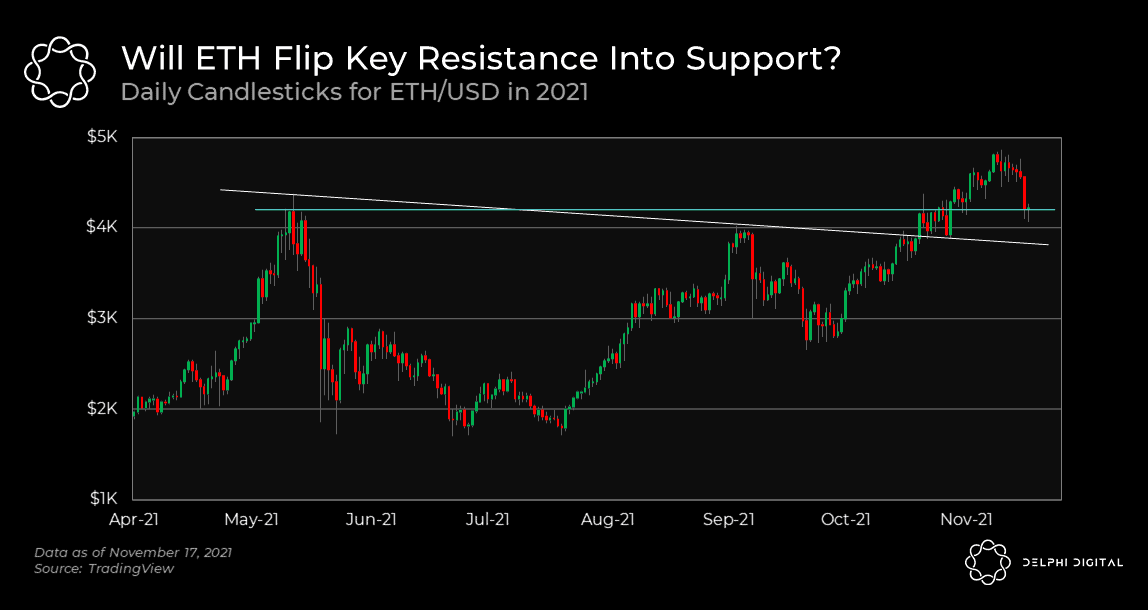
ETH is also attempting a similar flip; if price holds above the May 2021 closing peak, ETH will also look primed for trend continuation to the upside. If price support gives way, the hope for bulls would shift to a possible retest and bounce off the upper trend line established from the May 2021 top to the Sep. 2021 high.

With the last few days of despondent price action, funding for perpetual futures have taken a beating, with rates even turning negative on a couple major exchanges. High funding implies more leverage and bullish sentiment, which is why it’s often symptomatic of an overheated market. Therefore, deleveraging events that wipe out open interest are an unfortunate but crucial part of a sane market.
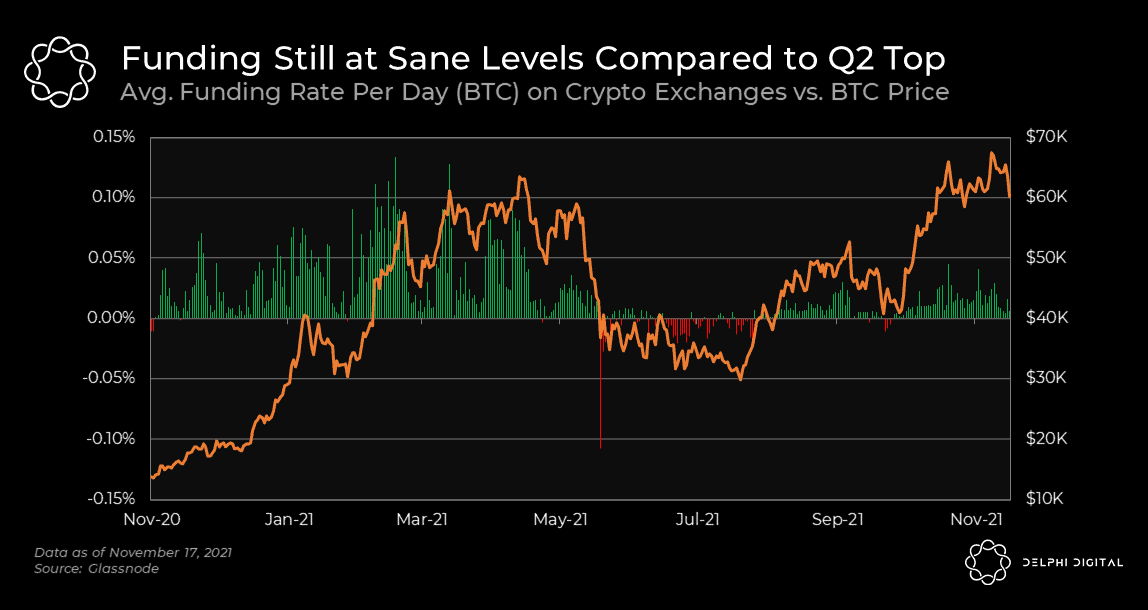
Zooming out, average funding rates moved co
Read the full report
This report is part of Delphi Pro.
- 800+ Pro reports across every major sector
- Talk directly with our analysts
- Private community of funds and builders
Already a Pro member? Log in
0 Comments