🌅 Welcome!
Justin Sun is reportedly involved in the purchase of another crypto exchange, and the rush to mint a new token briefly turns ETH deflationary. Is the promised land finally here?
Today, we take a look at a volatility-based indicator for BTC price and our Research team analyzes the current state of traditional markets.
This is the Delphi Daily. Let’s dive in.
🚨 In Case You Missed It
- ETH supply turns deflationary as users spend more than $1.8m in gas fees to mint XEN tokens.
- Huobi founder, Leon Li sells his entire stake to About Capital, an investment firm reportedly spearheaded by Justin Sun.
- The LFG Foundation backtracks on a previously announced plan to repay small holders of UST tokens due to legal concerns.
- The OECD releases a new global tax reporting framework for crypto assets, covering intermediaries like exchanges, brokers, and ATM operators.
📊 Is a Big Move Brewing for BTC?
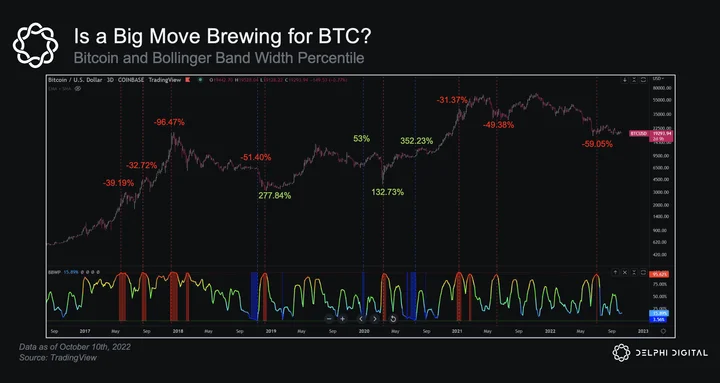
- Currently, the Bollinger Band Width Percentile (BBWP) indicator for BTC is at 15.87. Historically, BBWP readings above 90 or below 5 have marked major swing points. Although the indicator hasn’t dipped under 5 yet, similar readings have previously led to an upside of 70% or a downside of -59%.
- The BBWP is a second-order derivative of the Bollinger Bands, which are made up of three lines. The middle line is the 20-day simple moving average, and the upper and lower lines are two standard deviations from the middle line.
- The first-order derivative, Bollinger Bands Width measures the gap between the upper and lower bands. The second-order derivative, the BBWP compares the gap to its previous readings.
- Since Bollinger Bands are a volatility-based indicator, the BBWP helps us quantify the extent of current volatility compared with historical readings. When the indicator is above 95, it suggests the price move is quite extended and the asset may likely enter a period of sideways drift or full-fledged correction. On the other hand, when the indicator is below 5, it suggests that volatility has severely contracted and a big move is likely.
- On the chart above, the vertical lines mark the indicator’s high and low values. The percentage move from those extreme values gives us a sense of what to expect. Since Q2 2017, BBWP readings above 90 or below 5 have previously led to an upside of 204% or a downside of -51% on average.
- The BBWP is not perfect and other indicators must be used in tandem to conduct a meaningful analysis. However, it helps us understand how extended the current price move may be, and gives us an early indication of potential future moves.
⚡ Crypto’s Make or Break Moment
- Crypto markets have been attached at the hip to traditional risk assets for the better part of the last 12 months. For better or for worse, everything has been distilled down into one big macro trade.
- Equities appear to be on the verge of another major test, and so far, there has not been enough evidence of any real decoupling between crypto assets and traditional assets, which we wrote about recently.
- In order for us to have any strong conviction in the idea of a break in the crypto <> macro relationship, we would need to see more sustained evidence of divergences in markets, and that simply hasn’t materialized yet.
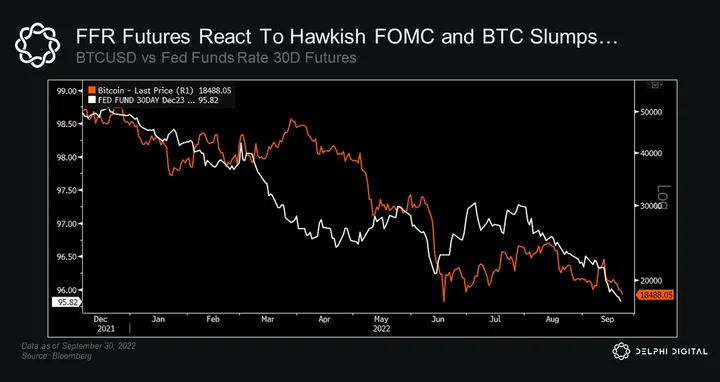
- For example, the FOMC’s decision to hike rates another 75bps at the last FOMC meeting was largely expected. What was not expected was the Fed’s projected terminal rate.
- The updated Dot Plot implied a 4.6% Fed funds rate by December 2023, with Powell reiterating the Fed’s hawkish stance. This initially had a material impact on Fed funds rate expectations further out the curve (i.e. Q2-Q4 2023). Fed funds futures reacted, and so did BTC.
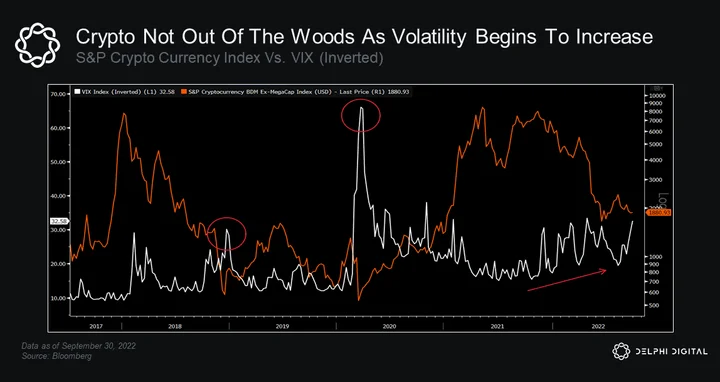
- The real stress test is how crypto will hold up if we do get another spike in volatility and selloff in equities. The question now is whether this is the start of a decoupling trend or if crypto will fall back in line with traditional risk assets.
- This is the crux of the thesis and whether or not it remains valid in our view. Historically, the crypto market has failed to buck the macro trends during tough conditions, and implied volatility is starting to tick up.
- For more on the current state of traditional markets, Delphi members can read our Delphi Pro report here.
🐣 Notable Tweets
How to Identify and Analyze Crypto and Stock Trends
This is how to analyze #altcoins and #stocks charts from A-Z identifying trend, accumulation, distribution and more to find x2-x50 winners such as $MATIC, $APTS, $SOL, $ADA, $XRP
and most importantly creating a trading plan for each asset
Let’s jump right in 👇🏽
— Mac 🐺 (@MacnBTC) Oct 10, 2022
Useful Tools for NFT Analysis
The Ultimate NFT Tools Thread
Wonder how people make 6 figs a month trading NFTs?
Here is a list of tools that give you an advantage
Dive in 👇🧵
— Corleone (@corleonescrypto) Oct 10, 2022
0 Comments