April Showers… May Flowers? - Macro & Markets May 2025
JUN 10, 2025 • 25 Min Read
Welcome to Market Musings, designed to keep our readers informed about the most important and timely developments in the crypto market.
Macro Thematics
As May draws to a close and we navigate into the back half of 2025, the global macro environment continues to be characterized by one word: uncertainty.
The Trump tariff policies have triggered a series of trade actions and retaliations, reshaping global trade dynamics and significantly impacting financial markets, including bitcoin and crypto markets more broadly. Add in rising bond yields, persistent inflation expectations, the Fed’s steadfast policy stance, and fiscal sustainability concerns (capped off with Moody’s recent downgrade of U.S. creditworthiness), and all of this coalesces into an increasingly complex backdrop for market participants.
Trump’s Tariff Tizzy
The tariff saga officially began on February 13th with President Trump’s Presidential Memorandum announcement of a reciprocal tariff policy to address trade deficits — but fears really spiked after “Liberation Day” on April 2nd as the risk of a global trade war turned palpable.
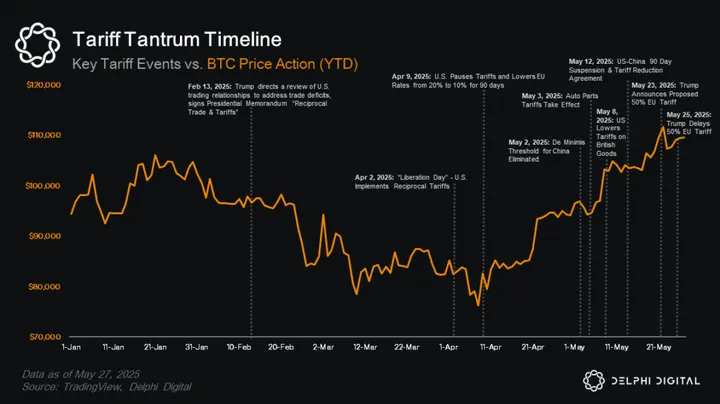
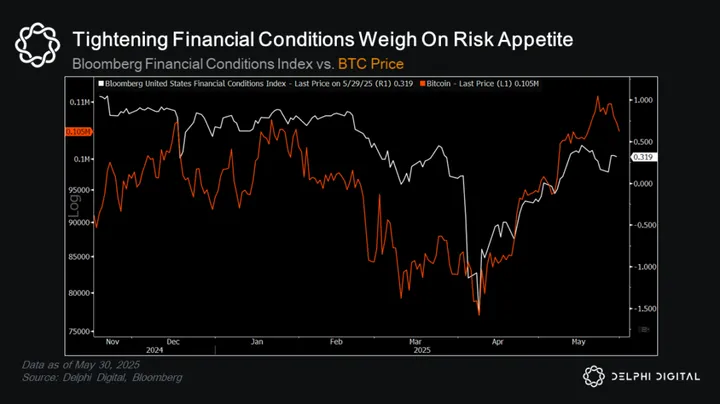
Volatility spiked, financial conditions tightened, and risk appetite dried up — sending risk assets and liquidity proxies like BTC to new YTD lows.
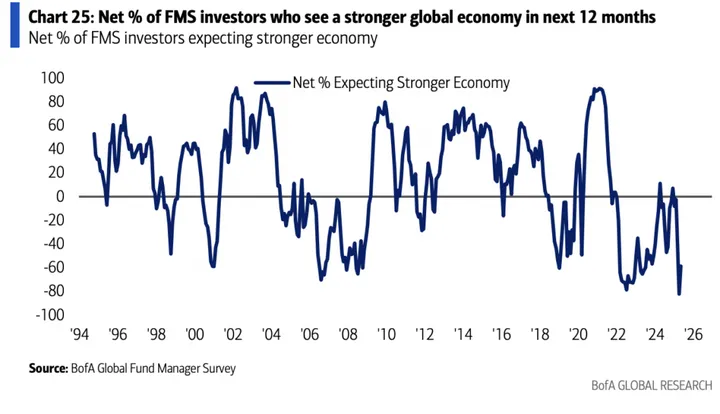
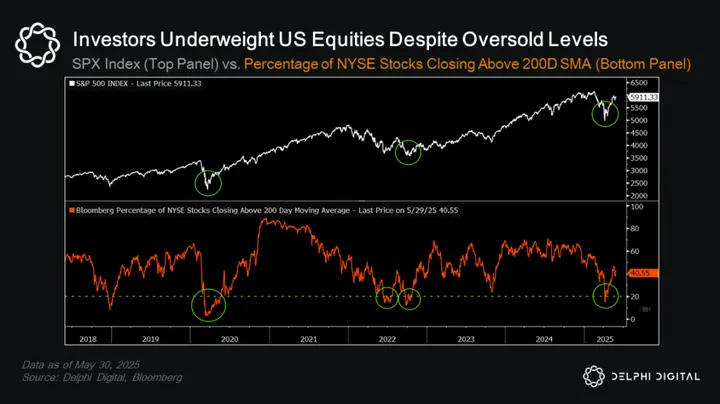
As we’ve noted in prior reports, one of the biggest headwinds for markets entering the year was nearly everyone seemed to be bullish risk assets. Overly aggressive US tariff policies were the match that lit the liquidation flame, catching many investors offsides positioning wise, which only exacerbated the selloff in risk markets. Sentiment turned on a dime, and by mid-April the market was in peak fear mode as investor bearishness surged.
We highlighted this extreme turn at the time — “Are Investors Too Bearish” — and how quickly consensus had turned to overtly bearish on global growth, risk, and US assets specifically (BTC is up 25% since).
Subsequent trade developments have helped ease tensions since. The most significant breakthrough being the U.S.-China agreement to suspend and reduce tariffs for 90 days on May 12th (lowering U.S. tariffs to 30% and Chinese retaliatory tariffs to 10% formalized on May 14).
Just last week, the Trump Tariff policy has come under fire as a US federal trade court deemed the “Liberation Day” tariffs as illegal.
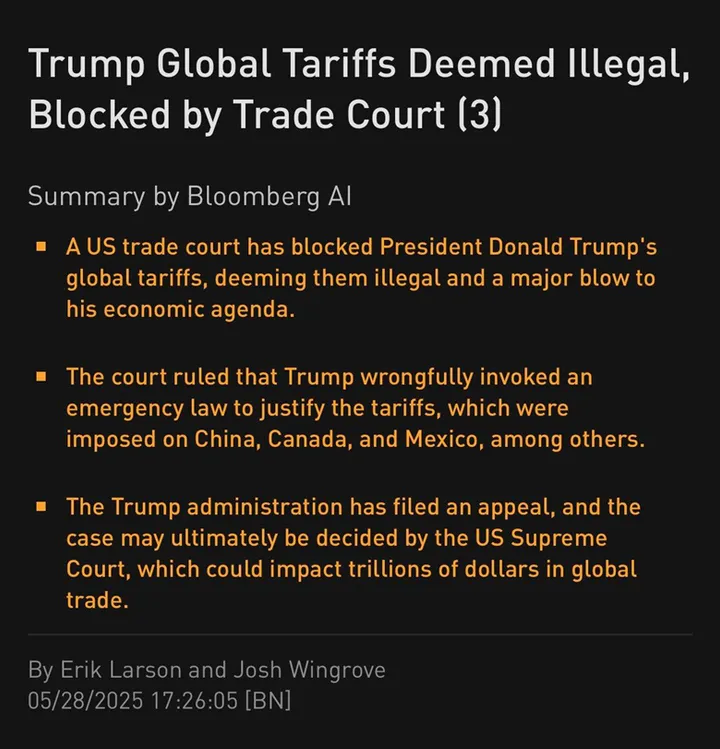
Source: Bloomberg
As expected, the subsequent scaling back of tariff policy and de-escalation has spurred a market rally — both equity and crypto markets have retraced the entirety of the April Tariff Tantrum sell off.
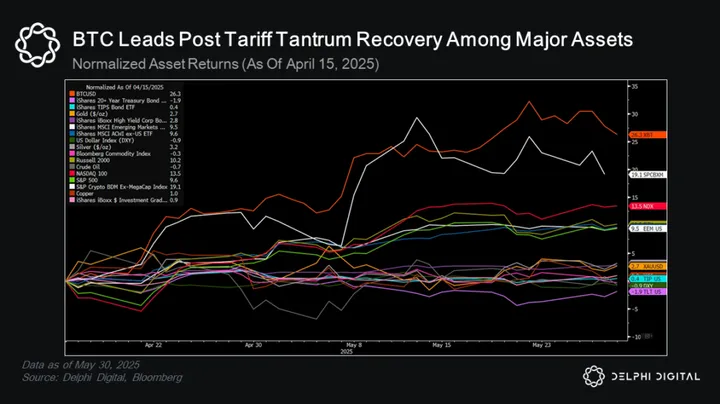
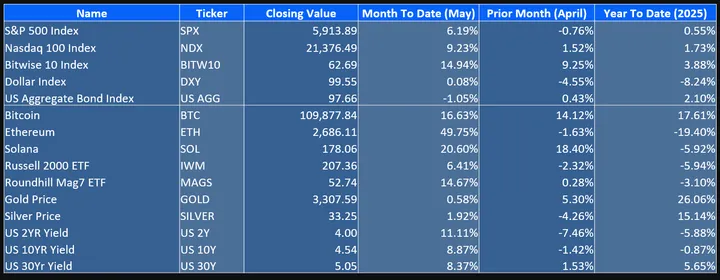
Table: Major Indices & Asset Performances
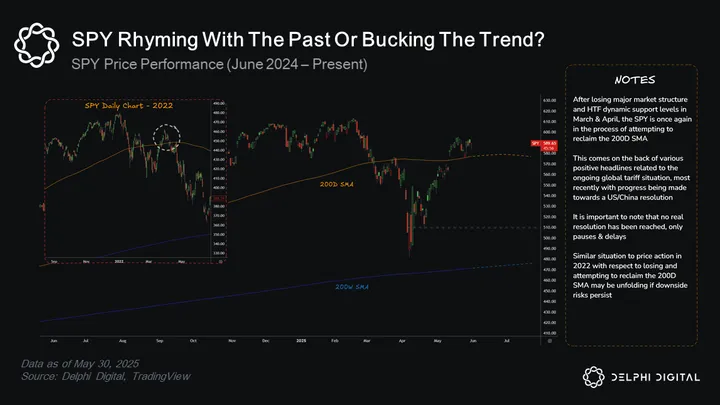
Plenty of uncertainty still lingers though as long term resolutions have not yet been reached, and markets seem to be in a holding pattern as the tariff delays play out. Global markets are not out of the woods and any walk back of the de-escalation talks could weigh heavily on risk assets, which appear to be priced as if the global trade situation has been resolved rather than paused & delayed.
These tariff policies are likely have a more profound and lasting impact on geopolitics and financial markets. At a high level, the global perception of U.S. trade policy has shifted, putting many countries on high alert.
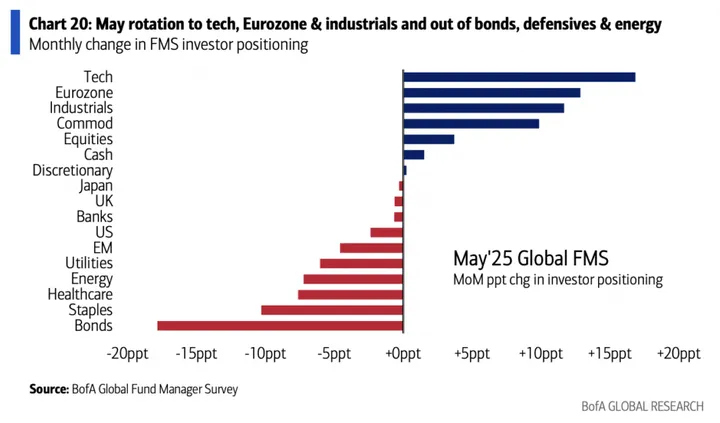
This has prompted a strategic pivot toward self-sufficiency, influencing global economic policies and investor sentiment, as well as capital flows (e.g. increased allocation towards Eurozone assets).
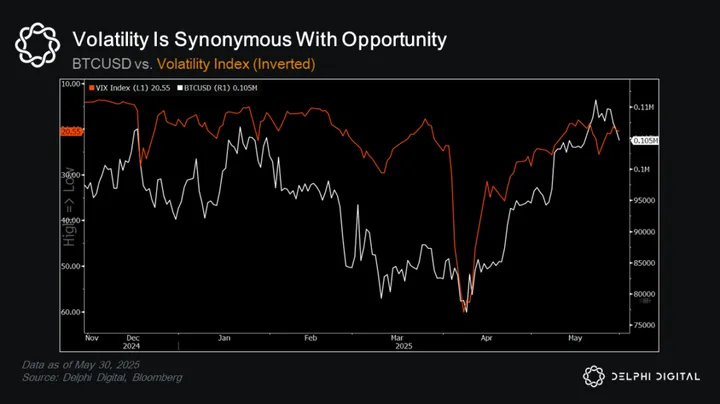
Big volatility spikes — like the one we experienced in mid-April — often reveal themselves as short-term pain, longer-term gain situations.
When consensus gets too far to one extreme, ripe opportunities can rise to the surface.
Global Fiscal Sustainability & Spiking Bond Yields
The tariff situation has catalyzed a global shift toward self-sufficiency, with countries prioritizing domestic growth and critical industries over reliance on U.S. support.
This is a pivotal shift as we expect it will result in increased fiscal spending as nations bolster national security and economic resilience, while providing additional support for critical domestic industries.
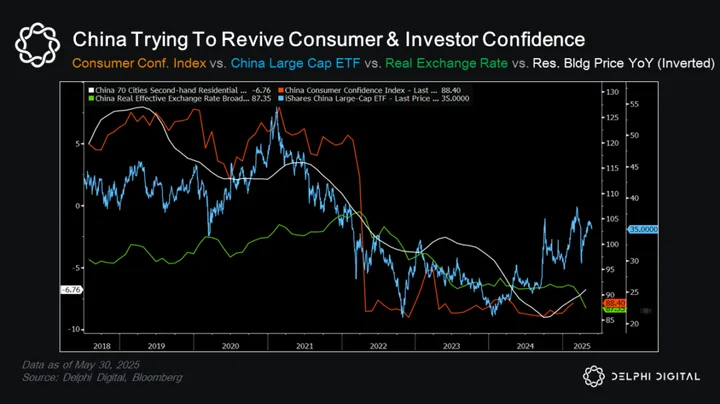
We’re already starting to see this take shape. European countries are increasing defense budgets, while China continues its fight to shore up domestic economic stability to revive consumer and investor confidence.
The focus on bolstering domestic industries and priorities over fiscal austerity will likely lead to increased deficit spending.
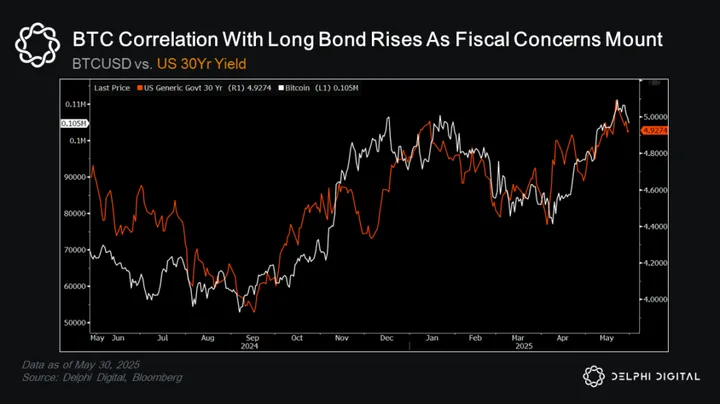
This shift comes at the cost of fiscal discipline, at a time when many major economies already run sizable deficits (this isn’t just a US-centric issue). This trend is already putting strain onto global bond markets.
Interesting to note how BTC has essentially tracked the UST 30yr yield the last few months.
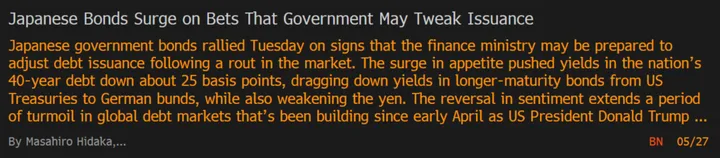
Japan is another focal point, with concerns about the sustainability of its government debt evidenced by rapidly rising JGB yields. Weak bond auctions and growing stress in the market for longer duration bonds is starting to force policymakers’ hands as supply-demand mismatches bubble up.
Source: Bloomberg
Moody’s recent downgrade of its US credit rating further supports this tension, given the agency’s rationale of rising debt and interest costs with no real projected end in sight. The IMF’s downward revision of 2025 global growth underscores these concerns as trade tensions exacerbate these economic vulnerabilities.
Falling bond prices means more losses for bond holders and more value destruction for the world’s most widely used liquid collateral assets.
If demand for sovereign debt wanes — as debt supply continues to expand — liquidity issues will almost certainly arise as bond markets begin to revolt.

Further evidence can be found in the outlook for DOGE spending cuts and the “big beautiful bill”.
There’s a big difference between the theoretical impact of DOGE and what it can realistically achieve. DOGE can’t touch mandatory spending (military, social security, healthcare, etc.), which makes up the vast majority of government expenditures. Additionally, the House GOP has failed to codify many of the recent DOGE spending cuts, signaling more of the same with respect to runaway spending habits.

Trump’s “big beautiful bill” also fails to address these fiscal sustainability concerns, with many forecasting the opposite effect with respect to future deficit spending.
It’s hard to see what stops this train.
Concluding Thoughts
The 2025 tariff situation has been the primary macroeconomic theme year-to-date and the driving force behind volatility in traditional and crypto markets, which is prompting a strategic shift toward self-sufficiency, raising the likelihood of increased fiscal (deficit) spending across major economies.
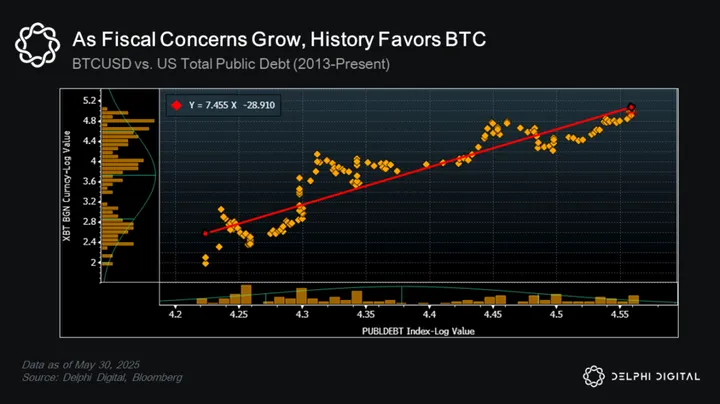
At this point, it looks as though we are well on our way towards the big picture and end-game that we have been writing about for years – the debt-based economy is rapidly approaching the point in time in which additional liquidity will be needed to support global markets.
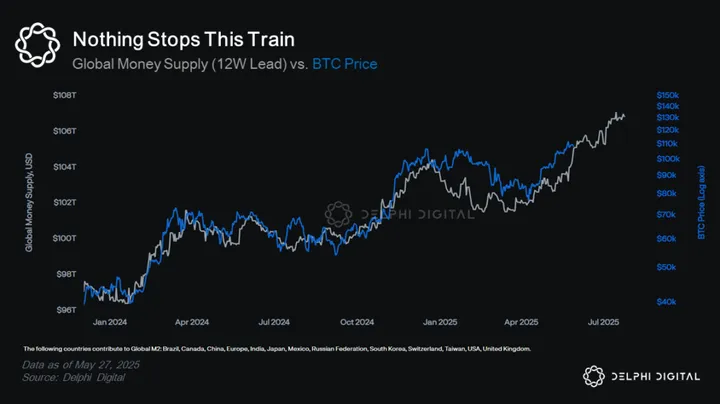
Our underlying thesis of continued currency debasement remains firmly intact despite short-term fluctuations, favoring hard scarce assets that perform well in these types of environments. Again, despite all the political jawboning, it’s hard to see what stops this train.
Unexpected bouts of market volatility, driven by rising sovereign bond yields or rapid deteriorations in the outlook for risk assets sparked by exogenous events (e.g. trade or physical warfare escalations), still remains a near-term risk for global markets.
Tactical View: Short Term Momentum Slowing, Longer Term Outlook Remains Constructive
As we close out May, the tactical backdrop across both macro and crypto markets reflects a transition from recovery to recalibration.
The April tariff shock has been fully retraced across risk assets, and sentiment indicators, while elevated, have not yet reached levels consistent with cycle tops. The challenge now lies in balancing the near-term outlook with the long-term vision.
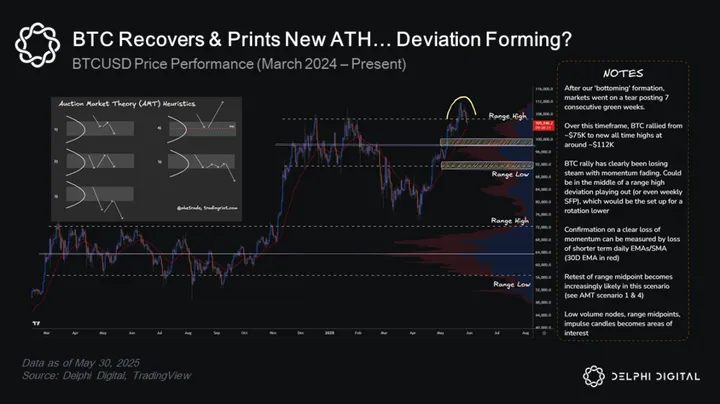
Crypto market price action has been supported by a decisive return of institutional flows. Bitcoin ETFs absorbed more than $3 billion in net inflows during May, driving BTC back above $109,000.
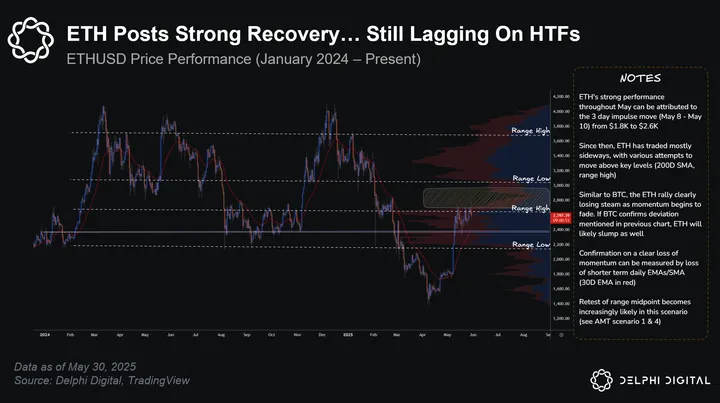
Ethereum has also staged an impressive recovery, outperforming many large cap crypto assets during the past month.
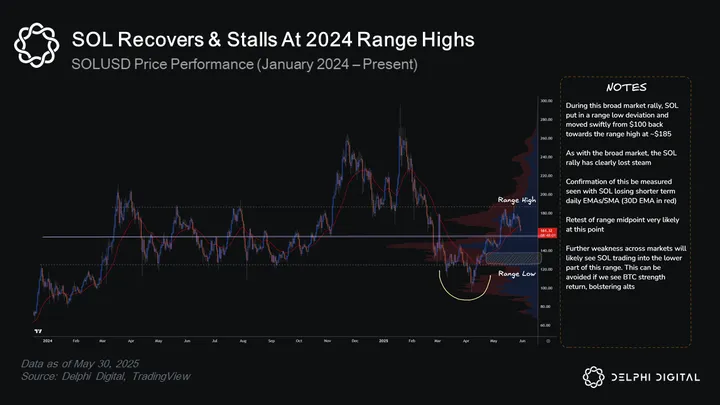
Solana has also put in a solid move off of the local lows printed in early April, but is running out of steam at higher timeframe supply zones.
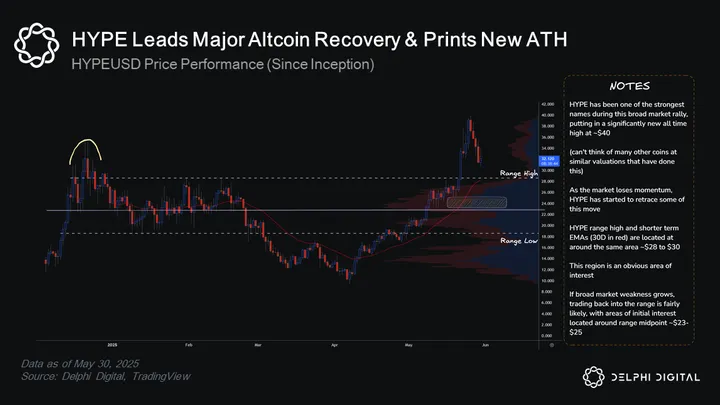
One of the newer and more favored crypto assets to track — Hyperliquid (HYPE) — has posted an extremely strong move out of the tariff-tantrum-lows hitting new all time highs in May. Hyperliquid continues to impress, both from a fundamental revenue-generating perspective and strong outperformance relative to peers.
This is an asset that surged onto the scene in November 2024, highlighted in our Year Ahead for Markets 2025 report as one of our higher conviction names for the year.
While we have seen bouts of outperformance over the last month, the disparity in returns across crypto sectors has continued. This can be best seen when looking at the dispersion between ETH-based DeFi protocols, and SOL-based DeFi protocols, with the former performing admirably as the latter lags. This is likely attributed to ETH’s strong outperformance over this timeframe.
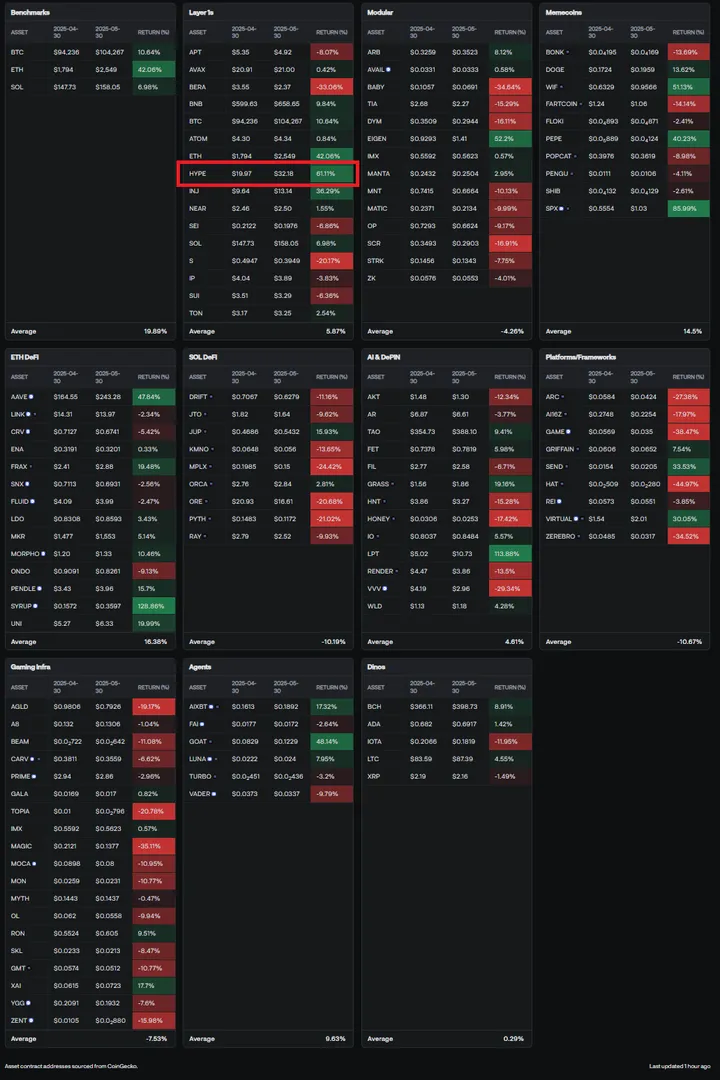
Table: Crypto Sector Performance – May 2025
The market is no longer climbing a wall of fear. Institutional flows remain supportive, and sentiment is constructive but not extended. As such, our tactical bias remains skewed toward the upside over the medium to long-term, with a relatively cautious stance in the short-term. In this environment, discipline around entry points, close monitoring of flow dynamics, and a focus on high-conviction exposure will be key to capturing outperformance as the cycle progresses into its latter stages.
Sentiment Signals
The Delphi BTC Top Signal and the Hope Metric both suggest sentiment is improving but remains contained.
- The latest Delphi Top Signal reading of 57.9 reflects strong participation without the excess seen during past cycle peaks.
- The Hope Metric followed a similar path in May, rising toward Cautious Optimism before fading slightly into month-end. The loss of alignment between price and sentiment in the second half of the month adds a note of caution.
Neither model signals overextension — though sustained upside will depend on sentiment re-engaging with price.
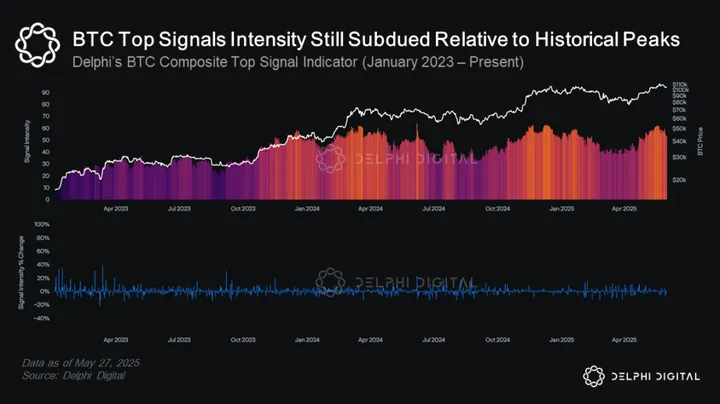
Delphi’s BTC Top Signal Model
The Delphi BTC Top Signal indicator is a proprietary model that measures conditions typically seen near Bitcoin cycle peaks & troughs. It combines a weighted mix of onchain, technical, sentiment, and macroeconomic inputs. The upper panel of the chart shows the signal’s historical range versus BTC price, while the lower panel tracks daily changes in signal intensity.
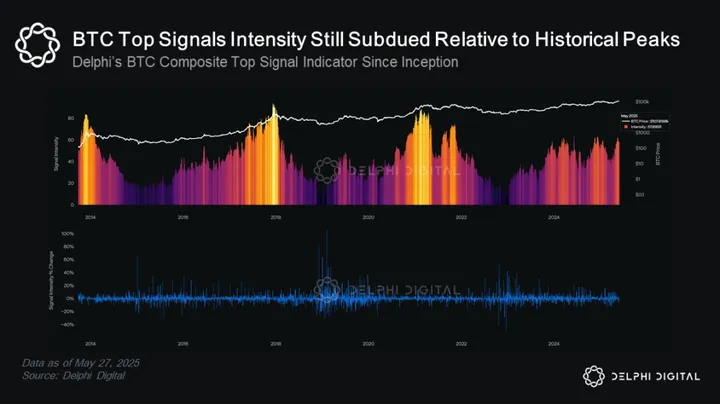
Despite BTC trading near all-time highs, the current signal reading of 57.9 remains well below prior peak levels. During past cycle tops, the signal consistently exceeded 80 and often stayed elevated for several weeks before prices reversed.
In contrast, today’s reading suggests elevated participation without signs of euphoric excess.
This supports the view that current BTC price action is not purely driven by retail excess or speculative overextension. The signal also suggests that the market may still have room to run before the kinds of structural exhaustion signals seen in past bull market peaks begin to flash in full.
At current levels, the signal continues to favor disciplined participation rather than defensive positioning.
The Hope Metric (HM)
The Hope Metric is a proprietary sentiment and positioning framework developed by Marcus Wu to quantify BTC risk appetite. It blends seven structural signals across macro, institutional, and crypto-native flows. For a detailed explanation of signal construction and scoring methodology, see the Appendix.
We use the Hope Metric in two core ways: as a tactical gauge for forward positioning, and as a risk signal for sentiment dislocations. Alignment between the Hope Metric and BTC price is tracked using rolling R² values. Green markers indicate strong alignment (R² > 0.7); red markers flag divergence (R² < 0.3).
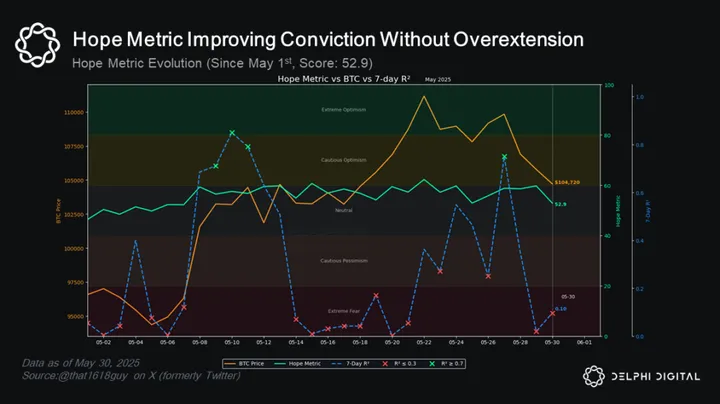
May saw a steady firming in crypto sentiment, with the Hope Metric rising from the high 40s to nearly 60. From May 12 to 15, scores consistently tested the threshold for Cautious Optimism, aligning with a move in BTC from $95K to over $109K. Strong R² readings between May 9 and 13 confirmed trend integrity, though the move later showed signs of exhaustion.
The Hope Metric closed the month at 52.9, below the Cautious Optimism band. While sentiment remains firm, it is no longer rising alongside price. In this environment, a sustained cluster of green markers is needed to validate further upside. Brief realignments followed by renewed red markets increase the risk of mean reversion if conviction fails to catch up.
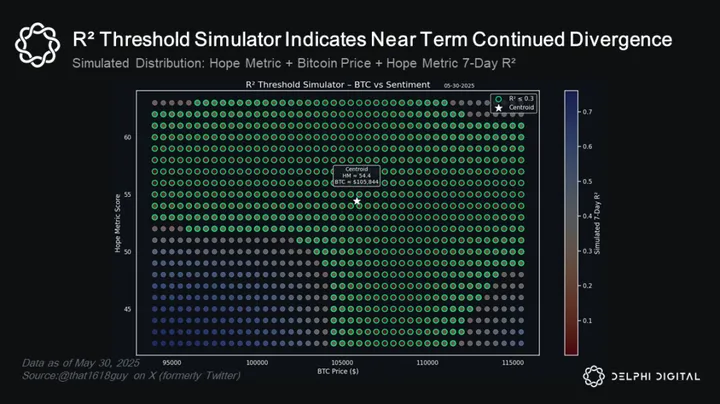
Despite the end-of-month recovery in BTC and R², the simulated forward path shows that a continuation of current BTC levels with only modest sentiment improvement is likely to produce more red markers in early June. This would signal that price and positioning remain decoupled, reinforcing the need for caution until alignment is restored. For conviction-led trend continuation, we would ideally see a move back into the upper right quadrant of this matrix where both sentiment and price are climbing together and alignment thresholds are consistently met.
Miner Economics
Strong Prices Buy Time, But Structural Pressures Remain
May delivered a much-needed rebound in miner profitability, but the underlying dynamics still reflect a fragile post-halving environment.
The recovery in USD-denominated hash price has been almost entirely dependent on BTC’s rally above $100K. Market strength has stabilized margins, but the reversal in net flows by month-end shows that confidence remains tactical rather than structural.
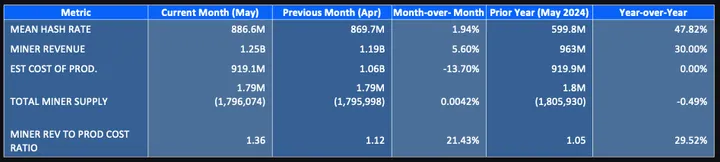
Table: Miner Metrics
Mining difficulty also rose steadily through May, with the latest adjustment pushing difficulty back to near all-time highs. Higher difficulty increases the baseline cost of mining each additional bitcoin, reinforcing pressure on operators who rely on efficient scaling, energy arbitrage, or balance sheet access to stay competitive.
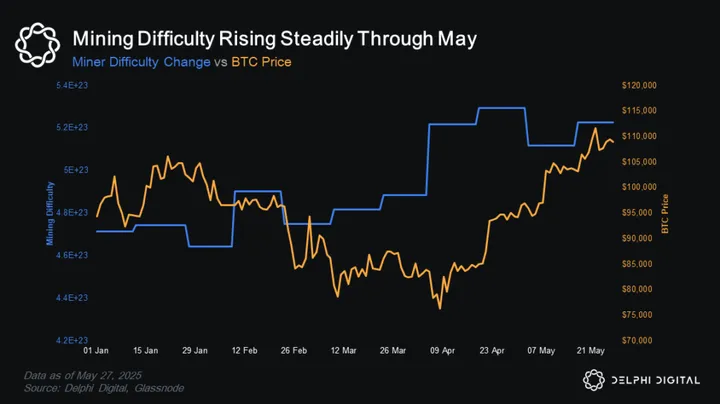
This environment favors large, well-capitalized miners with efficient infrastructure and flexible treasury strategies. Smaller miners, or those operating with BTC-denominated liabilities, may remain structurally constrained even with price near cycle highs.
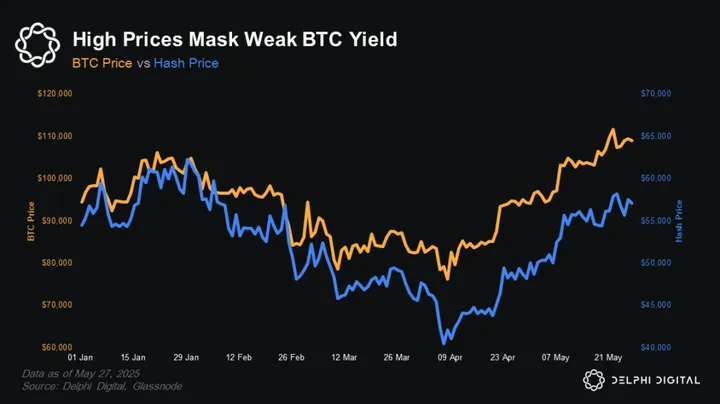
Miner revenue improved in May, but the recovery remains mostly price-driven. As BTC pushed above $109K, USD-denominated hash price climbed to $57,510 per exahash. This marks a strong rebound from the sub-$45K levels seen earlier this year and has helped stabilize margins for most operators.
In Bitcoin terms, however, the picture is flat. BTC-denominated hash price has hovered between 0.52 and 0.53 BTC per EH for weeks. Despite the price rally, miners are not earning more Bitcoin just more fiat. That distinction matters for treasury-focused miners and public operators looking to retain BTC on balance sheet.
With price doing the heavy lifting, miner profitability looks healthy for now. But any softness in market performance or an increase in difficulty could quickly compress margins once again.
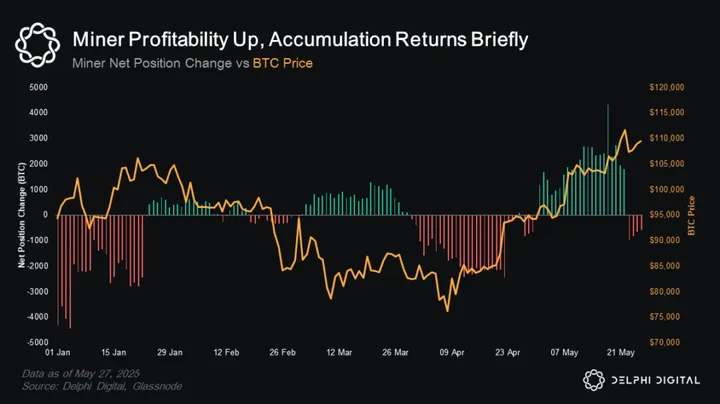
After months of steady distribution, miners shifted to net accumulation in early May. The turn came as BTC broke through $100K and hash price recovered in dollar terms. Between May 3 and May 23, miners consistently added to holdings, with inflows peaking mid-month. It marked the first meaningful accumulation stretch since early Q1.
The reversal was brief though. By May 24, net flows turned negative again. The rapid swing adds credence to the notion that the May accumulation period was opportunistic in nature rather than a shift to long-term holding behaviors. Even with buoyed margins, liquidity is still being managed closely. Higher prices create room to rotate, but capex obligations and rising difficulty are keeping BTC-based balance sheet growth constrained.
Institutional Adoption Trends Accelerate
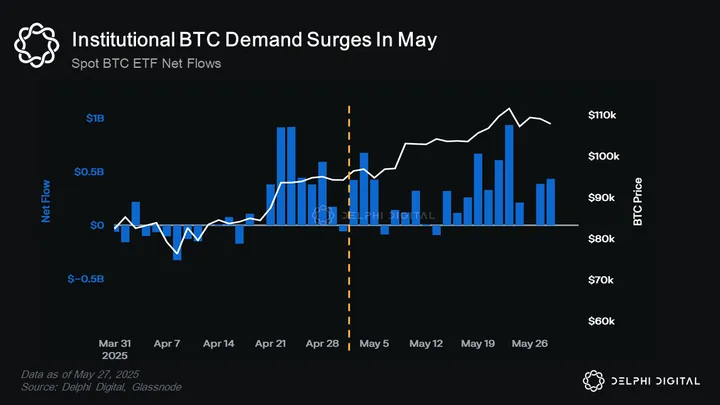
May marked a renewed wave of institutional demand for crypto ETFs, led by more than $3 billion in net inflows into Bitcoin products.
Flows were steady and directional throughout the month, positioning May as one of the strongest periods since the January 2024 launch window.
Ethereum ETFs showed early signs of rotation, with nearly $500 million in inflows as investors began to position ahead of regulatory decisions. While BTC remains the dominant allocation vehicle, ETH ETFs are beginning to attract structural flows, suggesting a potential turning point in market adoption.
ETF Flows: Bitcoin Demand Resurges, Ethereum Sees Early Rotation
As shown in the daily chart, flows were strongest between May 2 and May 22, including multiple days with more than $500 million in net inflows. These surges coincided with upward moves in BTC price, reinforcing the reflexive relationship between ETF demand and spot market momentum.
On a YTD basis, May marked a clear return to strength after a choppy end to Q1 and beginning of Q2. Earlier in the year, BTC ETFs faced intermittent redemptions, especially in periods of broader market weakness.
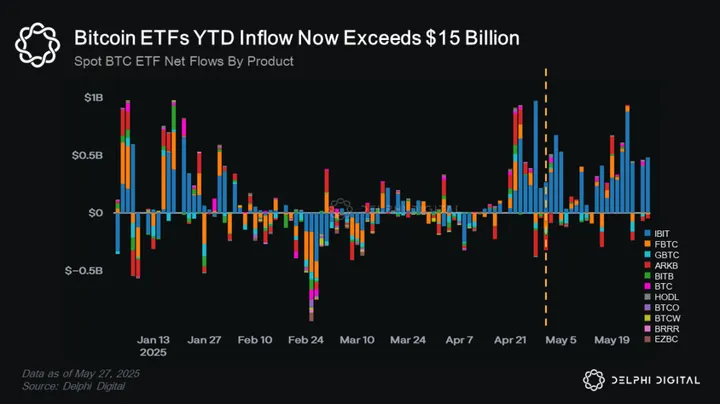
However, the May flow profile ranks as one of the most consistent uptrends since these products went live last year. Cumulative flows in 2025 now exceed $15 billion. This suggests that institutional and advisory demand has stabilized and is returning in force, particularly as BTC price regains its all-time high range.
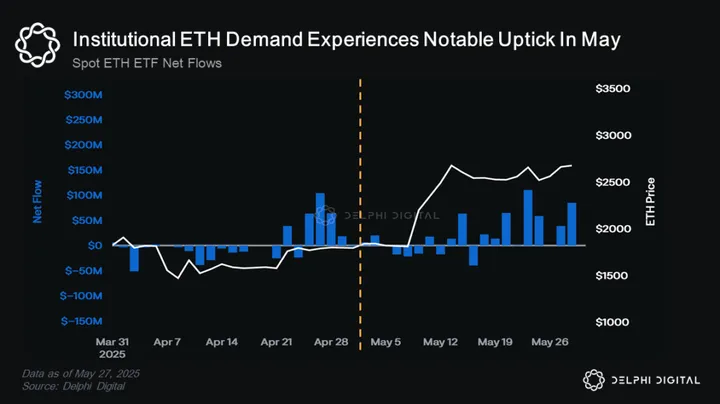
Ethereum ETF flows remained modest but constructive throughout May. Net daily flows were positive on most trading days, with inflows totaling just under $500 million for the month. While the scale is considerably smaller than BTC ETF flows, the ETH trend has shifted from stagnant to gradually supportive. Inflows picked up notably in the second half of the month, coinciding with ETH outperformance, pushing back above $2,600.
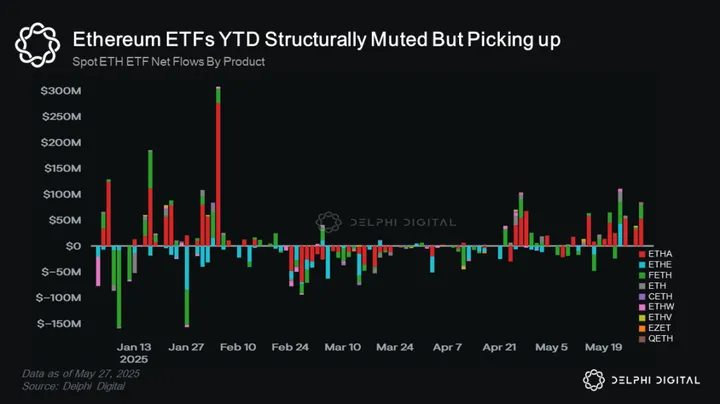
From a YTD perspective, ETH ETFs have remained structurally quieter than their BTC counterparts. Much of the early 2025 period was dominated by outflows or muted flows, reflecting lack of institutional demand and weaker price performance.
Conversely, May marked the best month of institutional ETH demand year-to-date, which could indicate an early turn in institutional positioning.
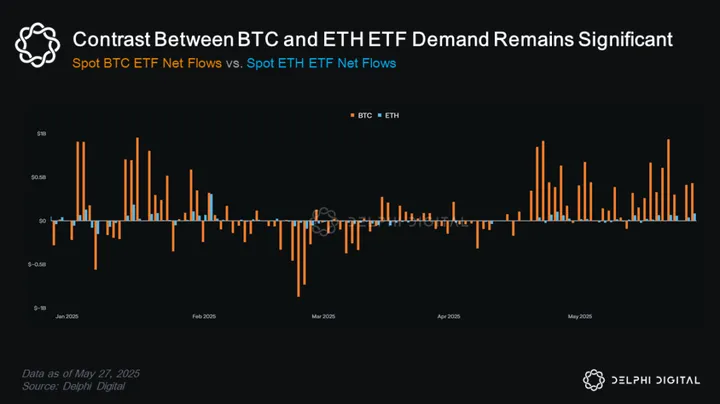
The contrast between BTC and ETH ETF demand remains significant. Bitcoin continue to dominate in both scale and consistency, with multiple days in May bringing in over $1 billion in gross inflows. ETH ETFs are seeing improved traction, but the flows remain an order of magnitude smaller. The hope is that institutional allocators begin to view ETH ETFs as complementary to BTC ETFs, particularly if staking incentives, reduced net issuance and DeFi exposure gain broader recognition.
Treasury Holding Company Trend Expands Beyond Bitcoin
May saw a sharp acceleration in crypto treasury activity across public markets, with firms deploying over $500 million in new capital to acquire Bitcoin, Ethereum, and Solana.
MicroStrategy led BTC additions with 4,020 new coins, while emerging vehicles like SharpLink Gaming and Upexi initiated transformative ETH and SOL reserve strategies.
Unlike prior cycles, these holdings were not financed from excess cash but through dedicated equity and debt raises, signaling the rise of a new financial structure: publicly traded crypto accumulators built to systematically acquire and hold digital assets.
The result is a new category of public equities functioning as crypto-linked proxies. These companies blend capital markets access with digital asset exposure. Ethereum and Solana are emerging as strategic reserve assets, backed by targeted financings and integrated yield generation models.
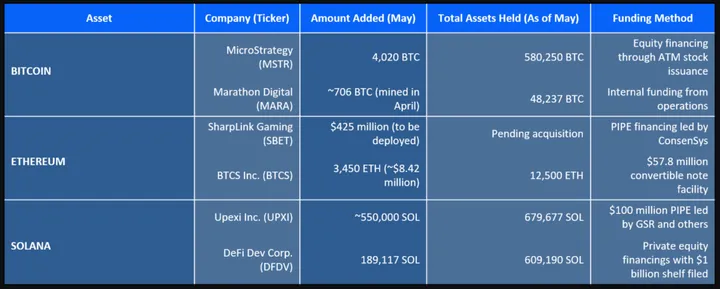
Table: Notable Crypto Treasury Holding Companies
One of the more notable developments in May came from Ethereum. SharpLink Gaming, a lightly capitalized Nasdaq-listed company, became the first public ETH treasury proxy. Through a $425 million PIPE led by ConsenSys, SharpLink is being transformed into a dedicated Ethereum reserve vehicle.
The transaction involves issuing 69 million new shares at $6.15, transferring over 90% control to the ETH-aligned investor group. This structure bypasses the traditional SPAC or IPO path and creates an immediate listed ticker with Ethereum exposure.
SharpLink is expected to purchase up to 120,000 ETH with its proceeds, a significant portion of which will likely be staked, positioning the company as a high-beta, yield-bearing Ethereum proxy.
The intended flywheel is straightforward:
- Raise capital below net asset value
- Acquire and stake ETH
- Use any share price premium to raise additional funds
- Use funds to acquire and stake more ETH
- Repeat
If successful, this will turn SharpLink into an equity-based ETH accumulator. This model offers several structural advantages. It creates a regulated, publicly tradable wrapper for institutions that are unable to hold ETH directly. It also removes circulating ETH from the market, converting it into long-term staked supply. From a narrative standpoint, it reframes Ethereum as a form of digital reserve collateral, much like Bitcoin has served for MicroStrategy.
So what is the outlook and strategic implication of this crypto treasury holding company trend?
Alongside the ETH pivot, BTC and SOL activity also accelerated. MicroStrategy remains the BTC anchor, now holding over 580,000 coins. Upexi and DeFi Dev Corp are building parallel models for Solana. Both are deploying capital to acquire, stake, and monetize their SOL reserves, effectively turning into publicly listed Solana funds.
For institutional allocators, the implications are clear. A new class of crypto-linked equities is emerging, sitting somewhere between operating company, holding company, and public fund. These vehicles can offer leverage, staking yield, and embedded growth exposure that is not possible through ETFs or direct token purchases. As these model matures, new metrics such as ETH per share, staking yield, and treasury to market cap ratios will become central to evaluating these firms. Risk remains high due to token price volatility, funding structure dilution, and liquidity gaps.
Stablecoin Flows: Net Expansion Driven by USDT, USDC
Stablecoin supply expanded modestly in May, with total circulating value rising across USDT, USDC, and smaller stablecoin issuers. USDT led in an absolute sense, increasing by 2.91% month-over-month to reach $152.73 billion, continuing Tether’s dominance. On a year-over-year basis, USDT supply is up 36.4%, underscoring its durability.
USDC supply was effectively flat on the month, rising just 0.08% to 61.56 billion. But the deeper signal lies in the year-over-year comparison: USDC supply has surged 90.4% since May 2024. That growth confirms a steady comeback, driven by regained market confidence, stronger integration with regulated custodians and TradFi platforms, and broader institutional usage. While still markedly smaller than USDT, USDC is quietly catching up.
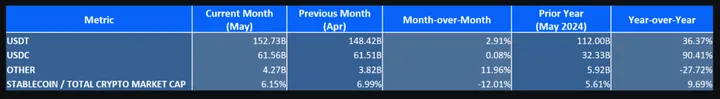
Table: Stablecoin Market Caps Continue Expanding
Other stablecoins, including BUSD, DAI, and TUSD, posted the strongest month-over-month gain at 11.96%, but their footprint remains limited at just 4.27 billion. Compared to a year ago, the category is still down nearly 28%, signaling long-term consolidation toward the two major issuers.
Regulatory Acceptance Continues To Build
State Sponsored Bitcoin Reserve Fund Trend Builds Momentum
The State Bitcoin Reserve (SBR) movement gained notable traction in May, with legislative progress accelerating across multiple states. Arizona and New Hampshire became the first to fully enact bills allowing Bitcoin to be held as a treasury reserve asset, clearing all chambers and formalizing policy adoption. These moves mark a regulatory milestone and set a precedent for other states pursuing similar frameworks.
Several others, including Texas, North Carolina, and Montana, advanced SBR bills through key committees or full chamber votes during the month. While not yet enacted, these states made meaningful legislative progress.
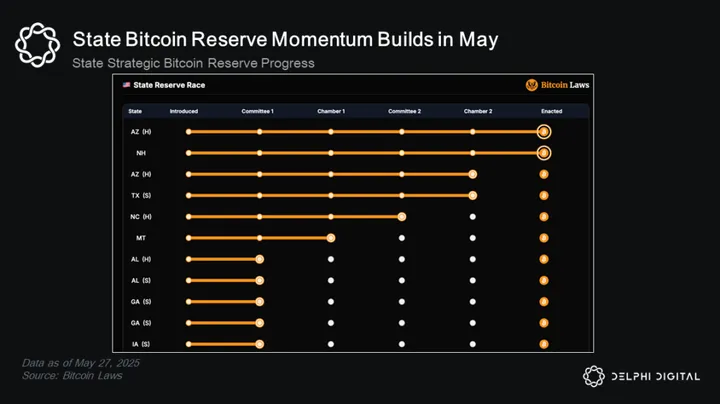
May’s activity confirms that the SBR trend is no longer theoretical. Legislative pipelines are forming, and state-level recognition of Bitcoin as a strategic asset is starting to materialize. For institutional observers, this reflects a slow but steady normalization of Bitcoin in public finance infrastructure.
Genius Stablecoin Bill Advances in Congress
May marked a pivotal breakthrough for U.S. stablecoin legislation as the Genius Act advanced with bipartisan momentum, successfully clearing the Senate.
Designed to create a comprehensive federal framework for payment stablecoins, the bill moved out of the House Financial Services Committee earlier this month and quickly gained traction in the upper chamber. It outlines strict requirements for fiat backing, issuer licensing, and regulatory oversight, while explicitly prohibiting algorithmic or undercollateralized stablecoins from being classified as compliant.
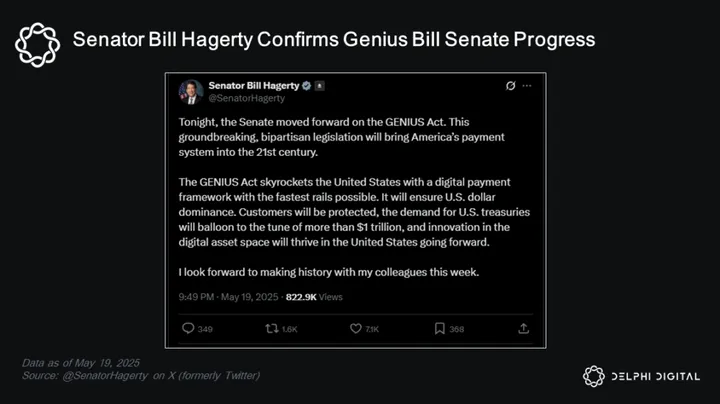
On May 19, Senator Bill Hagerty publicly confirmed that the Senate had voted to advance the bill. In his statement, he described the Genius Act as “groundbreaking, bipartisan legislation” that will modernize America’s payment infrastructure, ensure U.S. dollar dominance, and drive demand for U.S. Treasuries across the digital asset ecosystem.
The passage of the Genius Act through the Senate marks the most meaningful legislative step forward for stablecoin regulation in the United States to-date. With House approval still pending, the bill is now positioned as the leading federal effort to define how stablecoins can be issued and supervised under U.S. law.
Key provisions include clear pathways for both bank and non-bank issuers, reserve custody rules, and explicit consumer protection standards – elements widely seen as necessary to legitimize stablecoins as a core financial infrastructure layer.
Crypto Protocol Spotlight – The Age of Tokenization
Excerpt from The Future of Onchain: The Age of Tokenization & The Token Identity Crisis
Recent explosions in Stablecoin adoption and on-chain perpetual decentralized exchanges (DEXs) have confirmed the growing appetite for 24/7 financial market access. The Nasdaq has recently announced plans to shift towards 24/7 trading hours. Pair this with Trump’s propensity to make massive decisions on weekends, as well as the record-breaking 41 trillion in global foreign investment, and the path forward for decentralized, on-chain applications has never been more clear.
- Why wait for traditional finance markets to open in order to trade Trump’s Saturday headlines?
- Why should the companies of tomorrow be limited to yesterday’s markets and private investors?
- Why shouldn’t the average investor be able to easily access these opportunities?
The future of Onchain applications lies in bringing high-friction, high-barrier-to-entry financial vehicles to the blockchain for 24/7 cross-border trading for all. More specifically, the tokenization of private equity, securities, and commodity markets for every user to access. Robinhood’s CEO has even called tokenization “an investing revolution.” At first glance, this might appear to be what current RWA tokens seek to achieve, but this would be categorically false.
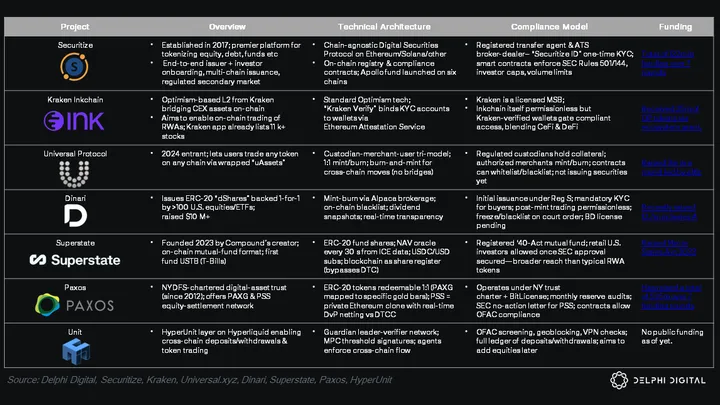
Most current RWAs serve as proxies for the “real world asset” that backs their token. What we are referring to is the actual protocols and applications making it possible for us to trade these “real-world assets” and securities directly. Protocols like these will be enabling the future and thus should be pertinent to us in the present.
Read the rest of this report – The Future of Onchain: The Age of Tokenization & The Token Identity Crisis
Notable Reads
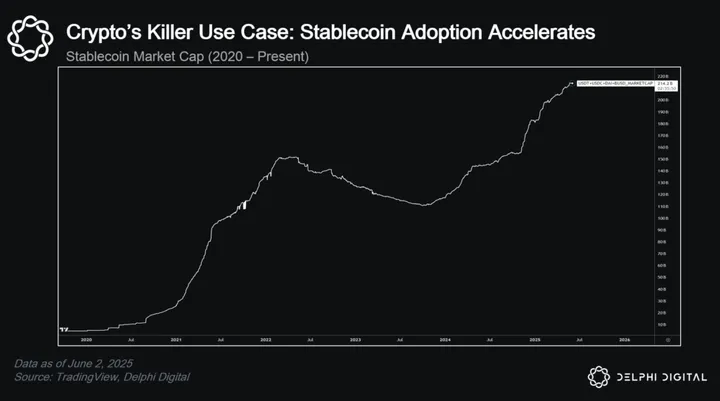
Stablecoin Marketcap – A snapshot of the total stablecoin market cap, offering a pulse check on on-chain liquidity and capital availability across crypto markets.
The fundamental value of bitcoin – A deep dive into Bitcoin’s valuation from a macro perspective, arguing its long-term value lies in censorship resistance and energy-backed scarcity.
Upexi’s SOL Acquired to Date – Corporate disclosure from Upexi showing its ongoing SOL accumulation, highlighting growing adoption of crypto assets in public treasury strategies.
BlackRock and Apollo lead nine firms in SEC panel on tokenisation– Major TradFi players, including BlackRock and Apollo, join SEC discussions on tokenisation, signaling growing regulatory focus on real-world asset infrastructure.
On building a crypto capital – A16Z outlines its thesis for what makes a region competitive as a crypto hub, covering legal frameworks, capital access, and builder incentives.
Appendix & Disclosures
Hope Metric Methodology Overview
Framework Design
The Hope Metric is a proprietary sentiment and positioning framework developed by Marcus Wu to quantify conviction across crypto markets with a dedicated focus on Bitcoin. The model is designed to surface early signals of directional bias, flow regime shifts, and market positioning strength, especially in periods of macro uncertainty or structural realignment.
Each daily score is produced by synthesizing seven structural signals, which collectively span the macro, institutional, and crypto-native domains. These signals include:
- Monetary Policy and Fed Sentiment
- Macro Indicators and Market Expectations
- Geo-Economic Stability
- Government and Institutional BTC Actions
- Crypto Policy and Legal Developments
- Exchange Liquidity and Risk
- Corporate BTC Accumulation
Each day’s score reflects the aggregated readout of seven weighted signals, producing a normalized value between 0 and 100 that captures the market’s evolving sentiment and risk posture.
HM Sentiment Bands
To contextualize the daily score, the Hope Metric is categorized into one of five sentiment bands. These ranges represent the broader emotional and structural tone of the market:
- Extreme Fear (0–19): Capitulation, disorderly flows, and suppressed conviction. Often signals poor positioning or panic-driven conditions.
- Cautious Pessimism (20–39): Bearish but stable. Markets may be climbing out of oversold levels or reacting to latent stress.
- Neutral (40–59): Balanced sentiment. No prevailing edge, but underlying setup is sensitive to new information.
- Cautious Optimism (60–79): Constructive tone building. Typically observed during trend development phases or post-correction recoveries.
- Extreme Optimism (80–100): Euphoric conditions, often driven by reflexive inflows or over-positioning. Historically linked to tops or volatility inflection zones.
These bands help segment the market’s emotional regime and identify where sentiment may be extended, supportive, or vulnerable to reversal.
R² Alignment Framework
To evaluate the strength of alignment between Bitcoin price action and sentiment, the Hope Metric incorporates a rolling R² between BTC price and the daily Hope Metric score. This provides a statistical view of how closely conviction tracks price.
- When R² is greater than 0.7, we flag a green marker, indicating strong alignment. This typically reflects a healthy market dynamic in which price is being supported by improving conviction, positioning flows, and broad-based sentiment.
- When R² drops below 0.3, we flag a red marker, indicating divergence. This suggests that price may be decoupled from conviction, with either sentiment failing to confirm upside or optimism increasing while price stalls.
Sustained green markers tend to accompany conviction-led trends where sentiment and price reinforce each other. In contrast, red markers highlight periods where that alignment breaks down either because sentiment is lagging a price move or because optimism is rising without price confirmation. These divergence zones often precede periods of volatility, trend exhaustion, or reversion.
Interpretation in Reflexive Contexts
The Hope Metric draws on reflexivity theory commonly applied in equity and FX markets. In reflexive systems, price action influences positioning, which in turn reinforces price. When sentiment and positioning align with trend, the feedback loop tends to accelerate. When sentiment begins to diverge – particularly during late-stage rallies or corrections – this loop can unwind abruptly.
This reflexivity lens allows the Hope Metric to function as more than a sentiment gauge. It becomes a tactical overlay for managing position sizing, assessing trend sustainability, and anticipating regime shifts. For discretionary macro and multi-asset desks, it provides a structured, cross-market-compatible view of crypto market dynamics that is useful in portfolio construction, hedging, and rotation decisions.
0 Comments