Monthly Chartbook - Crypto Purgatory [March 2022]
APR 07, 2022 • 22 Min Read






The Monthly Chartbook is a collection of interesting charts and trends we’re watching across crypto.
Bitcoin Market Trends
-
Q1 was a volatile one for global markets, and crypto was no different.
-
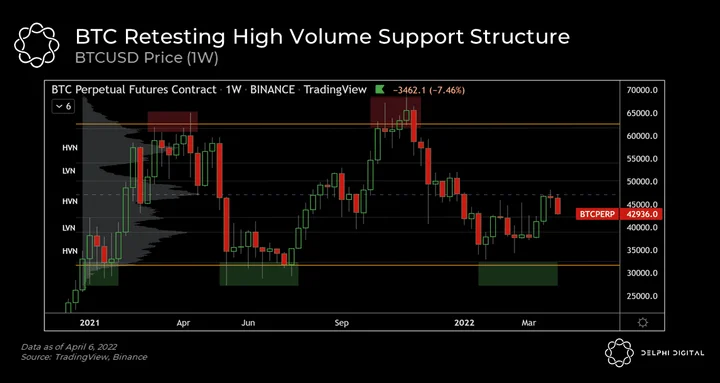
After a strong close to Q1, BTC has sputtered back to the middle of its extensive multi-month trading range. Generally speaking, we know from prior studies that the midpoint of a price range is the least favorable place to take trades in terms of the risk vs. reward tradeoff.
-
After failing to reclaim the midpoint of the weekly market structure, BTC finds itself retesting the high volume node boundary located around $42-$44K. Bulls will likely want to see these higher timeframe levels defended successfully if a short to mid-term trend reversal is to take place.
-
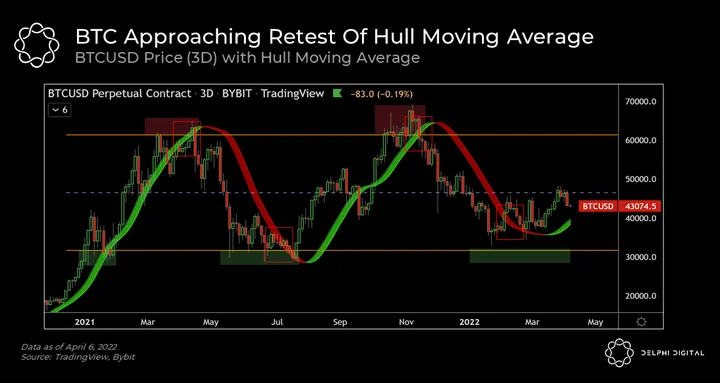
The Hull Moving Average (HMA) is a directional trend indicator that attempts to capture changes in price momentum. It determines whether the market conditions are bullish or bearish relative to historical data by weighing recent price action.
-
The HMA has 2 aspects; the positional value and directional value. The positional value is determined by the HMA relative to price while the directional value is taken from the direction of the market slope. The combination of these two aspects is what allows the HMA to be smooth and yet responsive to price changes.
-
HMA signals are most efficient for directional signals and not for crossovers between moving averages since the latter are distorted by lag. Instead, it is often more prudent to look at price crossing the ribbon for areas of directional shift.
-
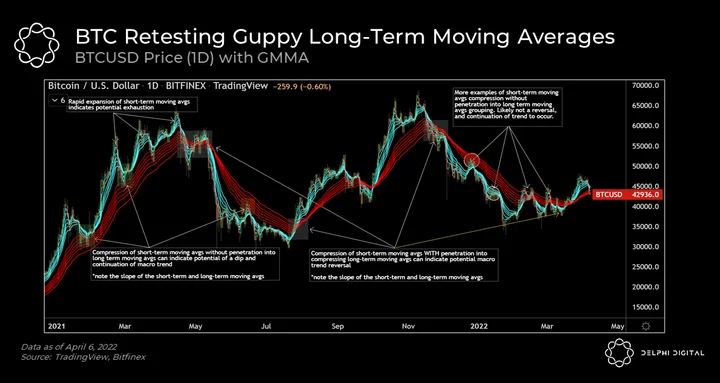
In the last 2 weeks, the GMMA confirmed a full bullish crossover between the short-term MA grouping (blue) and the long-term MA grouping (red). This is the first time that we have seen a confirmed bullish crossover with this tool since the November 2021 ATH, and all previous occurrences of this signal have proved to be fruitful for BTC returns in the next several weeks.
-
As BTC starts to lose momentum, we are looking for the long-term MA grouping (red) to act as support should price retest this area. This price area is roughly $42K-$43K, which coincides with the other support areas we highlighted, including the high volume support structure on the weekly timeframe and the dynamic HMA ribbon.
For more detail, on key support and resistance levels we’re watching, and some commentary on the current market structure, see the end of this report.
Market Structure Make-Up and Liquidity Conditions
-
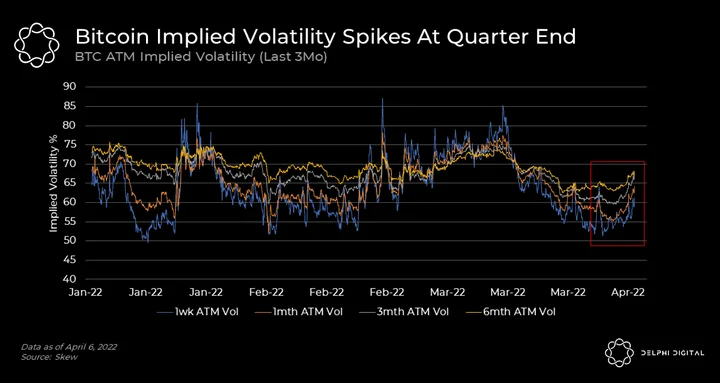
Q1 was volatile, to say the least. Each of the last three months has seen implied volatility levels spike before subsiding as prices have ranged between $34K and $45K. The last week has seen implied volatility across major expiries start to tick upwards again, signaling another potential move in the works. This comes as BTC pulls back from $48K resistance.
-
A similar story can be seen in the BVIN Index; or the Bitcoin Volatility Index.
-
We can also see the uncertainty that volatility brings as spreads have begun to widen again. This can be visualized in the $5M Bid/Offer Spread relationship over the last 7 days.
-
Forward month futures basis has also started to pull in, which is yet another indication of slight trepidation of the future in light of the increasing volatility conditions.
For charts including the BVIN Index, the $5M Bid/Offer Spread, and the Forward Month Futures Basis, plus commentary on current market liquidity, please see the Appendix section at the end of this report.
Accumulation Trends Favor More Hodlers
-
The first report Delphi ever published was back in December 2018 when we called the bottom in bitcoin’s price. One of the key indicators that gave us such conviction was our analysis on UTXO trends, specifically the trend in long-term holder behavior. We looked at the % of BTC that hadn’t moved in at least a year and found tha
Read the full report
This report is part of Delphi Pro.
- 800+ Pro reports across every major sector
- Talk directly with our analysts
- Private community of funds and builders
Already a Pro member? Log in
0 Comments