Monthly Chartbook - Falling Out of the Merge
OCT 11, 2022 • 21 Min Read






The Monthly Chartbook is a collection of interesting charts and trends we’re watching across crypto and markets. This month’s edition focuses on:
- Macro Outlook
- Crypto Market Review: Market Structure & On-Chain Observations
- L1s, L2s, & DeFi Analysis
- NFTs & Gaming Sector Breakdown
Macro Outlook
Keeping with the theme of previous iterations of The Chartbook, we ask ourselves the same high-level question. Has anything changed on the macro front given that we are in what we’ve described as a macro driven bear market? This month, the answer is…not really. We have recently written an excellent report, Crypto’s Make or Break Moment, which discusses the below themes in more depth should you be interested.
The Fed remains hawkish, once again reiterating its desire to curb inflation at all cost. To quote Fed Chairman Powell, “To accomplish that [bring inflation back down to 2%], we think we’ll need…a period of growth below trend and also some softening in labor market conditions to foster a better balance between demand and supply and the labor market.”
The DXY remains strong, consolidating beneath its recent highs as other central banks struggle to maintain financial stability within their own jurisdictions. The labor market is showing signs of stubbornness, with the most recent nonfarm payrolls coming in hotter than expected, adding fuel to the narrative of “sticky high inflation for longer.”
Speaking of inflation, markets are in store for quite an important week, with the next batch of CPI numbers coming out on October 13th. If the NFP surprise is a sign of things to come, markets could be in for a rude awakening come Thursday.
-
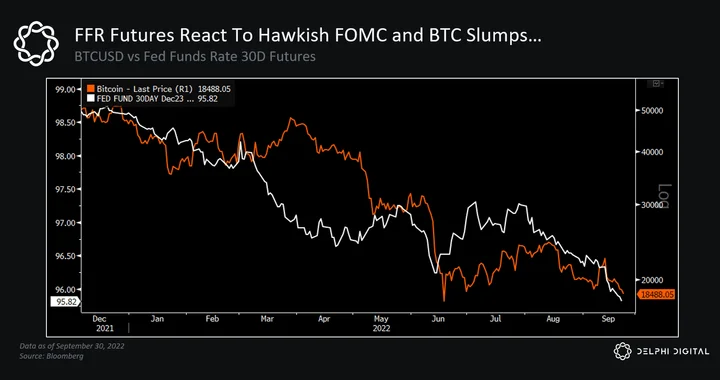
For example, should CPI numbers come in hotter than expected again, it will all but solidify that there will be no Fed pivot through year-end. As the Fed continues to raise interest rates at a record pace, we have seen Fed funds futures react along with risk assets such as BTC.
-
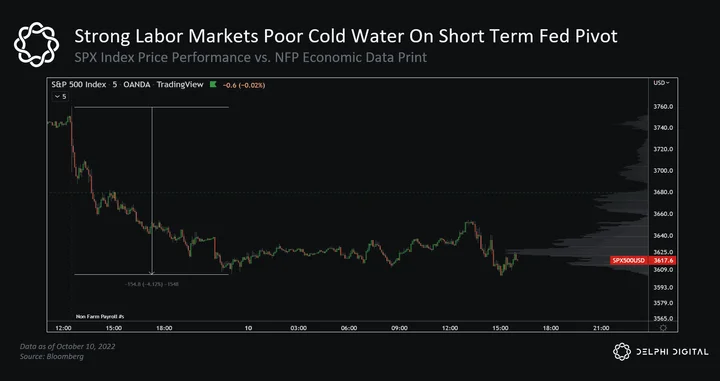
We can clearly see what the market thinks about the most recent nonfarm payroll numbers coming in hotter than expected; less of a chance of a quick Fed pivot, and the subsequent de-risking and repositioning of market participants.
-
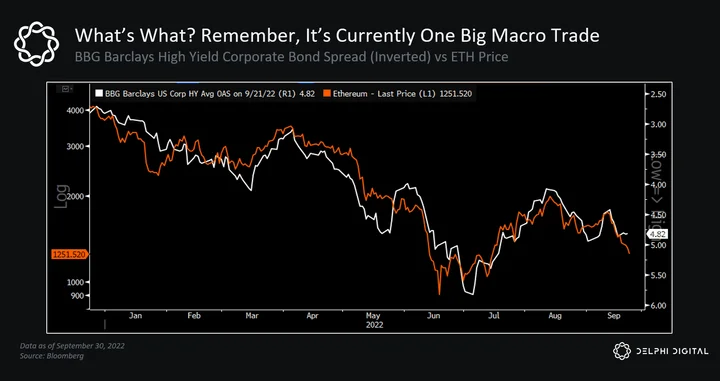
Charts can say a thousand words. In the chart above, we compare ETH’s price to high-yield corporate bond spreads (inverted on the right axis). While you could argue the two have little to do with one another, they have moved in lockstep over the last 12 months. It’s just one big macro trade…
-
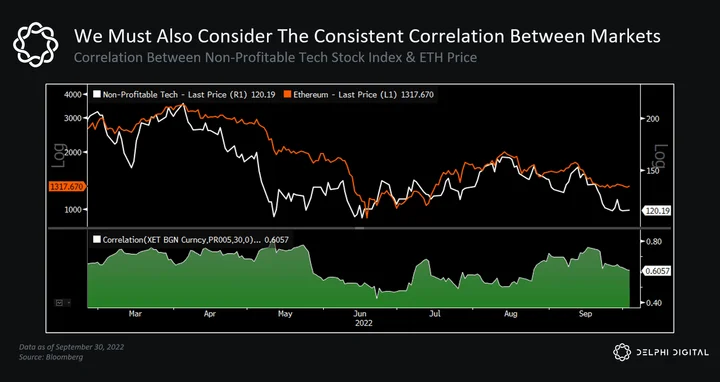
This is evidenced by the elevated correlations between many crypto assets and higher beta stocks.
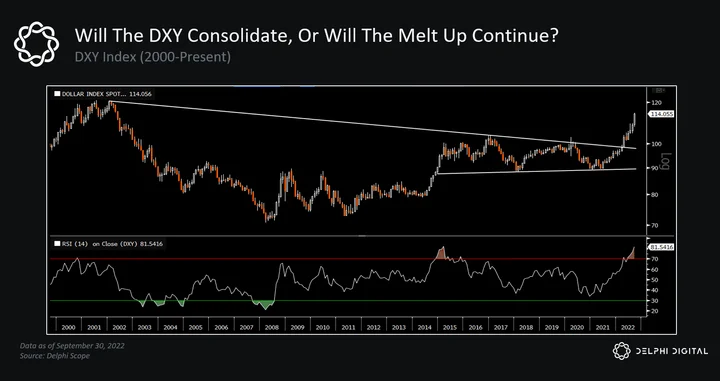
- All eyes are on the DXY after its 12-month ascent to levels not seen in decades.
- The size and pace of the move have pushed the 14-month RSI on the DXY to its highest level since Q1 2015. After such a strong run-up, we may see some consolidation here (though we caution that doesn’t mean the dollar bull run is over).
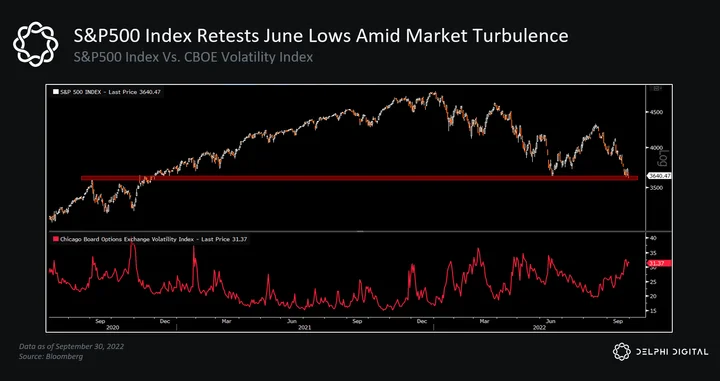
- With the dollar having its strongest year in decades, it is no surprise that equity markets find themselves up against the ropes. The S&P500 finds itself trading a hair above the local June lows.
- It is nothing short of crunch time for risk assets as we make our way into Q4.
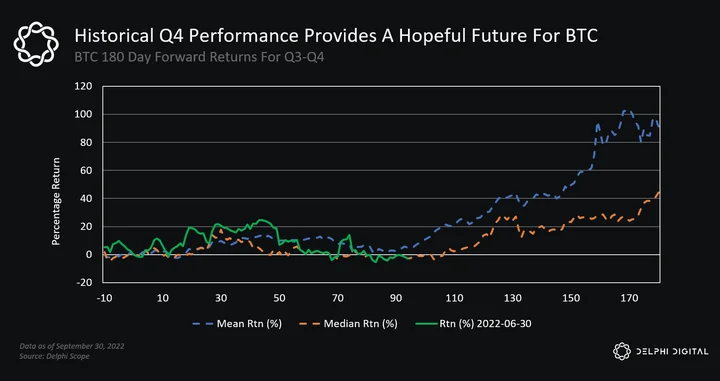
- Historically, Q4 has been the best quarter for BTC when taking into account ALL datasets since inception. This provides some hope for bulls as they look to put a miserable 2022 in the rearview for good.
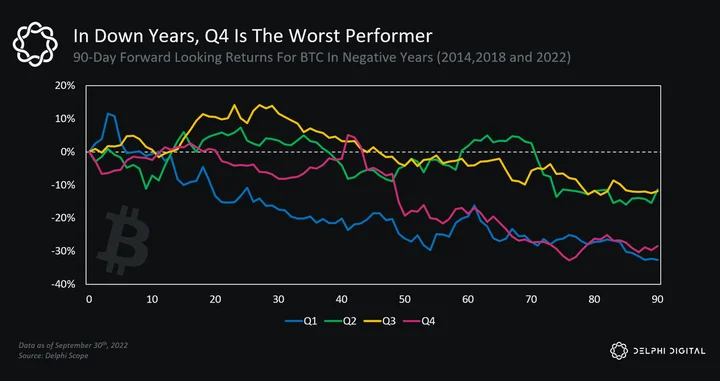
- Not so fast, though. When we look at BTC in years that have occurred during bear markets, we see a shockingly different result. The exact opposite can be found for Q4 performance during bear market years. This is certainly food for thought.
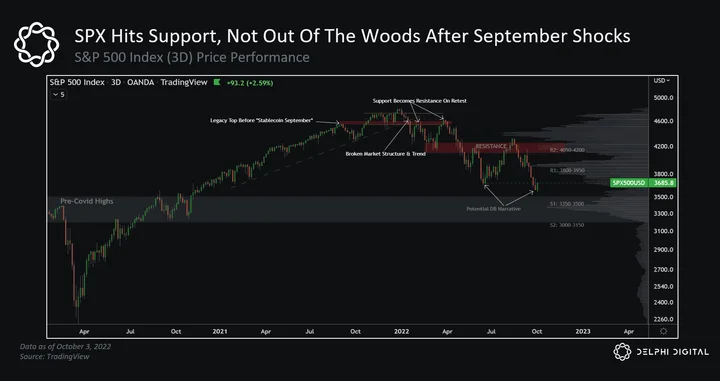
As previously mentioned, all eyes are on the upcoming CPI numbers on Thursday, October 13th. Below are key levels that we will be watching in the ev
Read the full report
This report is part of Delphi Pro.
- 800+ Pro reports across every major sector
- Talk directly with our analysts
- Private community of funds and builders
Already a Pro member? Log in
0 Comments