Setting the Stage – Signs of a Market Bottom
The crypto market is facing one of its sharpest drawdowns on record. Most crypto assets are down anywhere from 60-90% from their prior highs. Sentiment is awful, liquidity is drying up, funding is becoming more scarce, capital preservation and risk management are back in vogue, and the game has shifted from ape-at-any-cost to one of survival. But the question on everyone’s mind is when will it end? When will we find a bottom to this brutal downtrend?
Signs are starting to emerge that the worst is likely behind us, but we need to see a little more pain before we have conviction that a market bottom is in. Sentiment is in the gutter, but it can get worse, especially if today’s macro headwinds don’t subside. Previous market bottoms were characterized by extreme oversold conditions and a retest of key long-term support levels. We’ve seen both of those conditions fulfilled over the last week, but history shows sideways price action is the most likely path for at least the next few months.
We’re getting closer to a market bottom, but we’re not quite there yet, at least in our opinion.
Market cycle bottoms typically share some (or all) of the following characteristics:
-
Extremely bearish sentiment
-
Clear evidence of price capitulation and forced selling (which eventually leads to seller exhaustion)
-
Liquidity and funding dries up; private market valuations reprice as public market comps see their valuations crater
-
Companies announce layoffs and cost cutting measures to batten down the hatches in anticipation of a multi-year bear market
-
Macro trend reversal, usually driven by a catalyst event like a drastic change in rhetoric that causes the market to reposition for a different policy regime, which brings renewed enthusiasm and capital into risk assets and crypto
We have to caveat that trying to time any market is incredibly difficult. The truth is no one knows exactly when this market will bottom out. The best we can do is try to identify signs that characterize a price bottom so we can shift probabilities more in our favor.
Markets are forward looking indicators, which means prices will likely bottom and turn higher before the masses gain enough conviction to pile in. We want to be prepared for when that time finally comes. If you believe the last 24 months was just the tip of the iceberg for this movement, today’s market is offering flash sales for those looking to accumulate long term positions.
Damage Assessment
We started writing this report a couple weeks ago when BTC and ETH were trading around $30-31K and $1.8-1.9K, respectively. Rather than remove all of the original charts, we decided to include some of them alongside their updated versions to give a sense of how quickly things have shifted over the last two weeks.
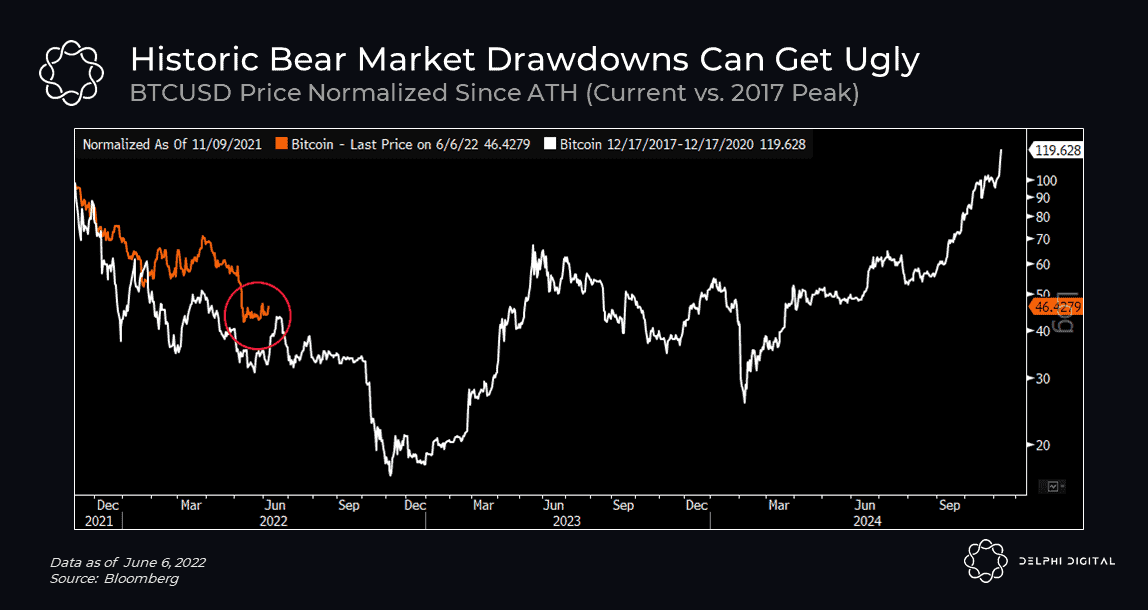
Is the worst behind us or is there more pain to come? If this time isn’t different, we could see another 50-70% drawdown in most liquid crypto assets as we saw back in late 2018. If we compare BTC’s current drawdown to the one we experienced after its 2017 all-time high, there’s clearly more room for prices to fall.
At the time, we were looking at how far BTC would have to fall if it followed the same playbook as 2017-18. The answer: another 65%.
Since then, BTC has dropped another 30%, which now shows an even sharper drawdown compared to 2017-18.
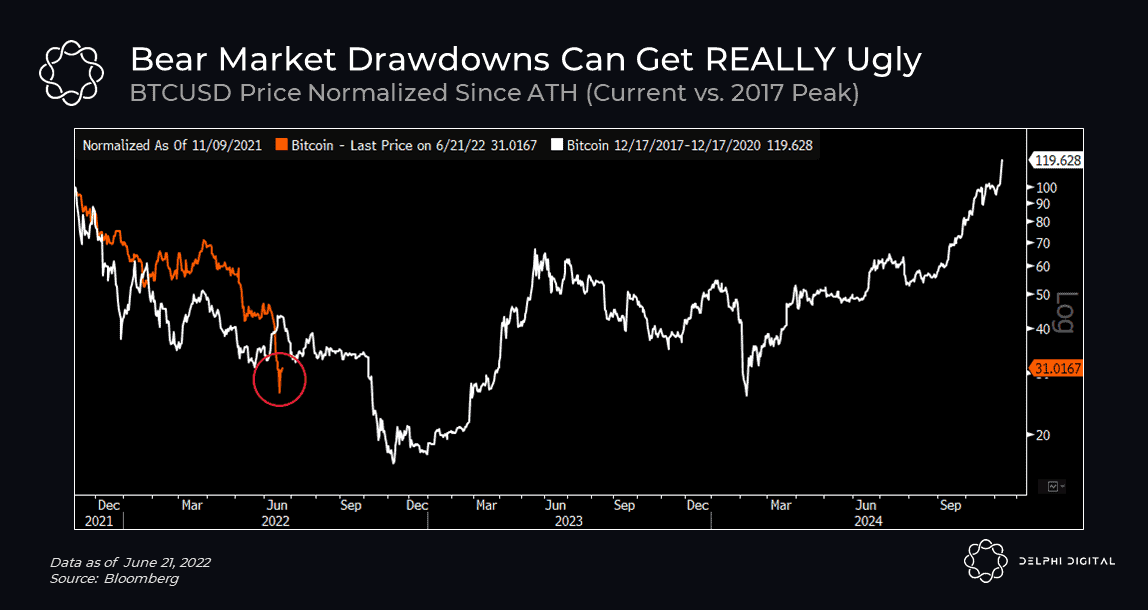
For context, the price of BTC fell ~85% from peak-to-trough in each of the last two major bear markets. Right now it’s down ~72% from its high, but if history repeats it would imply a low just above $10K and another 50% drawdown from current levels.
In the short run, the picture still doesn’t look great for BTC. From a high timeframe market structure perspective, the next place we have to be looking at is $10K-$12K. Once BTC broke down from the 2021-2022 price range ($30K-$60K), it became increasingly more likely that we revisit this area as there has been minimal market structure developed in the void from $12K-$30K.
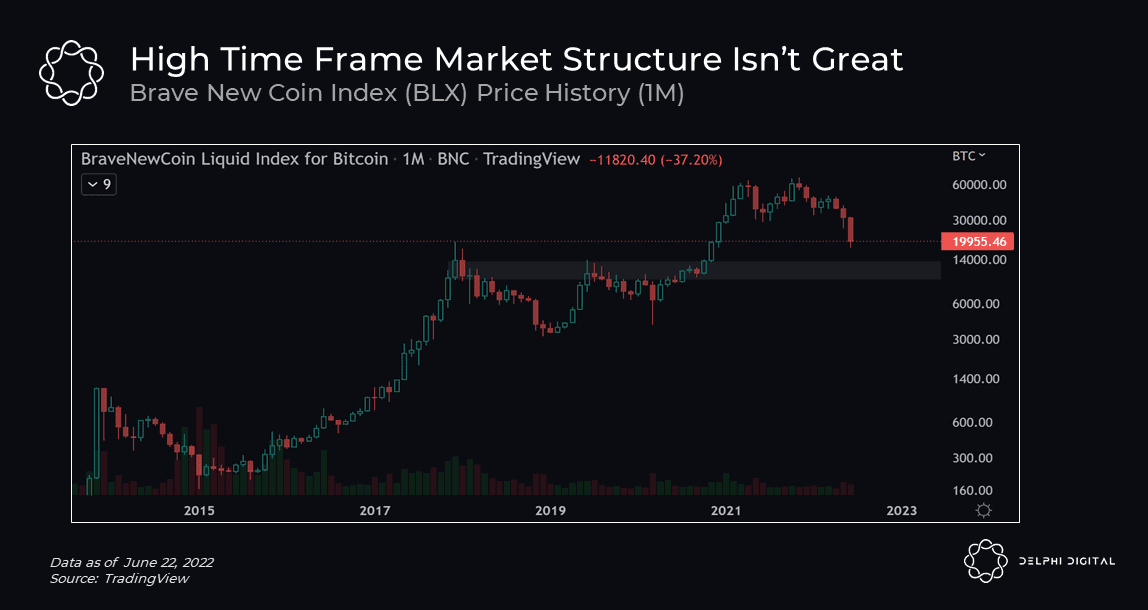
If we do a quick eye test on the long term BTC chart (with a focus on the 2017 cycle), we can clearly see where high timeframe market structure support is likely to exist. This is highlighted with the gray box from $9.5K to $13.5K. Coincidentally, this area lines up with the implied low if BTC experiences an 85% drawdown from peak to trough.
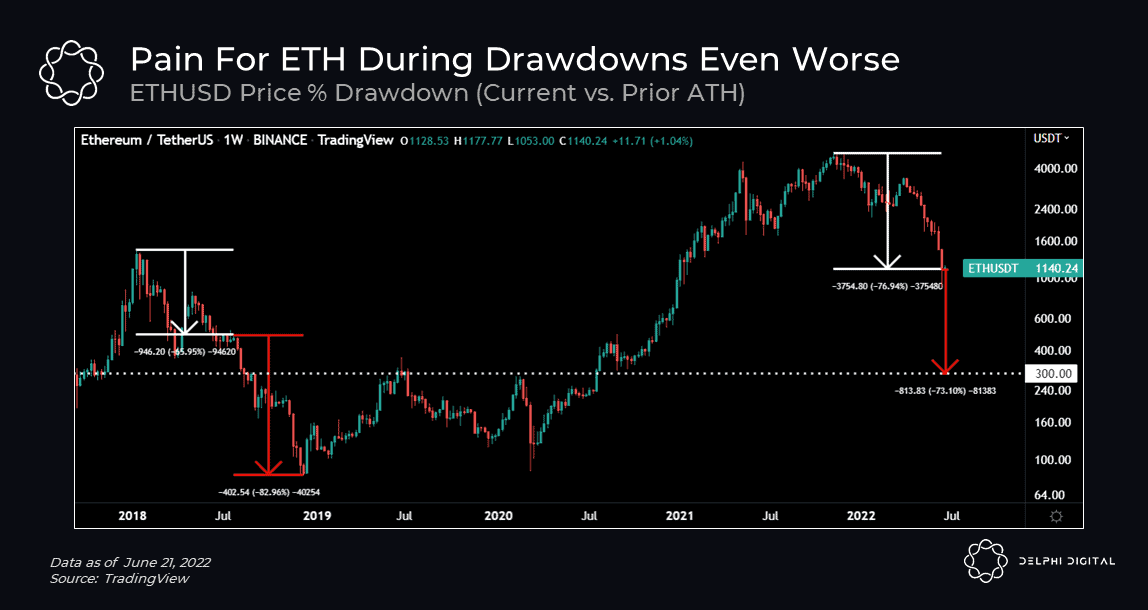
Reliving the last major bear market would be even worse for ETH, which fell ~95% from peak to trough. Again, this is what we were looking at just a couple weeks ago…

…and ETH has dropped nearly 40% since. It’s hard to imagine things getting as ugly as a full 95% peak-to-trough drawdown this time around, but the risk of reliving a similar crash is higher than most people are probably discounting, especially if BTC fails to hold support in the $14-16K range.
Market turmoil is often exacerbated by a reduction in liquidity, which we’ve seen dry up even on major centralized exchanges (CEXs) as bid/offer spreads for BTC and ETH widen to new highs.
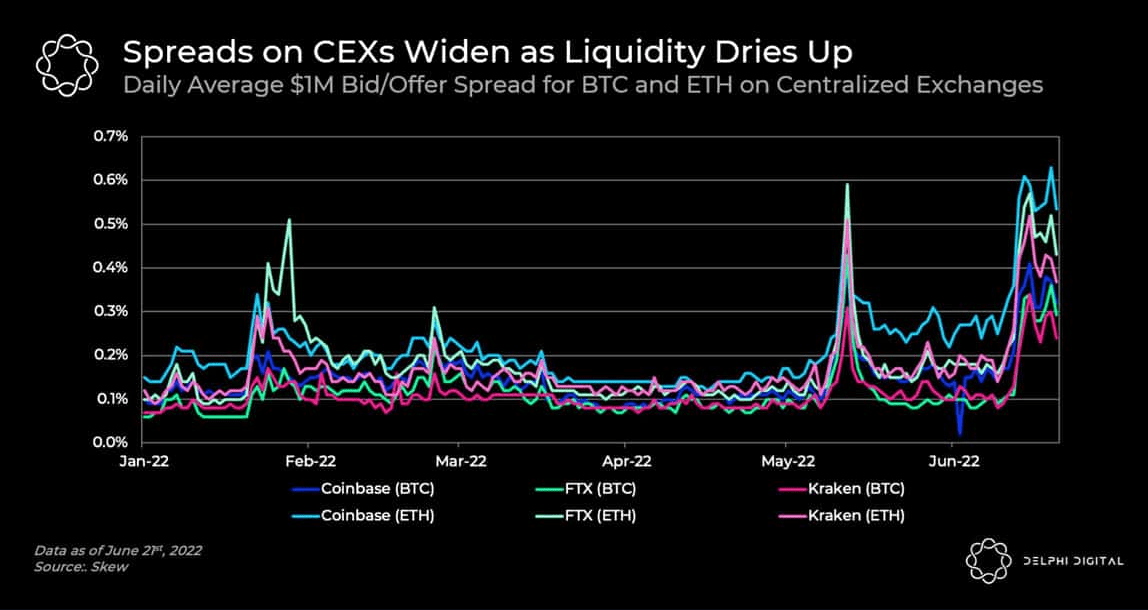
We’ve talked in the past about the fickle nature of liquidity and how when you need it most, it’s usually nowhere to be found. Growing fears over potential insolvencies and further liquidations aren’t helping either.
When we look at the crypto market outside BTC and ETH, the pain is even worse. The total market cap of the public crypto market (ex-BTC and ETH) is currently trading right at its 2018 highs.

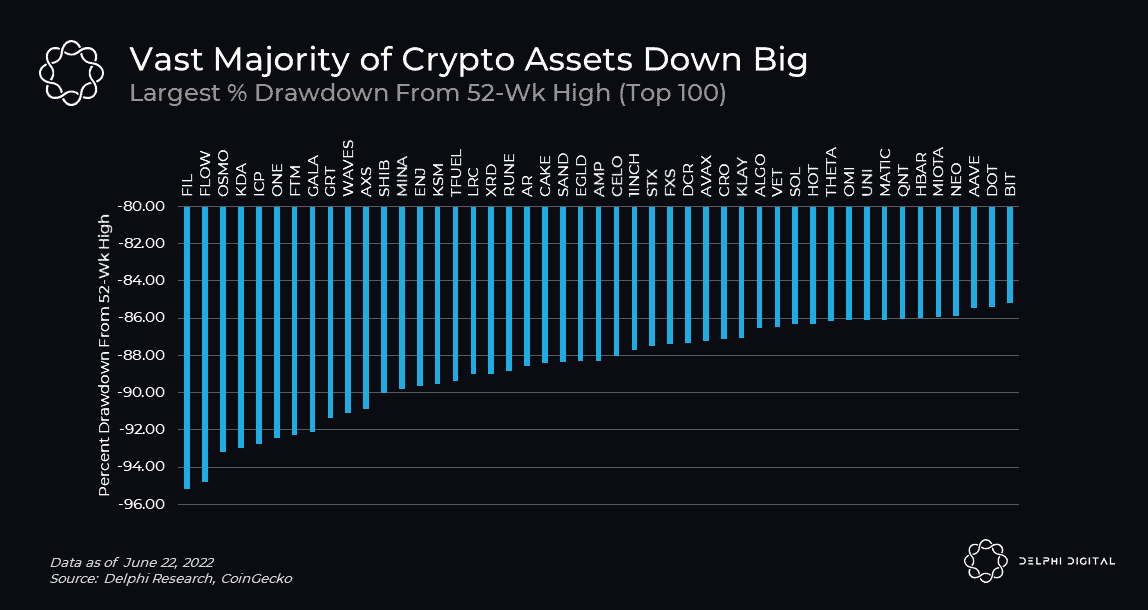
Over 60% of the top 100 largest crypto assets are down at least 80% from their 52-week high. FLOW, OSMO, GRT, AXS, RUNE, AR, SAND, AVAX, SOL, UNI, MATIC, AAVE, and BIT are just some of the names down at least 85% from their 52-week highs.
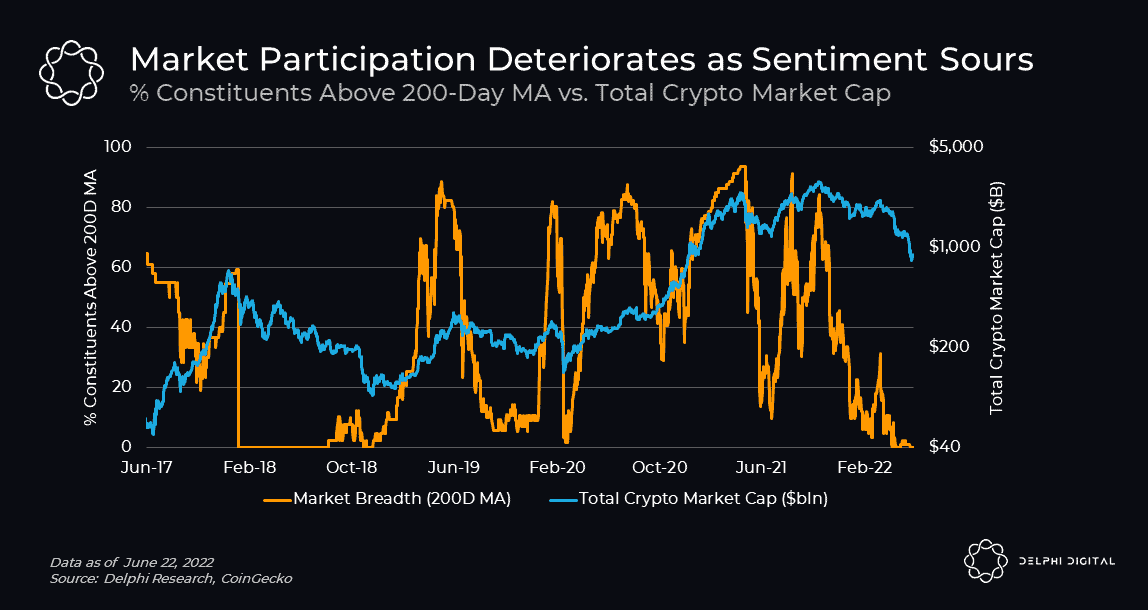
We’ve seen a deterioration in market participation throughout this downtrend. There’s few (if any) crypto assets trading above their 200-day moving average, similar to the environment we saw back in 2018.
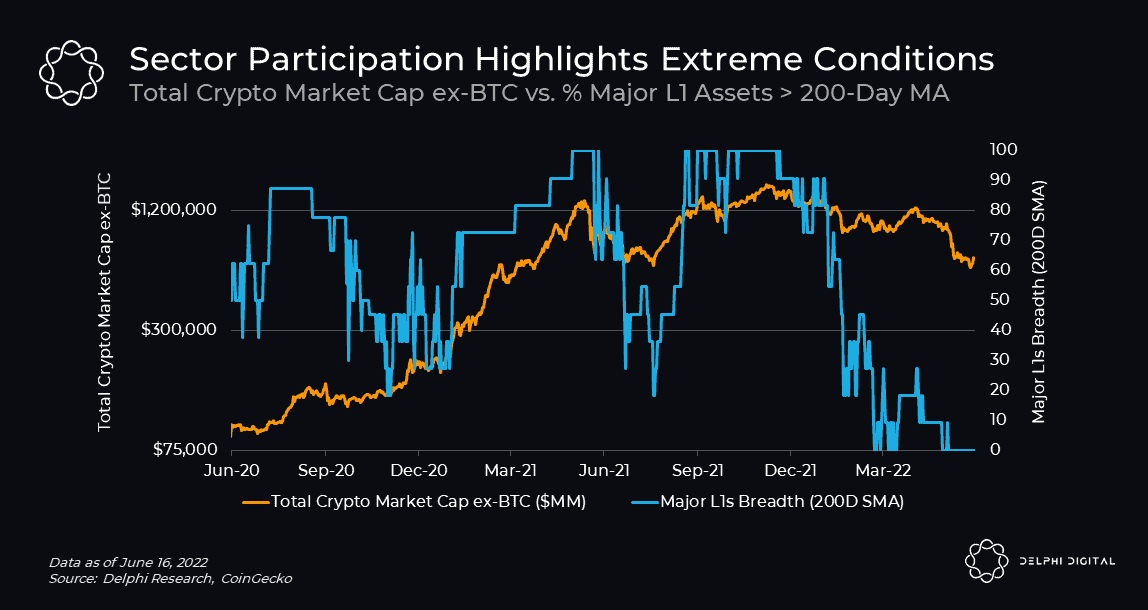
Unsurprisingly, we see similar trends on a sector level as well, confirming today’s extreme conditions. We know not all L1s are created equal but seeing this much distress in the native assets that underpin what nearly everything in crypto is built upon reinforces the notion that there’s bigger forces at play right now (again this is not just a crypto story).
Previous major market bottoms coincided with extreme oversold conditions. One way to track this is looking at prior instances where BTC’s weekly RSI fell below 30, which has only happened twice before (Jan. 2015 and Dec. 2018) prior to last week.
Since market headwinds haven’t been resolved, and likely won’t until later this year, we were looking for another leg lower to push BTC into extreme oversold territory as a sign that capitulation could be near. Last week we witnessed BTC’s 14-week RSI drop below 30 for the first time since December 2018.
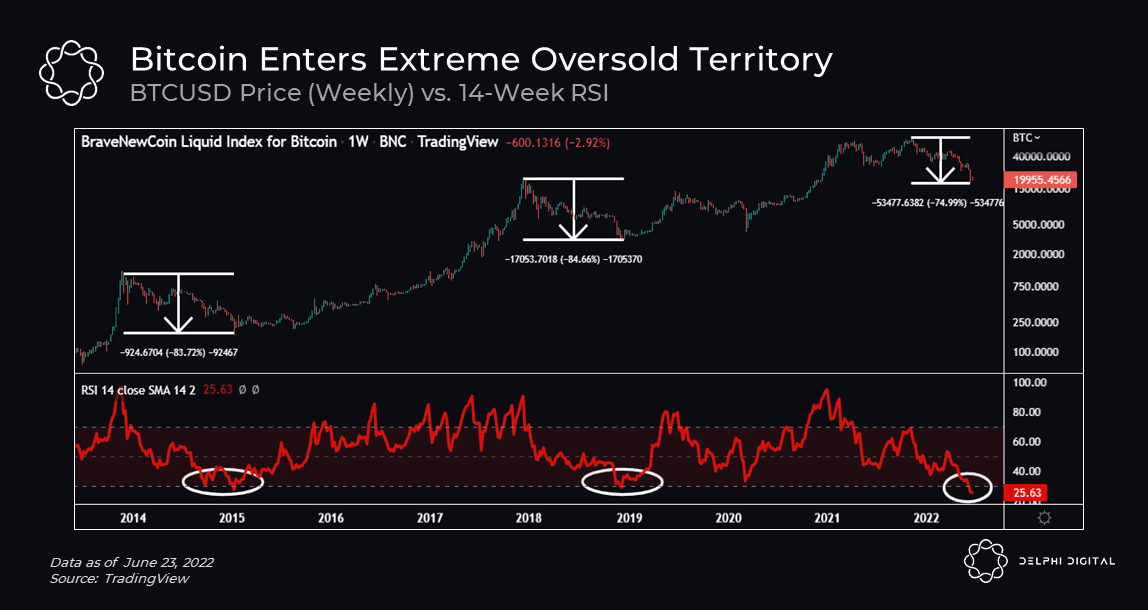
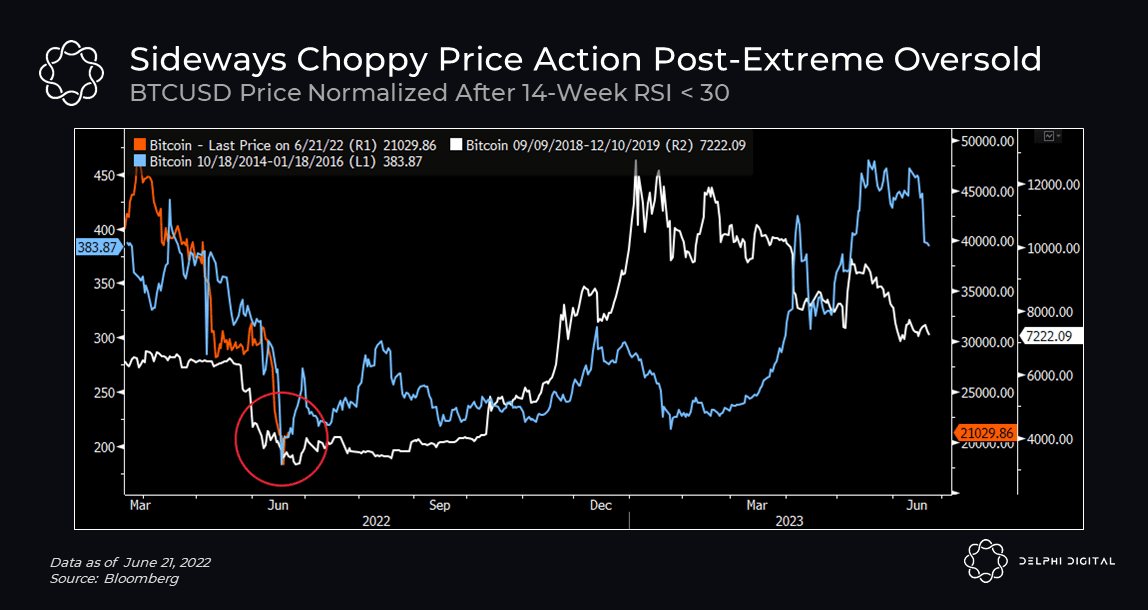
Now just because price has reached extreme oversold levels doesn’t mean a V-shaped recovery is right around the corner. In the prior two instances, BTC traded in a choppy sideways range for several months before finally staging a strong recovery. But for those with a multi-year time horizon looking to accumulate, now wouldn’t be the worst time to slowly start wading back.
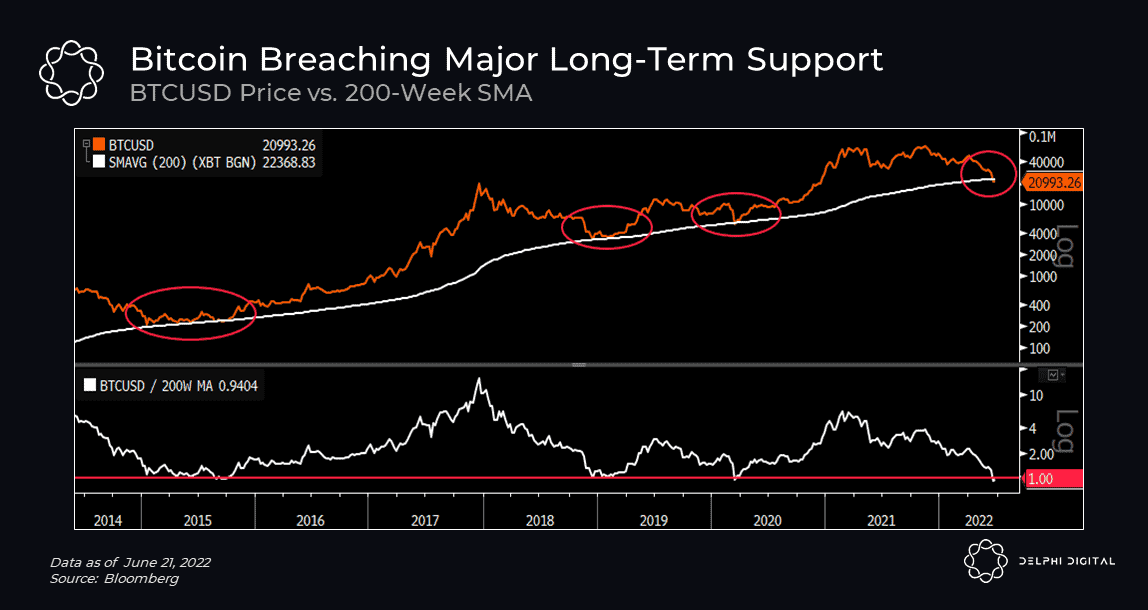
When it comes to bottom indicators, few have been as reliable as the 200-week MA. Prior bear markets typically found a bottom right around this key long-term support level (e.g. January 2015, December 2018, March 2020).
We noted how BTC’s 200-week SMA was ~$22,250 two weeks ago, which implied a 30% drawdown if price were to retest this area. We saw this play out quicker than many expected as BTC broke below its 200-week MA for the first time since March 2020. Bitcoin has only tested this level a few times and historically hasn’t spent more than a few weeks trading below it.
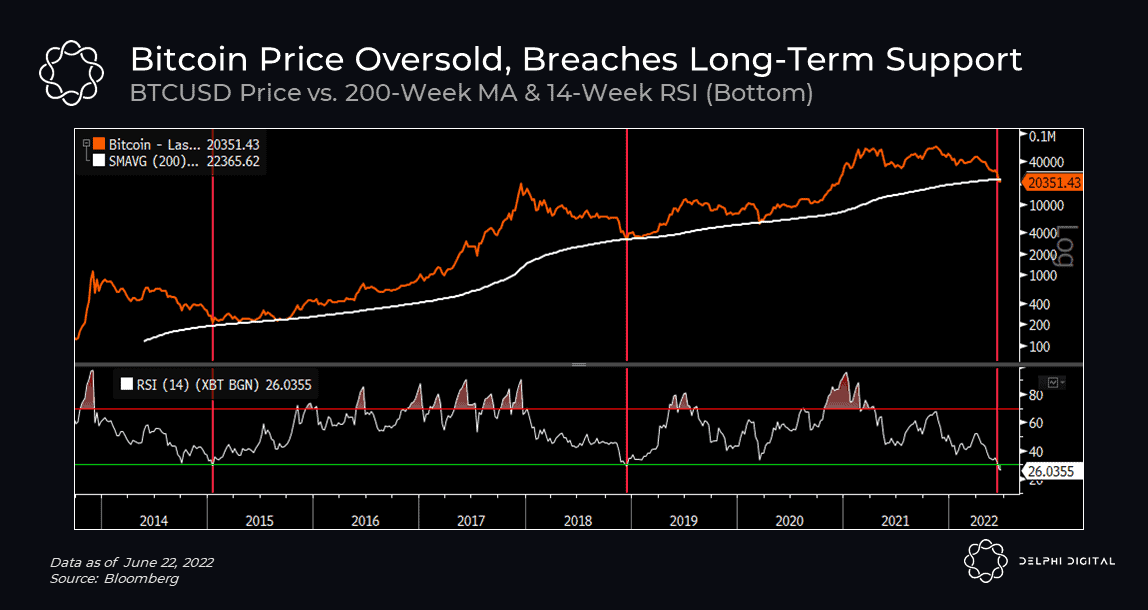
When we combine the two, we see how prior market bottoms were characterized by extreme oversold conditions and a retest of key long-term support levels.
Bearish Sentiment Hits Extremes
Sentiment has reached the lowest levels since the March 2020 market crash, but it isn’t quite as dire as we experienced in the depths of 2018 – at least in our opinion. That tells us we may need to see a bit more pain before sentiment really bottoms out.
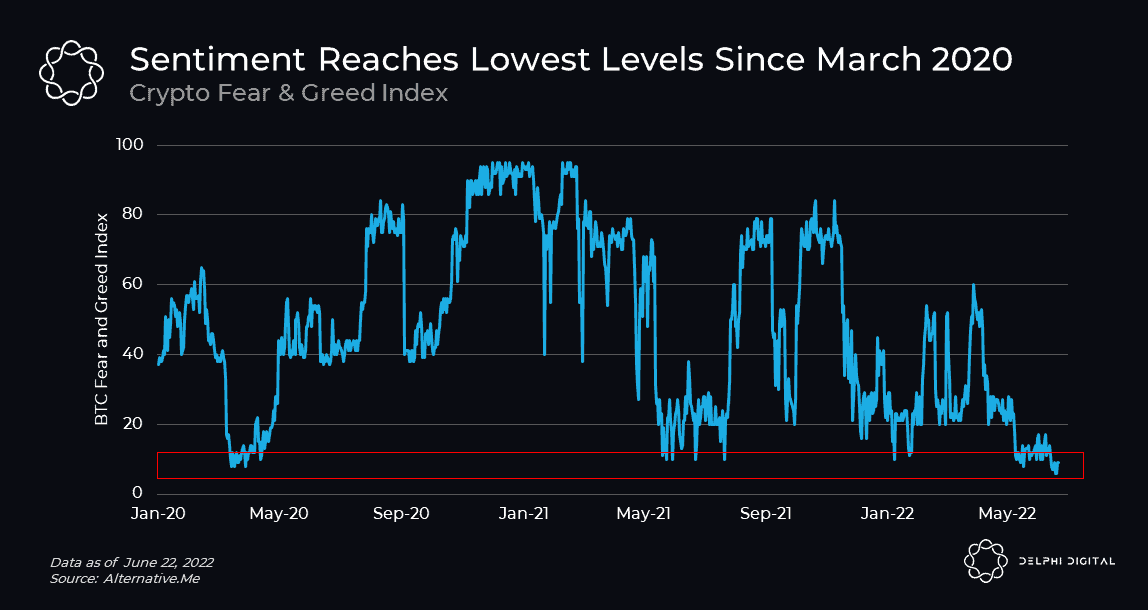
The Crypto Fear & Greed Index is at its lowest point since the COVID crash. It’s a decent proxy but it’s not a pure sentiment gauge since it does take price momentum into account.
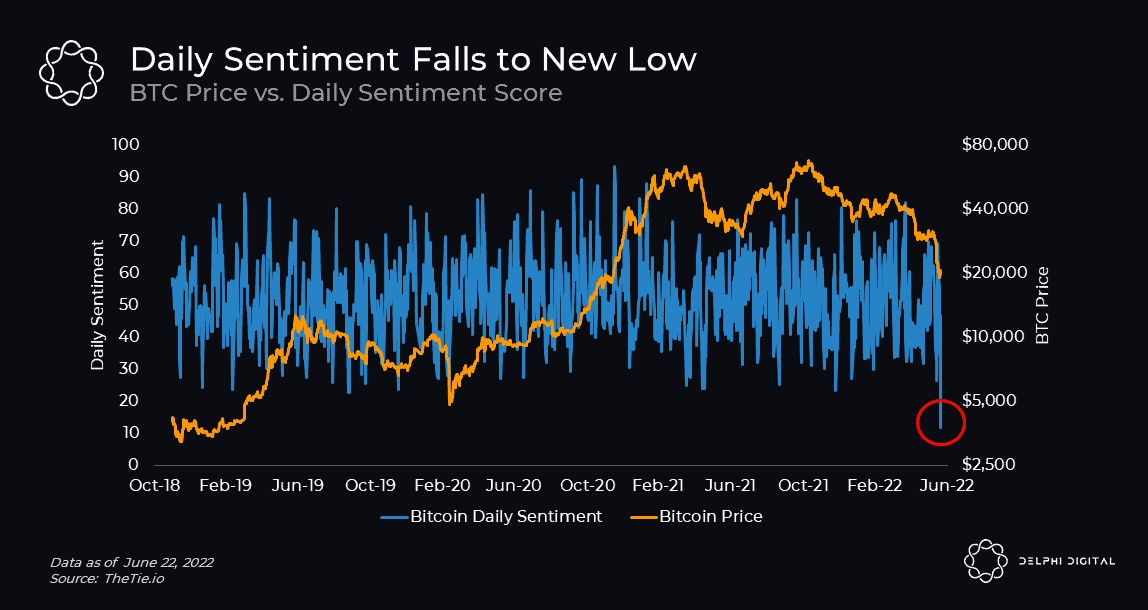
TheTie, an information services provider for digital assets, calculates their own version of a Daily Sentiment score that measures how positive or negative conversations on Twitter are over the last 24 hours compared to the previous 20 days…and that indicator just hit its lowest level for BTC in at least three years since they started calculating it.
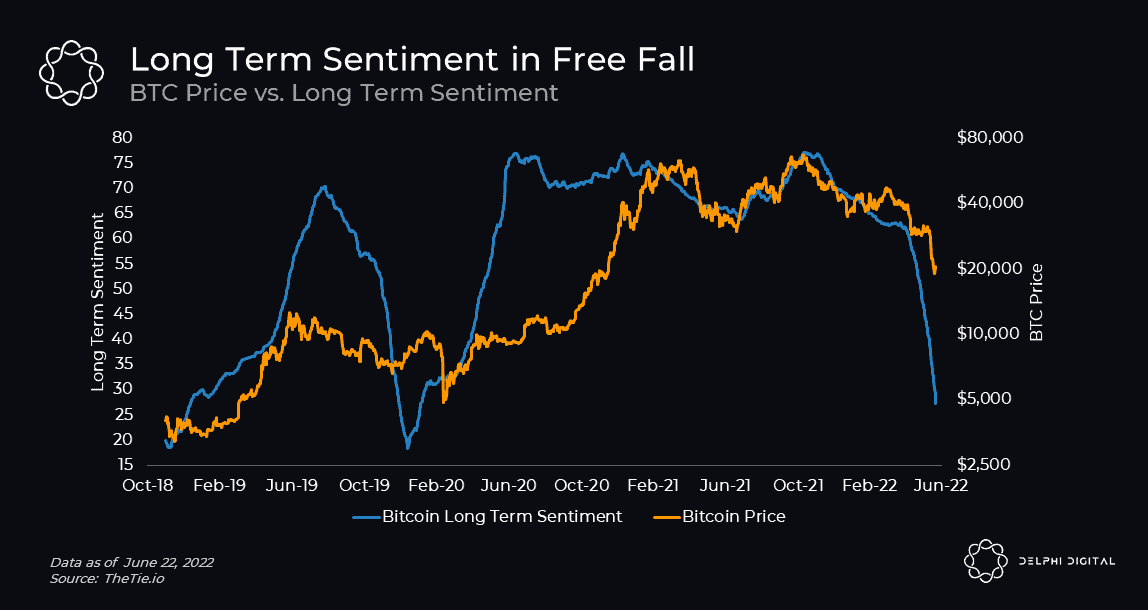
Long Term Sentiment, which measures Twitter sentiment over the last 50 days versus the previous 200 days, is also plummeting.
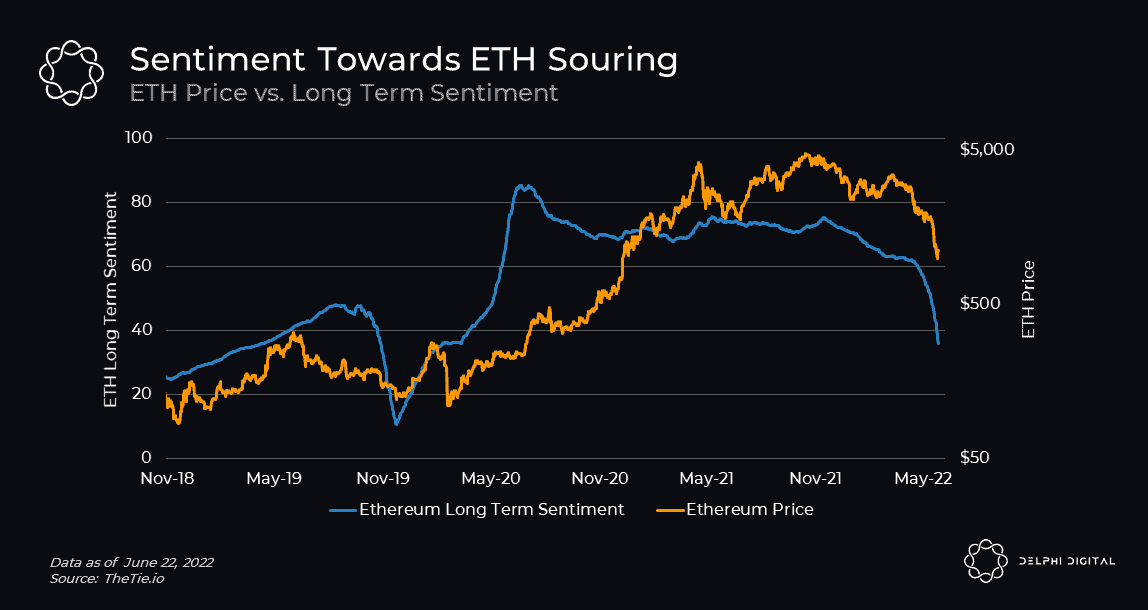
We’re also seeing similar trends for ETH.
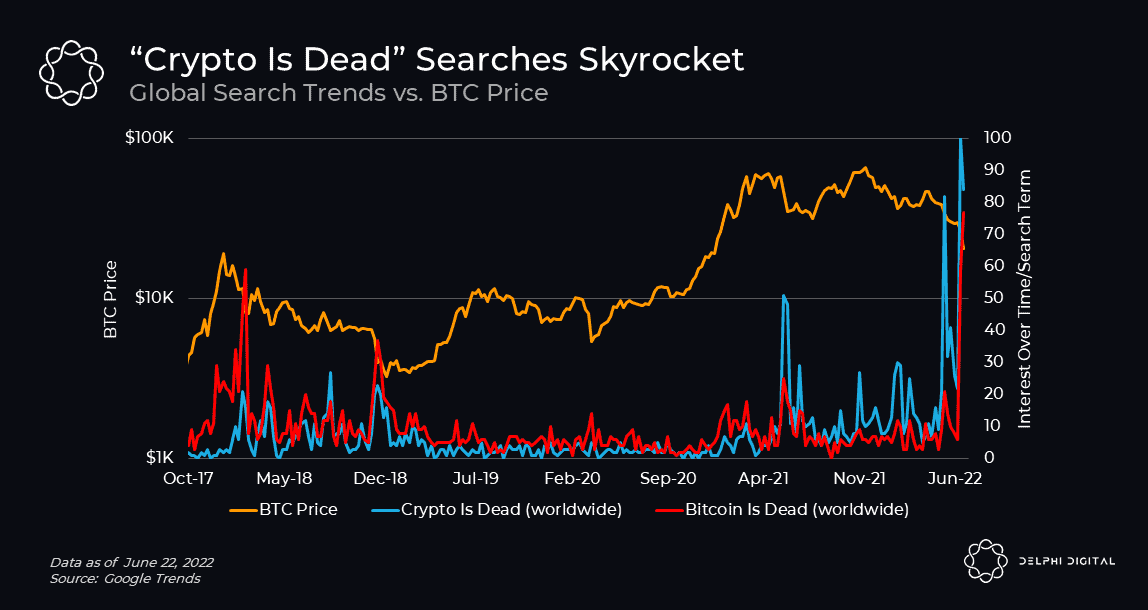
This is usually around the time where people start proclaiming “crypto is dead”, and right on queue the FUD is picking up.
Speculative Unwind – When Capitulation
Crypto is a market driven by speculation. During bull markets, we see an increase in borrowing activity as people look to take advantage of the trend by levering up their bets. This doesn’t just manifest in the form of margin trading and higher open interest, we see it at play with on-chain borrowing too. As asset prices appreciate, the borrowing capacity of the system expands, and that extra leverage gets pumped right back into the market in the form of more demand and more buying power.

This relationship is even clearer when we look at the growth rate of borrowing versus ETH’s price performance.
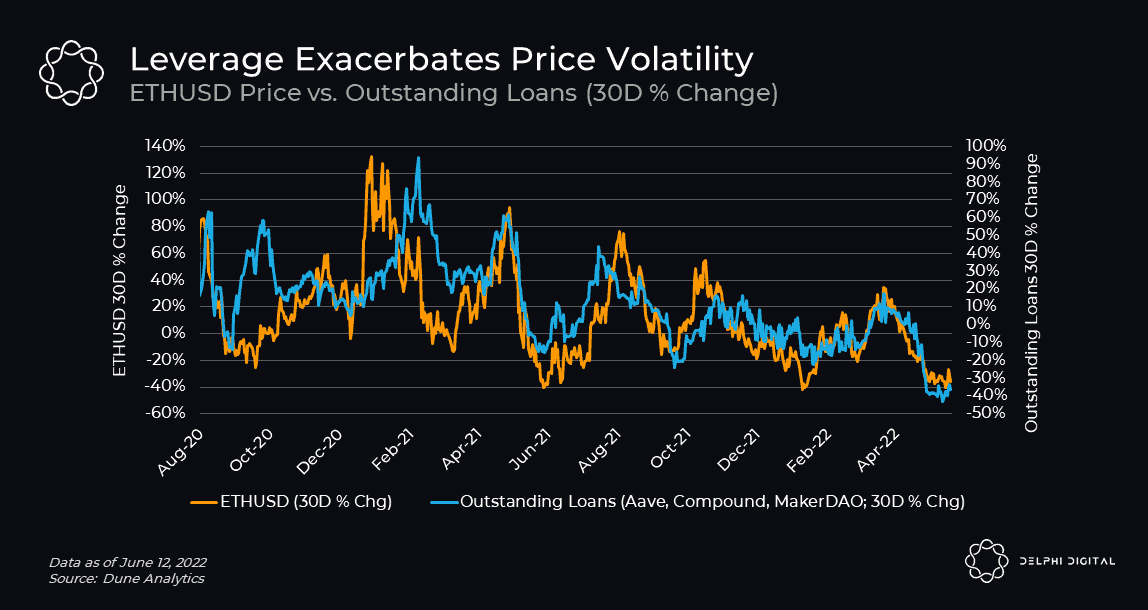
Excessive leverage exacerbates trends in both directions though, and we could argue peak valuations we saw late last year were in many ways artificial because they were propped up by speculative leverage rather than growing organic demand. This market thrives on momentum and reflexivity, both on the way up and on the way down.
We’ve seen a substantial amount of deleveraging across the industry, some voluntary and some driven by rapid price declines triggering forced sellers.
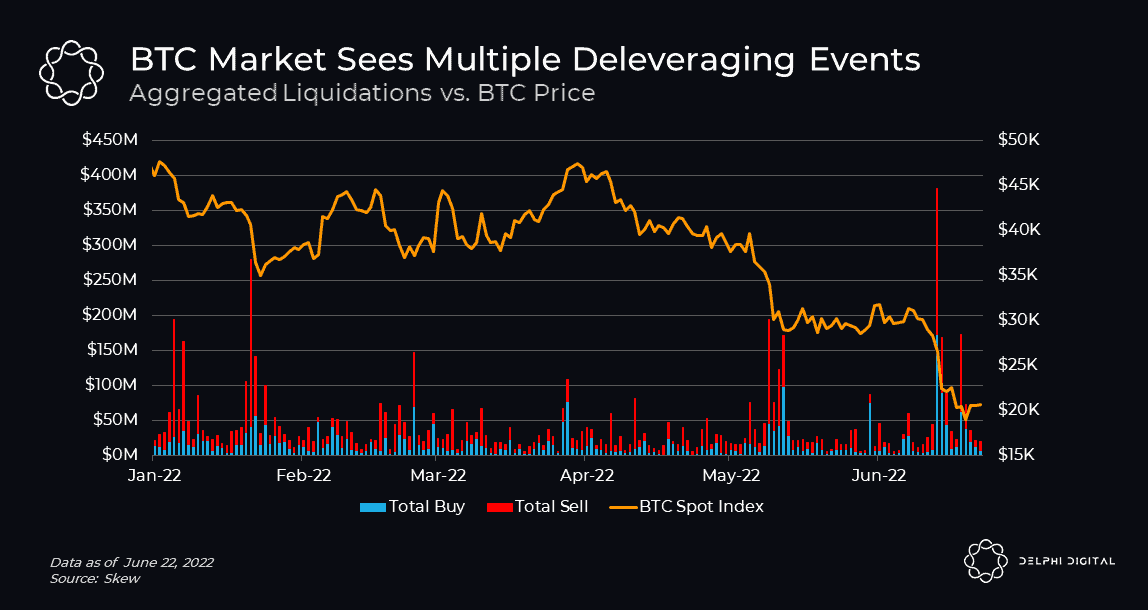
We also saw a series of on-chain liquidations across major lending protocols (Aave, Maker, Compound), which coincided with sharp selloffs in January and May earlier this year.
Coinbase took inventory of some of the latest developments to assess how much forced selling could be left.
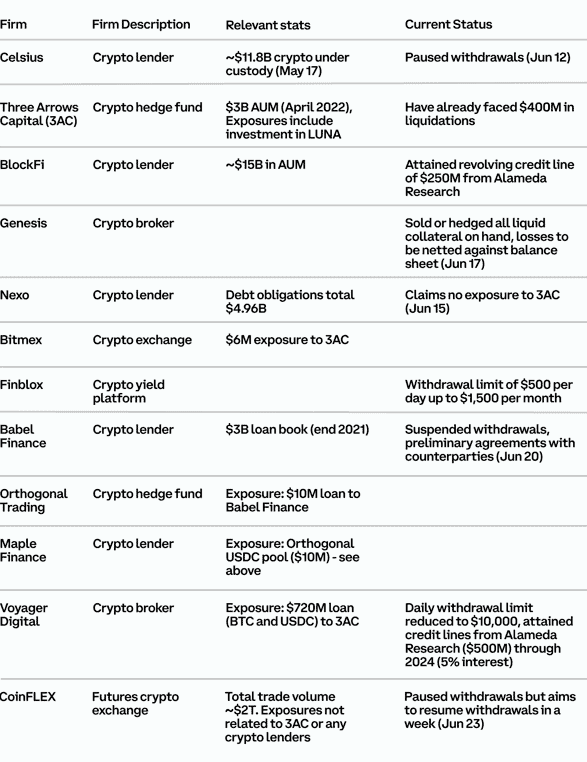
Sources: WSJ, CoinDesk, The Block, Blockworks, Twitter, Bloomberg, The Guardian
The latest selloff has pushed bitcoin’s market price below its realized price, which means we’re at the point where a majority of holders could very likely underwater.

Comparing the ratio of BTC’s market price vs. its realized price relative to the percentage of supply that’s still in profit, we see the latter is now ~50% and closing in on levels last seen during market bottoms.
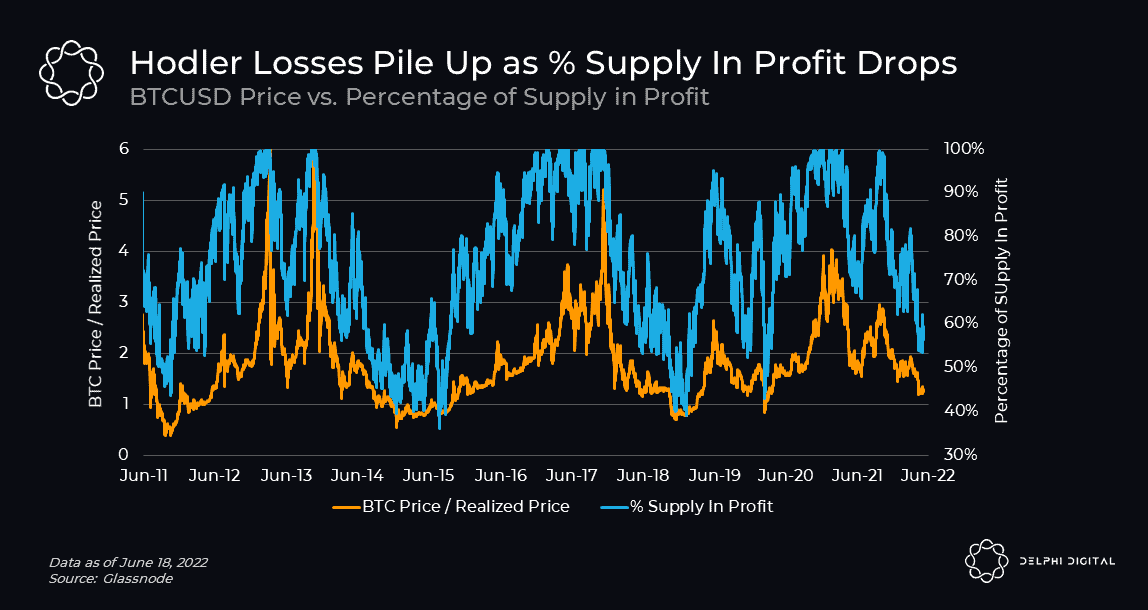
We’ve seen over $15B of “realized loss” on BTC holdings over the last two weeks, according to data provided by Glassnode. Realized Loss measures the total dollar value of all moved coins whose price at their last movement was higher than the price at the current movement. This isn’t a pure measure of financial losses but it highlights how much BTC supply has been exchanged and/or sold in this recent $18-22K range.

Looking at long term hodler behavior, we’re seeing signs of a peak in the percentage of BTC supply that hasn’t moved in at least a year. We typically see prolonged periods of accumulation during bear markets and periods of distribution (long term holders selling) once price recovers and starts its next uptrend.
Each cycle we’ve seen a higher top for this metric, and usually price tends to start bottoming as this metric peaks. However, it isn’t until this indicator starts to roll over before BTC price starts to accelerate and *eventually* break to a new ATH. We’re just starting to see this indicator put in what appears to be a local top.

Macro Still Driving The Struggle Bus
The crypto market is one of the most leveraged bets on global liquidity and accomodative market conditions. Since we’d argue most of the value crypto and web3 technologies will create is still ahead of us, what we’re investing in today is the potential growth that such a future will bring.
When asset prices are going up, and market conditions favor risk taking, BTC and crypto have and will continue to outperform. But when market conditions deteriorate and sentiment shifts away from growth-at-all-costs towards capital preservation and risk management, this market has to take an outsize hit because crypto is filled with growth assets.
At the start of the year, we talked about BTC as the canary in the coal mine for worse things to come for risk assets. The logic was straightforward – crypto and conventional risk assets (e.g. stocks) were both facing similar macro headwinds, and those headwinds were significant. We highlighted how bitcoin tends to do poorly when financial conditions are tightening and how USD strength was one of BTC’s biggest threats (chart below is from that January report).
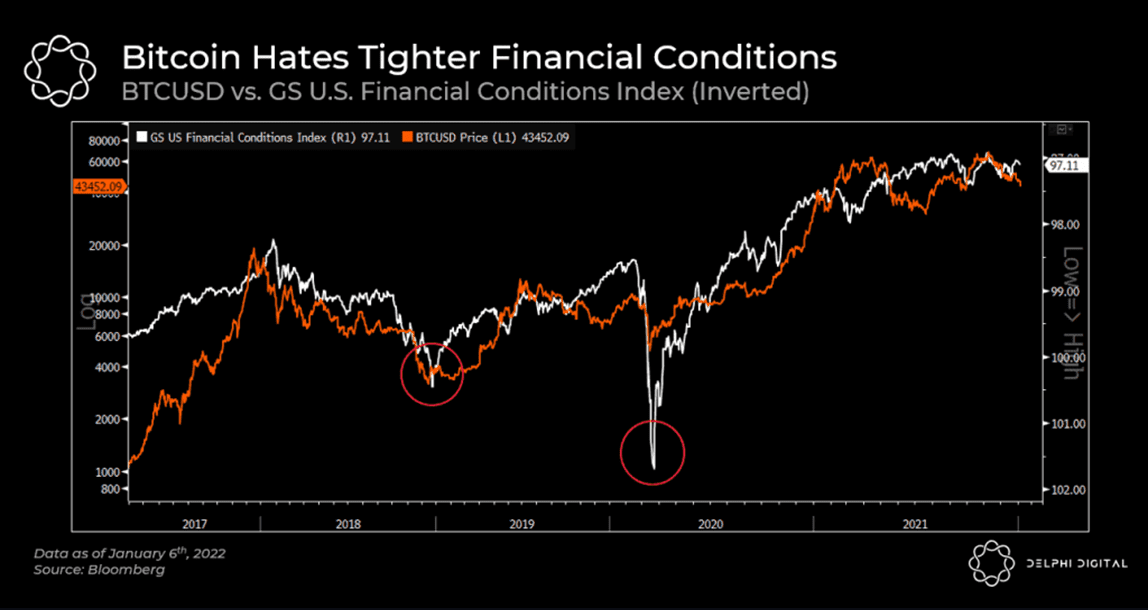
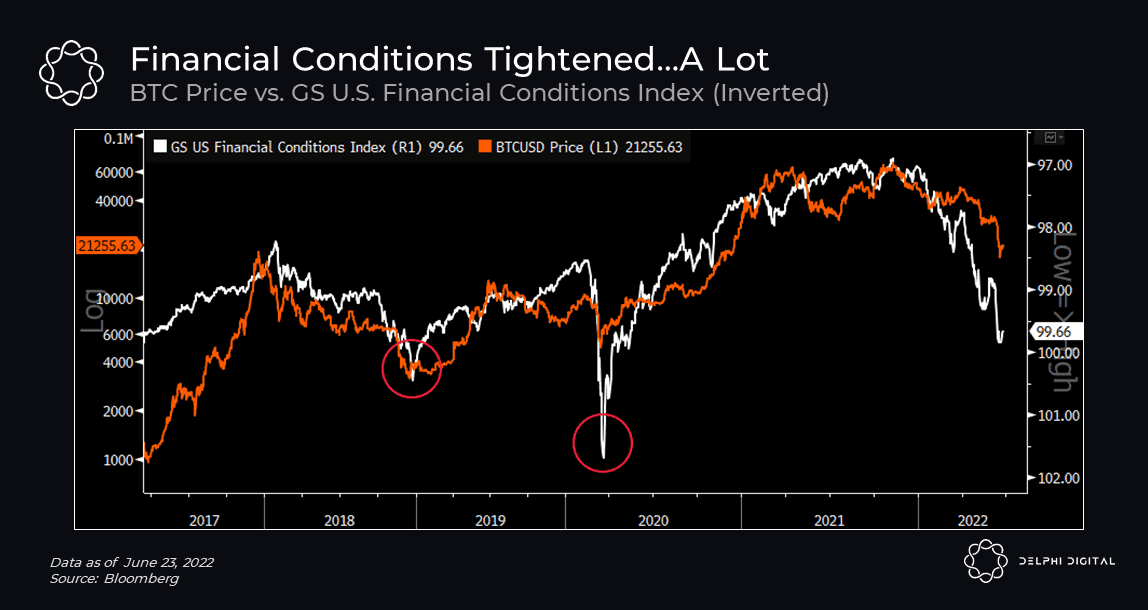
Since then we’ve seen financial conditions tighten at a record pace.
Even as CPI started to accelerate, many were still holding onto the narrative that BTC was an inflation hedge, which is why we explained that consumer price inflation and currency debasement are two sides of the same coin, but their impact on asset prices can differ. At a certain point, higher levels of the former (as measured by indicators like CPI) can have an adverse impact on asset prices as rising consumer prices start to curb spending and eat into savings (let alone speculative investments like crypto). So higher CPI readings wouldn’t necessarily equate to higher asset prices.
Fast forward and we’re seeing this exact dynamic play out. Consumers are feeling the pressure of higher prices, forcing them to dip into their savings to keep up. Retail sales are weaker than expected while the average household is paying over 50% more at the pump compared to this time last year. Transportation is the second largest expense for U.S. households behind housing, so real people are really hurting. And higher energy costs increase the cost to transport everything, which is feeding into higher prices. All this contributes to the growing pressures on consumers, and there’s little end in sight.
Regardless of how bullish we are on crypto long-term, we have to recognize that external macro headwinds are in the driver’s seat right now. We can’t lean on decades of historical data but if this shakes out anything like the 2017-2019 tightening cycle, we are bound to see at least one more big move to the downside.
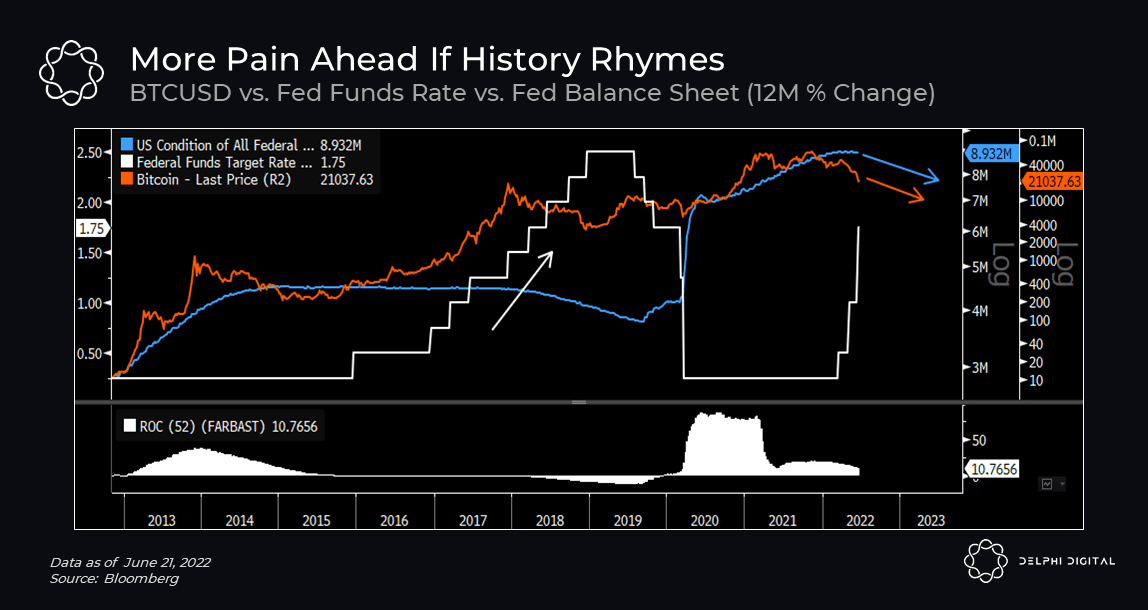
Macro Trend Reversal
In the final weeks of 2018, the Fed started to convey a change in its policy outlook as economic data showed signs of “softening”. This marked the top in the last rate hike cycle, which turned out to be the cycle bottom for BTC and the broader crypto market. Had the Fed continued to hike, BTC and the broader crypto market may not have found a bottom at those levels.
Fast forward to today and there’s similar concerns against a worsening economic backdrop, but given inflation is enemy #1 for policymakers, we likely won’t see a change in stance until we see a deceleration in inflation prints or a serious threat to financial stability. The Fed recognizes there’s only so much they can do with the tools they have, and Powell reiterated that last week by focusing on the side of the equation they can influence: demand.
“…ultimately it comes down to do we think financial conditions are in a place where they’re having the desired effect on the economy? And that desired affect is we’d like to see demand moderating…Those are the things we can affect with our policy tools.” – Chair Powell’s Press Conference (June 15th, 2022)
Unfortunately, it’s becoming clear that the only way to curb inflation is to reign in demand. We know recessions are the best antidote for high inflation, and it’s becoming more apparent that the Fed is willing to toe that line until inflation breaks (in which case demand is impaired) or financial stability is severely at risk. In the meantime, the risk of at least one more sharp selloff in risk assets is rising, and if that happens crypto won’t be isolated.
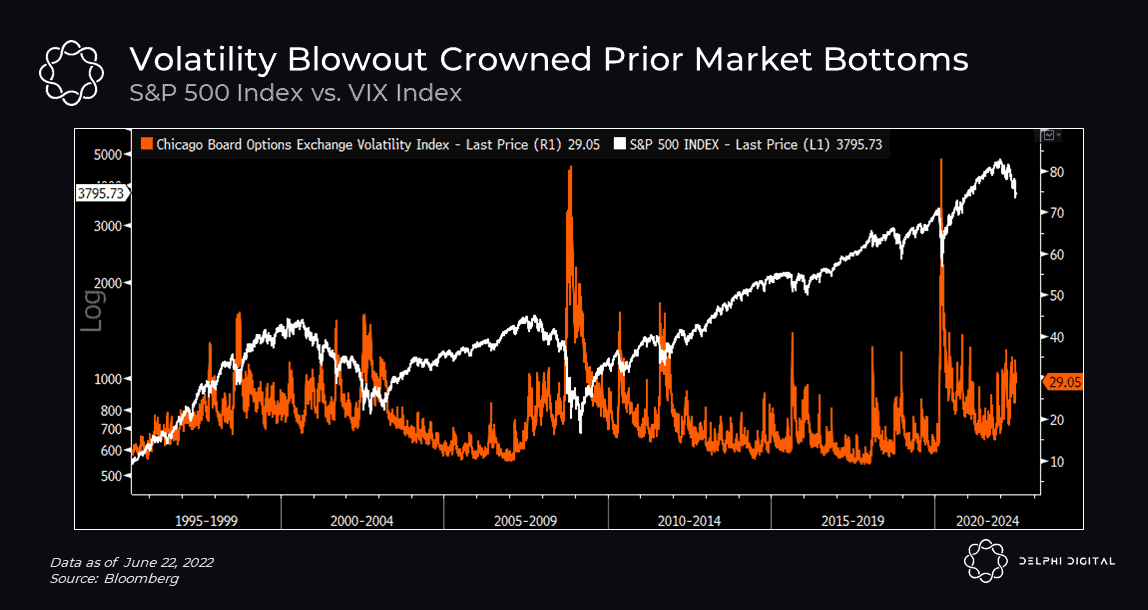
Implied volatility is rising but we haven’t seen the big move that blows out the VIX and gives us confidence that a bottom is in. Sometimes the only way out is through.
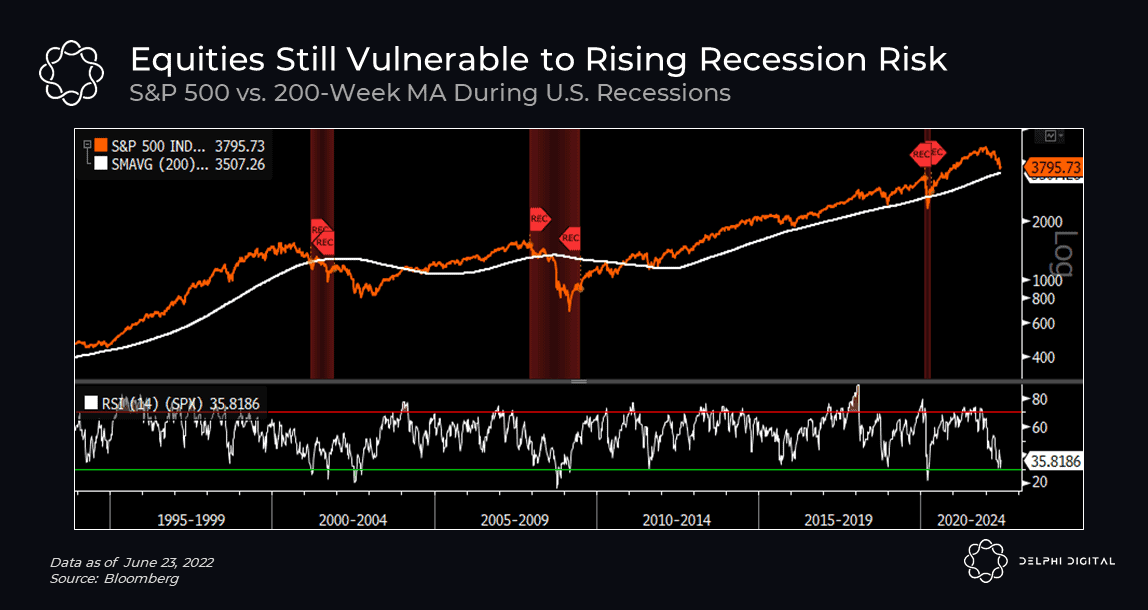
Looking at long-term support levels, the SPX is still trading ~8-9% above its 200-week MA. Assuming current headwinds don’t subside (tighter financial conditions, demand impairment, etc.), if we are heading towards a sharp recession it’s unlikely equities have found a bottom just yet.
The S&P 500 has only breached its 200-week MA a handful of times over the last 40 years. Notably, the instances when prices continued to fall were periods where major prolonged recessions occurred (e.g. 2001, 2008).
The Fed signaled a pause in tightening back in December 2018, which eased one of the major headwinds that kept a lid on risk assets (BTC and crypto included). Recent commentary implies policymakers are monitoring financial stability more closely than they were a few months ago, but we still need to see a material shift in rhetoric and market sentiment before prices can bottom out of this brutal downtrend. Another selloff in risk assets would certainly weigh on crypto markets too, as we’ve seen time and again throughout the year.
We won’t regurgitate all the macro headwinds facing crypto right now (we’ve covered that enough in recent reports) but we highly recommend tuning into the latest episode of our Delphi Disruptors series where Raoul Pal gives a masterclass on his macro framework and the most concerning trends coming to a head for markets (spoiler: this has been spot on so far). Watch the full interview here.
0 Comments