Report Summary
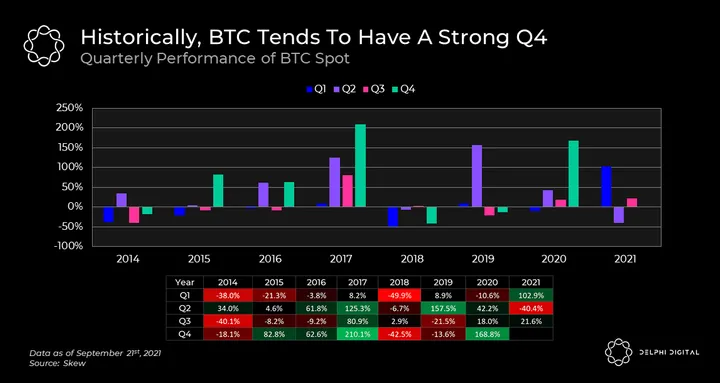
Q1 tends to be a poor quarter for BTC, while Q2 usually brings about positive performance. This year was the opposite, with a stellar Q1 and a poor Q2. But that hasn’t stopped the inevitable September seasonality from throwing a wrench in the bulls’ plans.
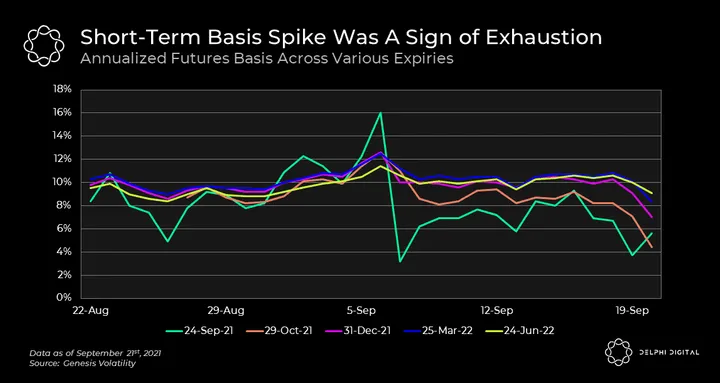
Earlier this month, the Sept. expiring futures contract had run up so much that it was offering investors the best basis opportunity on the market. In hindsight, it’s clear this was a sign that the market was getting overheated in the short-term. Shorts executing basis trades weren’t able to keep up with apes longing Sept. futures contracts.
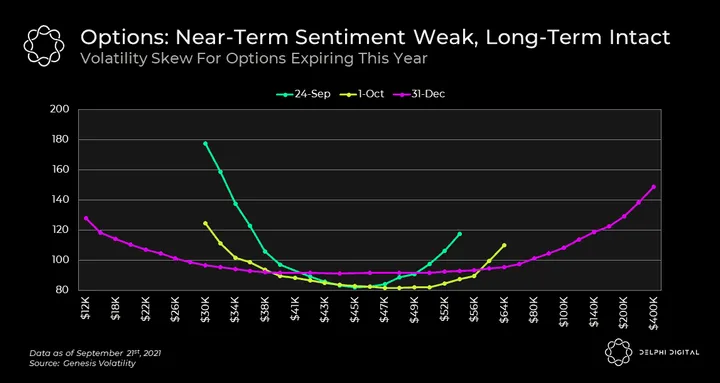
Regarding the volatility skew for options expiring on Dec. 31, the implied volatility of strikes near current price are fairly flat, and the tails are even with a slightly more aggressive skew towards the right. This is almost the perfect skew structure and implies that the option market still has a balanced view on markets over the mid-term.
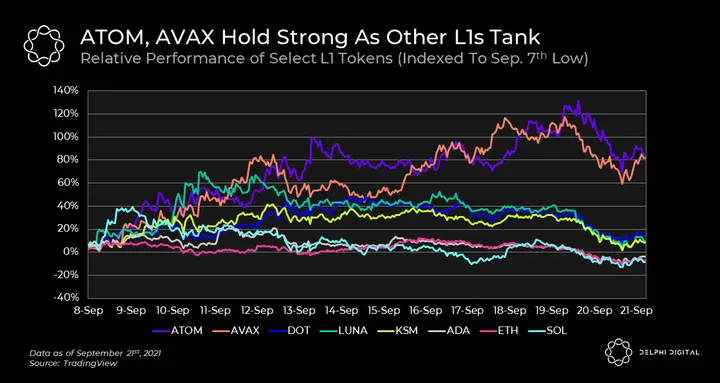
L1 season has taken a short pause in light of recent market movements. With that said, ATOM and AVAX are holding quite well, up 84% and 82%, respectively, since the low on Sep. 7th. SOL is, surprisingly, the worst performing L1 over that time horizon, which is unexpected given the strength it had well into Sept. If this was indeed a dip and not a dead cat bounce, then it wouldn’t be surprising to see ATOM and AVAX continue to lead the L1 sector. Typically, coins that held up strongest during a correction see a commensurate amount of strength as they bounce.
Market Update
Today was yet another dicey day for crypto, with a second (and furious) leg down at midnight UTC. Since then, markets have bounced a bit, but not convincingly enough to suggest the pain is over. A handful of tokens are in the green today, but the vast majority are down as fear cripples investors across the globe.
An Uncertain Market
- Q1 tends to be a poor quarter for BTC, while Q2 usually brings about positive performance. This year was the opposite, with a stellar Q1 and a poor Q2. But that hasn’t stopped the inevitable September seasonality from throwing a wrench in the bulls’ plans.
- On the bright side, Q4 is usually a good quarter for markets after a slow, consolidated Q3. But considering this year deviated from otherwise strong quarterly trends, there is, of course, a possibility that Q4 ends in tears as well.
Not a Deleveraging?
- Looking at the annualized basis across various expiries helps us ascertain how investors are bidding up certain futures. If basis jumps too high, it means a lot of traders are going long on these futures, and few are shorting them to take advantage of the basis trade. The longer out a futures’ expiry is, the higher the futures premium vs. spot, and thus the higher the basis.
- Earlier this month, the Sept. expiring futures contract had run up so much that it was offering investors the best basis opportunity on the market. In hindsight, it’s clear this was a sign that the market was getting overheated in the short-term. Shorts executing basis trades weren’t able to keep up with apes longing Sept. futures contracts.
Volatility and Fear
- This chart is a bit daunting to look at, but fear not. What you’re seeing is the volatility skew — a chart that plots the implied volatility of each strike price across a single options expiry. The perfect volatility skew looks like a smile — low at strikes that are close to current market price with near-even increase in implied volatility as strikes deviate from market price (either higher or lower).
- Look at the Sep. 24 skew. There’s a long tail for strikes lower than market price and a much less aggressive steepening for strike prices higher than market price. On the surface, this looks like calls with a strike price higher than $45K are trading at a low implied volatility (and are thus cheap). But in reality, this structure is askew because nobody is trying to buy out-of-the-money calls, so activity on those strikes is pretty much dead. The Oct. 1 expiry shows a similar structure, albeit not as lopsided. In short, this implies the market is leaning bearish in the short-term.
- Now look at the skew for the Dec. 31 expiry. The implied volatility of strikes near current price are fairly flat, and the tails are quite even with a slightly more aggressive skew towards the right. This is almost the perfect skew structure (note how it looks like a smile) and implies that the option market still has a balanced view on markets over the mid-term.
BTC Spread Widens
- In other news, recent market moves have paused L1 season. With that said, ATOM and AVAX are holding quite well, up 84% and 82%, respectively, since the low on Sep. 7th. SOL is, surprisingly, the worst performing L1 over that time horizon, which is unexpected given the strength it had well into Sept.
- If this was indeed a dip and not a dead cat bounce, as most of us hope, then it wouldn’t be surprising to see ATOM and AVAX continue to lead the L1 sector. Typically, coins that held up strongest during a correction see a commensurate amount of strength as they bounce. If you’re interested in reading more about what’s happening with ATOM and AVAX, check out our recent Institutional posts here – Cosmos and Avalanche.
Notable Tweets
Details on Mars Protocol’s token launch!
Announcing the Mars Protocol lockdrop & token launch
Ignition Phase is imminent ??https://t.co/RkccErQSE6
— Mars Protocol (@mars_protocol) September 21, 2021
Volatile volatility
The weekly ATM vol has jumped from around 65% to 85%. Skew (25d) has also seen a significant uptick as traders prepare for Fridays expiry.
Vol sellers chomping at the bit. ? #BTC pic.twitter.com/6HXqIOzndT
— Deribit (@DeribitExchange) September 21, 2021
Solidity is coming to StarkNet ZK Rollups
Solidity on StarkNet? Yes, StarkNet, the L2 where gas gets cheaper as more people use it, thanks to some STARK magic.
A brief description on the current progress of Warp. tldr; its really close to being finished. @StarkWareLtd @nethermindeth @CairoLang https://t.co/g47QqKRgyg
— Greg Vardy (@0xGreg_) September 21, 2021
0 Comments