Tokens are a financial innovation that confer either ownership or decision-making power to their holders. Token economics refers to the distribution, value accrual mechanism, emission schedule, and sinks associated with a token. A well-designed token economy helps good projects compound their growth by enabling a flywheel to bootstrap usage. If successful, the value generated by the project can be passed on to token holders.
While good token economics can complement good products, success really boils down to the product’s strength. Unsurprisingly, poorly designed token economies don’t help good projects, as they often serve as an added point of friction. Poor token economics with a poor product spells doomsday.
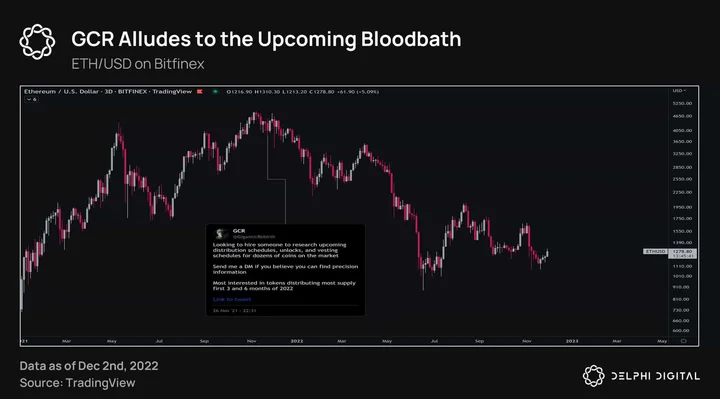
In the case of a good project with bad token economics, the market is bound to take advantage of the situation. GCR is a well-known trader from the last cycle, noted for topping the FTX PNL leaderboard and making several accurate market predictions. Towards the end of the last cycle, GCR was focused on finding coins with massive upcoming unlocks and taking short positions on them to profit when investors sold their unlocked tokens.
The increasing focus on token economics and, more specifically, token unlocks has been attributed to changes in token distributions. Despite the negative connotations, ICOs provided a level playing field where most participants invested in a project at the same cost. However, in the past couple of years, the environment has shifted to one where professional investors have a massive edge – from increased allocations to a significantly lower cost basis versus retail investors. Both market cycles had “fair” and VC-dominant token distributions, but the latter seems more pronounced nowadays.
Understanding the Basics
The gold standard of a successful project is one with a useful, viable product and well-designed token economics. The key to achieving the latter is threading the token into the product to create a strong flywheel that increases the usage of said product. Many projects introduce a token to enrich founders and investors. The token doesn’t accrue value and often provides trivial utility. Though having a well-designed token economy is important, it doesn’t improve a sub-optimal product.
A fair distribution, healthy float level/emission schedule, and utility/value accrual can make for a good token design. Juggling the goals of rapid growth fueled by token incentives and a healthy token economy is a balancing act mastered by only a few projects.
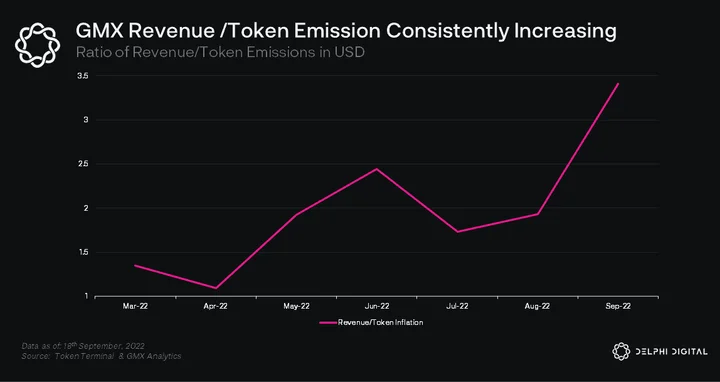
When determining a healthy balance, one metric we like to look at is emission-adjusted revenue. GMX has 2x revenue compared to token emissions. The ratio of revenue/token emissions is consistently trending higher, which suggests that the user base is active, sticky, and less likely to negatively impact the protocol once incentives run out. 30% of the fees from swaps and leveraged trading are distributed to GMX stakers. Having a healthy token distribution adds another point to the tally.
Although a useful metric, emission-adjusted revenue doesn’t reveal the full picture. Uniswap has a great product. There are no token emissions and it is one of the highest revenue-generating projects. Over 60% of the supply has been distributed to the community. But the token doesn’t accrue any value. The ability to participate in the governance process is its sole use case, which obviously leaves much to be desired. But this is proof that a subpar token design doesn’t necessarily hurt a strong product, but it doesn’t help it either.
SUSHI has arguably better token economics than UNI. It has a fair distribution, high float, and value accrual for stakers/holders. In terms of token economics, SUSHI checks all the boxes. The revenue/token emission ratio is quite high, second only to Uniswap, with revenue being 7.6x the dollar value of emissions. Yet, the deteriorating fundamentals have resulted in the ratio trending downwards. The case of SUSHI supports our claim that good token economics cannot make up for the lack of a good, differentiated product.
Complexity associated with token designs has been steadily increasing. Projects have resorted to convoluted tactics to obfuscate the real token and reward distribution. This only works well until people find out, making it difficult to rebuild trust after.
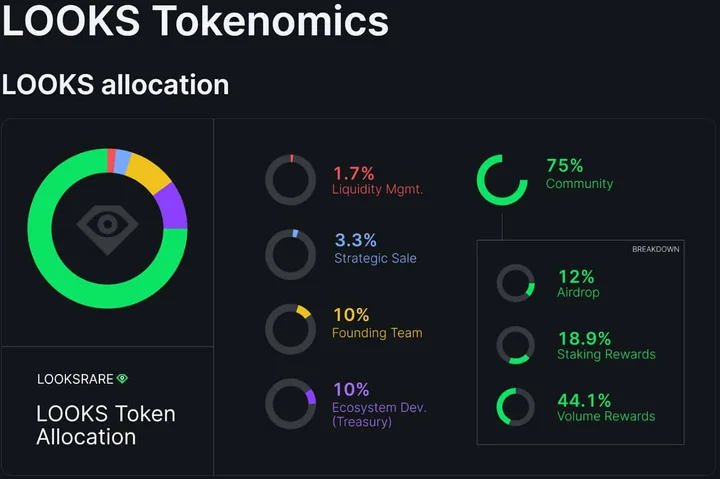
A great example of this is the “community” centric launch of LooksRare. The documentation suggests that 75% of the total token supply is reserved for the community, which has been further broken down into airdrop (12%), staking rewards (18.9%), and volume rewards (44.1%).
Volume rewards refers to the LOOKS tokens distributed to traders on the platform. Every buyer and seller on the platform is compensated with additional tokens (except for private NFT trades). Staking rewards refers to the LOOKS tokens + trading fees collected (in WETH) distributed to stakers.
Stakers are categorized as active stakers and passive stakers (strategic investors, team, and treasury tokens). Active stakers receive both additional LOOKS tokens as well as trading fees. Passive stakers only receive trading fees while their tokens are locked.
Let’s assume that all the tokens released from volume rewards + staking rewards were immediately staked. Then, the share of trading fee rewards going to the strategic investors would be [(33M/# of staked tokens)*volume for that day]. Running this formula from Jan. 10, 2022 to Jul. 15, 2022, we get $38.04M. Even though the strategic sale investors did not benefit by receiving additional LOOKS, they did pocket one-third of the current market cap from passive staking. The team also earned over 20,151 WETH (~$31.5M at the current market price) to date.
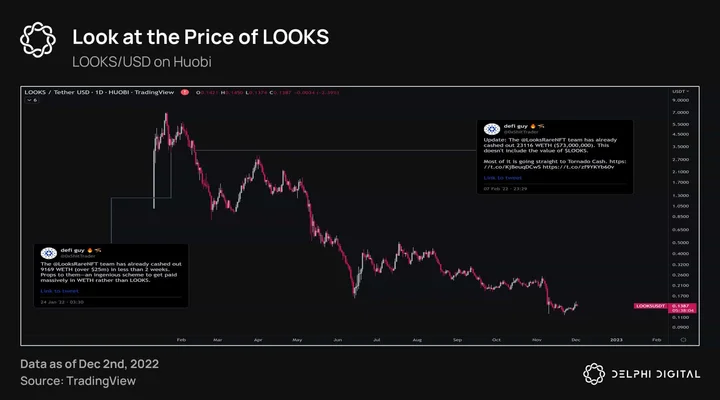
Although the reward distribution was mentioned in the project’s documentation, few people actually go through the documentation. As a result, when the community eventually found out about this, it didn’t bode well for LOOKS. The estimate provided on Twitter wasn’t accurate, as the actual amount was half of what was stated. But the amount mattered much less than the action itself.
Also, the distribution shown in the project’s documentation doesn’t tell the whole story. Once the tokens for investors, the treasury, and team members start unlocking, they also become eligible for rewards in LOOKS.
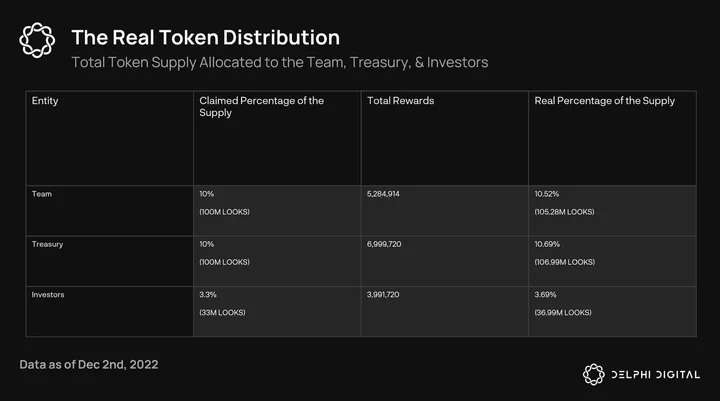
The team, treasury, and investors receive 5.2%, 6.9%, and 12% more tokens – if kept staked until the last day of token emissions – than what is purported in the documentation. Though it isn’t a massive change, it’s non-negligible. The project did not deceive anyone, as all of this information is public, but the convoluted token design makes it difficult for the average holder to understand the true distribution.
Another such case was observed with the recent launch of Aptos. Details regarding the token distribution were made available moments before the listing. At face value, the distribution seems fair, with over 50% of the initial supply allocated to the community and 23.4M APT tokens airdropped to users.
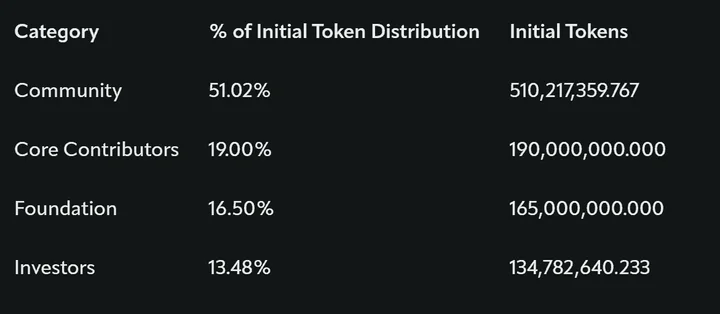
If you scroll down just a bit, you’ll see the community allocation is held by the Aptos Foundation (410,217,359.767M) and Aptos Labs (100,000,000M). The article reads, “This pool of tokens is designated for ecosystem-related items, such as grants, incentives, and other community growth initiatives. These tokens are just held by Aptos and will be distributed over several years.” Although this is standard, it is easy to overlook the staking rewards from token inflation.
Irrespective of locked or unlocked tokens, they can still be staked to earn the staking rewards, which are unlocked by default. Suppose the percentage of staked supply remains constant (currently 82%). In that case, we can come up with estimates of supply expansion using the rate of inflation (7% annually, to be reduced by 1.5% until a terminal rate of 3.5% is reached).
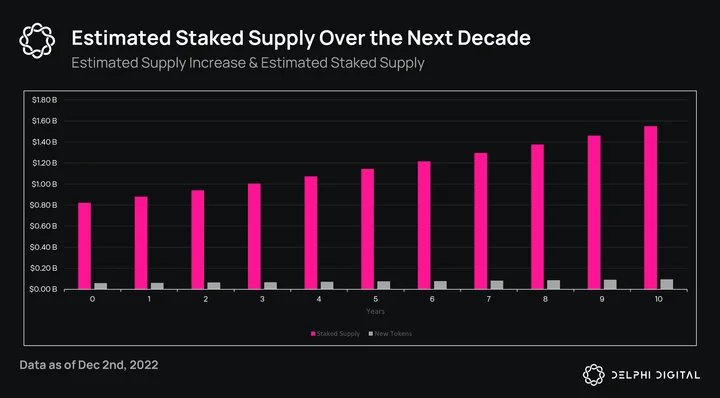
The community makes up only 2.85% of the staked supply, whereas the other stakeholders make up over 97%. Given that the staking rewards are distributed pro rata, the “community” will receive 23.4M APT, which dwarfs in comparison to the 798M+ APT tokens going to stakeholders.
Even though 510M APT tokens are allocated to the community, it is unclear what will happen to the staking rewards earned while they are in Aptos’ custody. If the custodians keep the staking rewards, the true distribution will look significantly different over time as the share of tokens to the community gets constantly diluted. The share of staked tokens weighs on governance voting. Given that Aptos makes up the majority, governance rights become a facade. Although this has not led to any major changes in the price, it is difficult to imagine a scenario where this continues to be the case.
Risk/Reward Profile Associated With Staking
Numerous projects offer additional tokens as a reward for staking (disregarding validator staking) their native token. Imagine this: I stake $100 worth of XYZ tokens with a project that offers an APY of 100%. I get to double my money in a year just by clicking a button. How wonderful, right? Well, not quite.
Often, the staking yield is provided in the form of additional XYZ tokens. If the price of XYZ was $1 when I initially staked, I would get 100 XYZ. After a year, I would have 200 XYZ from the yield I received. But, this comes with a faulty assumption that the token price will remain the same. Given how volatile the crypto markets are, it is quite feasible that the price of XYZ becomes $0.3, in which case my 200 XYZ would now be worth less than my initial dollar value of the investment. A failure in understanding price’s impact on cumulative yield was the primary reason market participants got rinsed during DeFi summer.
The underlying liquidity for the token matters a lot too. Let’s assume that initially, there are only 100k XYZ tokens. In the unlikely scenario that my XYZ tokens trade at $1 a year after I staked, the liquidity for the tokens would more often than not remain the same. If the liquidity pool has $100k of USDT (or equivalent), then even if an individual holds the entire supply, they can only cash out $100k. The price of the token would be decimated. Fast-forward a year. Assuming 100% of the initial supply was staked, the circulating supply would then become 200k XYZ after a year. However, the exit dynamics remain similar. The first few sellers might be able to realize their paper profits, effectively creating a race to the exits.
Lastly, one should consider the R/R of staking vs. merely holding. Most projects, if not all, have some lock-up period associated with their staking mechanism. Keeping everything the same as in the above example, let’s assume that the lock-up period is one week. User A has staked their tokens and user B has not. Unfavorable news breaks out, resulting in the price of XYZ falling by 60%. User B was quick to act and could sell at a slight loss. User A had their tokens stuck in the staking module and could not sell. By the time they received their tokens, the price had fallen 80%, and even though they held double the number of tokens, the net dollar value of the investment was significantly less.
TL;DR: There is no free lunch. Every promise of free money (yield) comes with risk. Often, the risk far outweighs the potential reward.
Fully Diluted Valuations Matter
It is a common theme among crypto participants that fully diluted valuations are irrelevant, and market capitalization is the only metric that matters. Proponents claim that since the tokens are not in circulation, they don’t impact the price. The other side believes that if the market cap is the current size of the public demand, then low-float projects need to increase the public demand for their token by several orders of magnitude to maintain the same price. Therefore, if market cap is a demand metric, then FDV is a supply metric. The ratio of FDV/MC serves as the multiple by which the supply is set to expand.
Solana-based protocols/applications are characterized by a low-float/high FDV, serving as our rationale for picking these particular tokens.
Several projects employ a “low market cap, high FDV” approach to keep the price of tokens elevated. The playbook for these projects is as follows:
- Imagine a project called XYZANA raises $10M from investors at a valuation of $200M. The price per token they receive is $0.05, with a 6-month-long cliff period followed by an unlock over 12 months (team tokens have the same schedule).
- The initial circulating supply is 1% (airdrop, liquidity, rewards, etc.), and there is $20M of public demand (MC). The FDV becomes $2B, the price is $0.5, and investors are up 10x.
- The project begins to gain attention, which translates to another $180M of demand on the secondary market, such that FDV = $20B, the price is $5, and investors are up 100x.
- Fast-forward to 6 months after launch, when the investor and team tokens begin to unlock. In just the next 12 months, the supply will increase by 100x. Investors will sell relentlessly even after an 80% drop, as they are still up 20x. At the same price, the team tokens are worth $1.2B (assuming 30% allocation), and they are happy to pocket a third of it for 18 months of “work.”
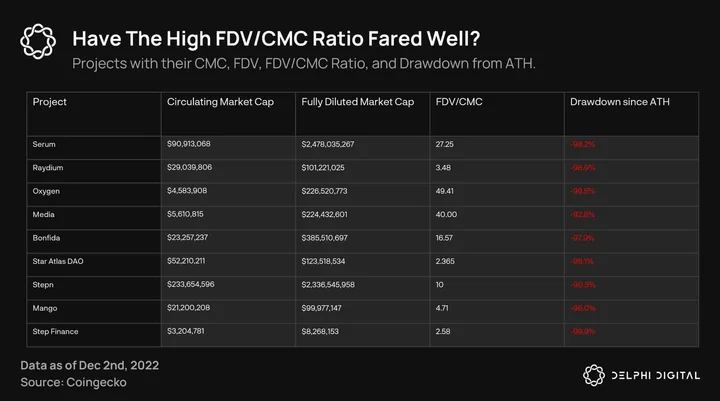
The summary table serves as strong evidence against those who suggest a high FDV is irrelevant. Tokens launched on Solana under the “low market cap, high FDV” playbook supported by many are the best example of this.
FIDA (Bonfida) and GMT (STEPN) were already down 97.9/90.5% while only having 10/6.03% of the supply in circulation. The price per token in the private sale was $0.1 (FIDA) and $0.005 (GMT), which means that the investors will still be selling at a profit (3.8x for FIDA and 75x for GMT).
This model fails to consider that a higher token price, and thus FDV, in the early stages results in more severe future dilution in USD terms.
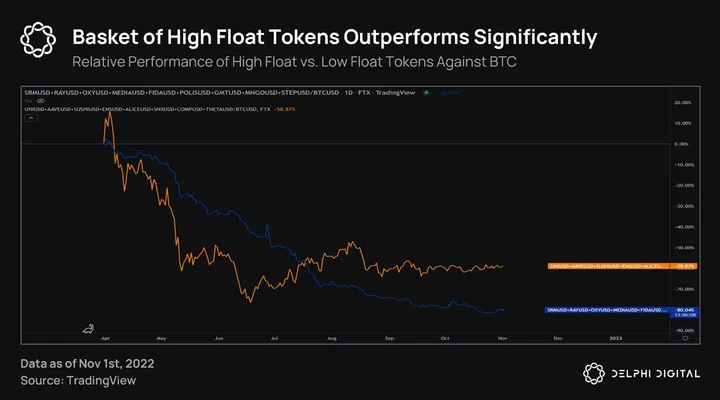
We compared the relative performance of low-float tokens (from the table) with a basket of analogous high-float tokens. We used price action for each asset before the FTX saga to best demonstrate our point while disregarding exogenous factors. Each asset within the basket received equal weight. It’s evident from the chart above that the float does make a difference. While high-float tokens were beaten down over 2022 because of market conditions, they found some respite as the market found temporary footing. However, low-float tokens were not able to move past their massive supply overhang, reflected in the continuous downtrend with no relief.
Market Dynamics That Affect an Unlock
Solana ecosystem tokens were notorious for having low floats. But the low market cap, high FDV curse is prevalent even outside this ecosystem. The effects are not always the same, however. Sometimes tokens experience hefty corrections, and other times tokens are unaffected by the unlock. So how do we decipher which factors play a key role in determining the implications of a token unlock? In this section, we evaluate a few factors that skew the odds of what’s going to happen.
Large Token Unlocks
Undoubtedly, the percentage of supply getting unlocked is a crucial determinant of its impact on the price. When the supply expands in multiples, it becomes challenging to offset its ill effects.
Exhibit A:
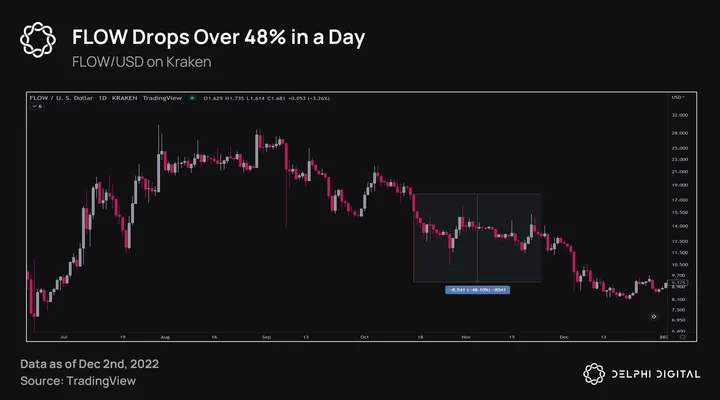
On Oct. 15, 2021, FLOW opened the day at $17.68. By close, it traded at a low of $9.2 (Kraken) and ~$6.1 (CoinList). A maximum of $5.1B in selling pressure could’ve come through as 300M FLOW (6x the circulating supply) tokens were unlocked. The investor allocation accounted for ~75% of the unlocked amount, the team for ~12%, the ecosystem fund for ~2%, and inflation for ~12% (over seven months).
Of course, the price dropped in response to the selling. But, investors were still up over 100x and could have continued selling in profit despite a 48% correction.
Exhibit B:
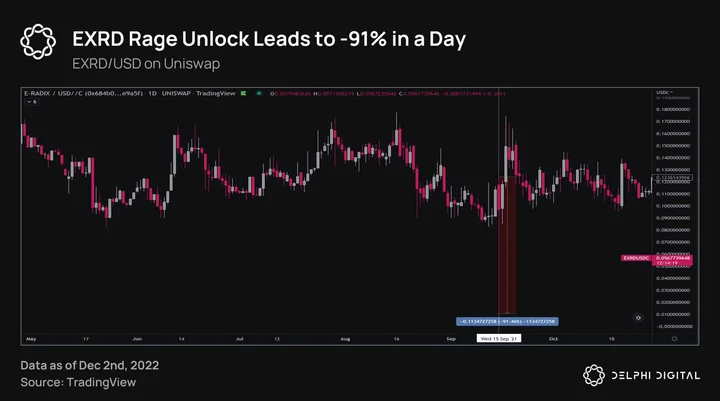
Radix DLT came up with a unique token unlock strategy. For every $0.02 price increase, 5% of the supply would unlock. This would continue until $0.43 was reached, at which point 100% of the supply would be unlocked. The community, over time, grew unhappy with this mechanism. The team responded by unlocking the rest of the supply (excluding the stablecoin reserve) at once.
Before the unlock on Sep. 15, 2021, the circulating supply was ~1.89B, which was then bumped to 9.6B (5x), resulting in a flash crash of over 90%. By the daily close, the price rebounded and was up 800% from the low. EXRD made a new ATH of $0.687 (up 55x from the low).
Liquidity for Illiquid Tokens
In the above examples, the projects did not attempt to create additional liquidity, which would have resulted in a muted impact. There are two sides to generating liquidity:
- A sneaky tactic of creating positive narratives to generate temporary demand just before an unlock.
- The prevalence of OTC markets, allowing investors to take profit without affecting the market price. This simultaneously facilitates a concentration of tokens in the hands of investors with higher conviction.
Exhibit C:
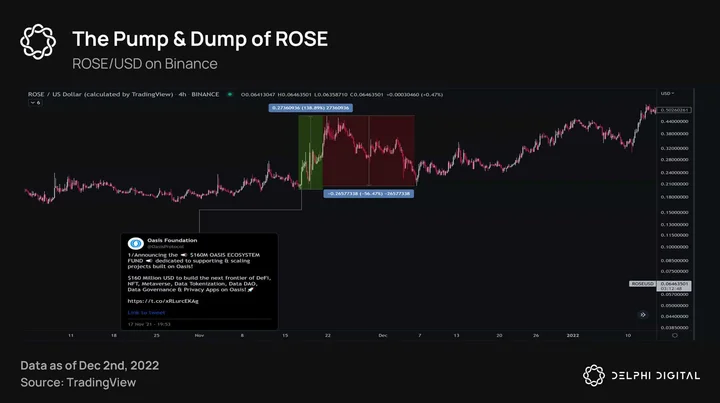
Oasis Network announced a $160M ecosystem fund two days before the supply was set to increase by 133% (1.471B ROSE). Investors accounted for ~51.6%, core contributors for ~20.3%, community and ecosystem for ~27.6%, and strategic partners/reserves for ~0.84%.
Several projects announced an ecosystem fund during that period, resulting in the price appreciation of their tokens. Some projects took advantage of the narrative to create “exit liquidity” for potential sellers to reduce the price impact. In the case of Oasis, unsurprisingly, the price more than doubled leading into the unlock, only to halve in the following days.
Exhibit D:
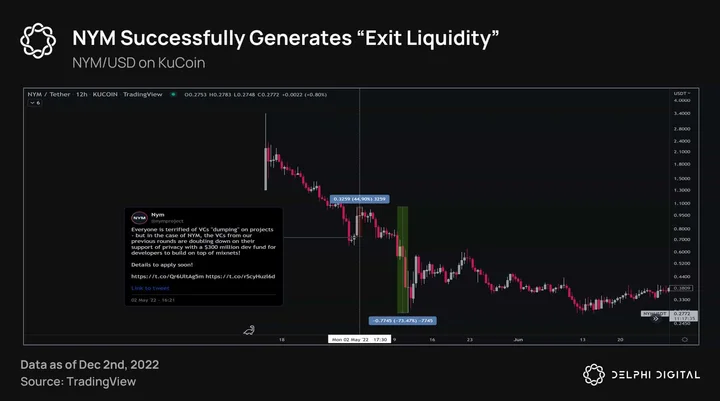
Nym used the same playbook as Oasis, and announced a $300M ecosystem fund a day before the unlock. Out of the 80.75M NYM getting unlocked, investors made up ~60.3% and the team ~30.9%, with the rest going to testnet rewards and mix-mining. As the supply expanded by 2.3x, not only was the “announcement pump” outdone, but the price fell by over 70% in 9 days.
While it’s difficult to factually pinpoint whether the moves by Oasis and Nym were intentional to generate liquidity, the timing sure does give rise to suspicion. So this is something investors should be wary of when they see positive announcements coinciding with upcoming token unlocks.
Exhibit E:
So far, we’ve seen the negative implications of token unlocks.
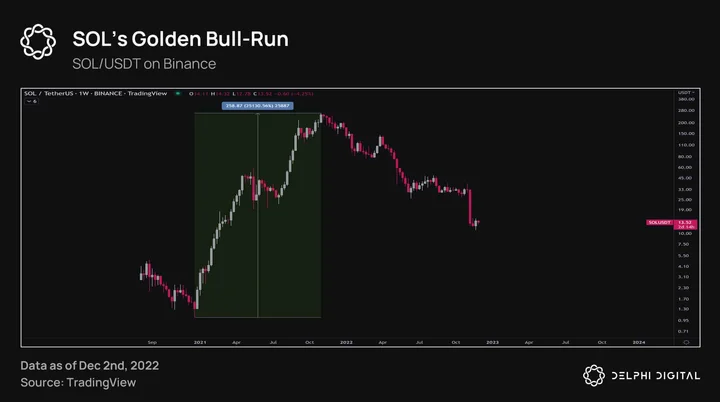
Solana’s token allocation was heavily skewed towards investors and team members, such that only 1.6% of the supply was for the community. The sale price per token ranged from $0.04 (for seed investors) to $0.25 (for strategic investors). It wouldn’t be too outlandish to expect heavy profit-taking, especially when the supply would increase by over 7x with investors up anywhere from 10-60x.
Much to everyone’s dismay, SOL rallied over 25,000% after (from ATL to ATH), and proceeded to outperform pretty much the entire market. The price action defied all logic, but how did this happen? Well, through OTC markets.
A chart shows a project’s price history on the secondary market, but it doesn’t account for OTC markets. OTC markets facilitate the trading of tokens through a dealer network, generally without affecting the secondary market (at least in the short term). SAFTs for Solana were being sold OTC anywhere from a 60-80% discount before the unlock. The fear was bought up by investors with higher conviction, resulting in their cost basis being 2-4x. There was a supply-side shock as less than 2% of tokens (community allocation) were actually in circulation. As price entered its “up-only” regime, the reflexivity kicked in, which paved the way for a ridiculous parabolic advance.
Controlling the majority of an asset’s supply is the closest it gets to having a cheat code in financial markets. As these entities made up half the price equation, supply coming into secondary markets was limited.
Perpetual Futures
The prevalence of perpetual futures for altcoins allows: (i) private investors to hedge their locked tokens, (ii) secondary buyers to hedge exposure before an unlock, and (iii) traders to short in anticipation of a dump.
Exhibit F:
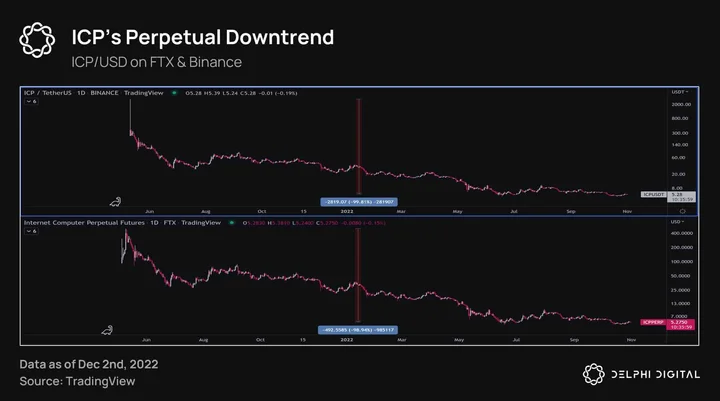
The launch of Internet Computer Protocol was one of the most memorable launches of the last cycle. Perpetual futures for ICP were launched five days before spot trading began across all major exchanges. ICP rallied over 400% coming into the launch, which was synonymous with the network’s genesis, after which its perpetual downtrend commenced.
On May 10, 2021, investors accounted for ~37% of the token supply, founders/team members for ~62%, and the “community” for a measly ~1%. The price per token was $0.035 for seed investors, $0.63 for strategic investors, and $4.17 for presale investors.
The ATH for ICP differs across exchanges, with the Binance spot market sitting at $2,831 and Coinbase at $630. Considering the latter, investors were up 151-18,000x, such that their collective allocation was valued at ~$110B. The founder/team allocation was valued at a whopping ~$183B. It would be unreasonable to not expect some degree of profit-taking. But even after a 90% decline from the top, investors would still be up 14-1,771x – levels at which they could joyfully continue selling.
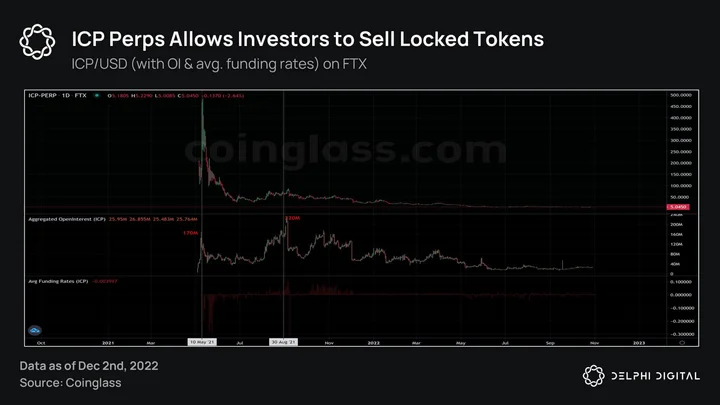
Introducing perpetual futures days before launch allowed investors to hedge their positions and lock in a strong exit price. The $170M in OI coupled with extreme negative funding rates help substantiate the claim. Although speculators would’ve made up a percentage of the OI, it is hard to believe that it amounted to $170M. The lack of required liquidity prevented these entities from fully hedging their locked tokens, but they were able to secure decent profits on partial positions.
Exhibit G:
It is widely believed that most perp listings result in sustained downtrends for tokens. Although partly true, the available liquidity at the beginning is often only enough for investors to hedge a fraction of their locked tokens.
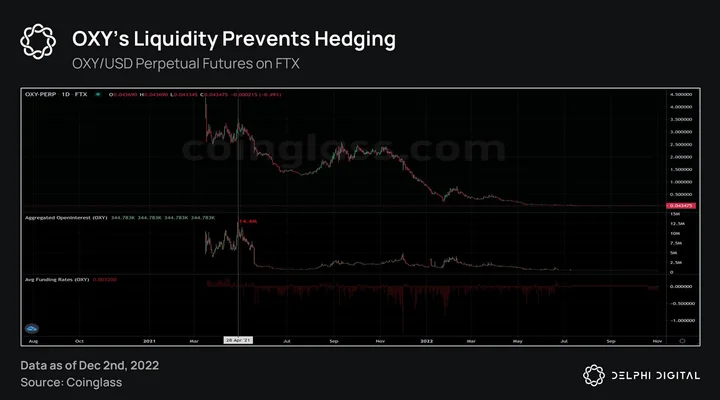
The launch of perps for OXY is a great example. Investors were up about 110x at the highs. Their 1B tokens were worth over $4B. Yet, the OI on the contract never exceeded $14.4M.
The IEO price was $0.10, where most participants were retail. Unsurprisingly, after being up 44x, they realized profits, resulting in a decline. Secondary buyers cut their losses, as they were underwater. It stands to reason that the downtrend was not induced from hedging, but rather a lack of incremental buyers (due to the price appreciation, lack of utility, inflation schedule, price action, etc.) coupled with profit-taking.
Solana had a vibrant OTC market, but this is not the norm. Yet, we still see some tokens performing positively as tokens unlock.
Exhibit H:
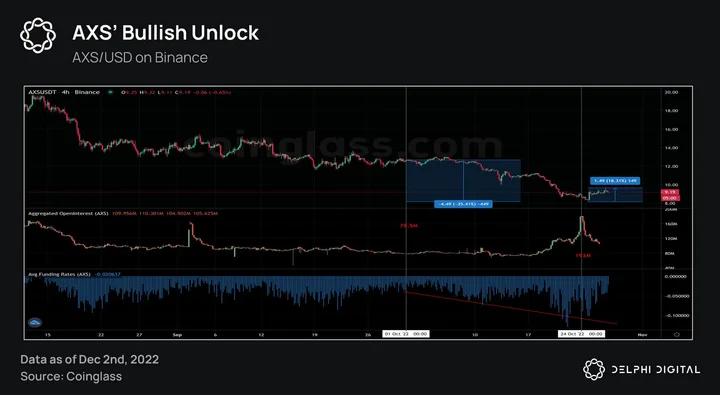
The most recent example that comes to mind is AXS. Roughly 21.5M (~$273M) tokens were expected to hit the market on Oct. 25, 2022. Yet, AXS began significantly underperforming the market after the beginning of the month – well before the unlock date. Investor tokens made up ~9.2%, staking rewards ~22.7%, the team ~26.6%, play-to-earn ~21.9%, ecosystem ~7.8%, and advisors ~11.65%.
The open interest (OI) was range-bound, but the average funding rates were negative. A week before the unlock, OI started skyrocketing, with average funding rates getting aggressively negative. The OI peaked at $193M a day before the unlock and then proceeded to unwind to pre-unlock levels. Simultaneously, the price rose by almost 19%.
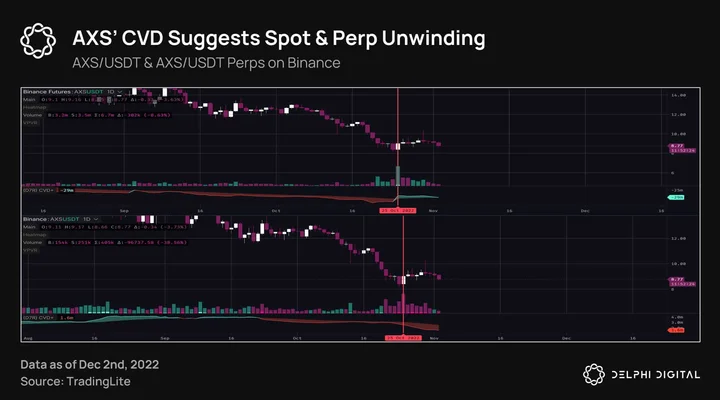
It would be reasonable to assume that entities might’ve partially hedged their AXS through perps and unwound the hedges as they received their tokens. This resulted in prices going up, and speculators playing the trend would have been forced to close. While unwinding their futures positions, the hedgers would’ve unloaded their spot inventory. The cumulative volume delta is an indicator that goes up when a limit sell is filled and, conversely, goes down when a limit buy is filled. The CVD signatures on spot and perp markets on Binance give credence to this theory.
Exhibit I:
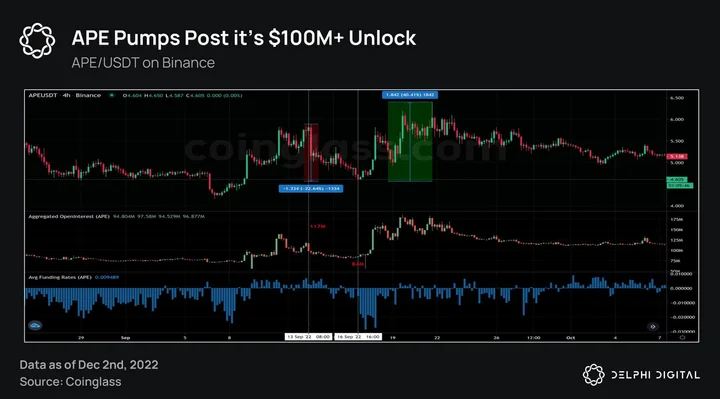
Yuga Labs made an announcement of an announcement leading up to a $100M+ APE coin unlock. The announcement was supposed to be made on Sep. 21, 2022, on Twitter Spaces, but members of the Horizen team fell ill. Their presence was required as they were responsible for building the APE staking protocol. The timing of the delay seemed suspicious to some, given that the market was struggling to shrug off the post-FOMC bloodbath.
~77.3% of the unlocked tokens belonged to the investors and the rest to the treasury. Three days before the unlock, APE fell by over 20%. The OI at the time was $117M. On the unlock day, OI dropped to $84M, and funding started turning negative. The funding flip can be attributed to speculators aggressively shorting in anticipation of the unlock and the market correction. Moments after the unlock, OI started picking up, and APE followed suit by appreciating over 40%.
Like AXS, the unlockers may have hedged their spot positions and, upon unlock, unwound futures while simultaneously selling spot. The lack of a reaction on the day may have pushed the speculators to close their positions willingly or by force, resulting in an uptick. Sidelined participants would’ve piled in, facilitating the “bullish unlock.”
The last four exhibits reiterate the importance of liquidity when it comes to token unlocks. Ample liquidity allows “bullish unlocks” to transpire, although they are merely the priced-in versions of “bearish unlocks.” A lack of liquidity disallows “bullish unlocks,” as locked tokens are not fully-hedged and will be sold when unlocked. These assets still experience a perpetual downtrend thanks to the absence of incremental buyers.
Conclusion
Tokens are an integral part of crypto projects. Over the years, the way token economies are designed has changed considerably, becoming increasingly complex. They can help a good project prosper but fail to uphold inferior products.
Fully diluted valuations do matter, and arguably even more than MCs. The relative performance between a basket of high float vs. low float coins further supports this idea.
Staking the native token for free money sounds good when viewed at face value. But, the situation seems grave when we break down the associated mechanics. Considerations about liquidity, lock-up period, dilution, R/R of staking, etc., become imperative.
With the advent of perpetual futures and the increasing prevalence of OTC markets, understanding a token unlock’s impact becomes complicated. Professional investors cannot always hedge their investments because the liquidity required to do so often doesn’t exist. This puts perpetual downward pressure on the token as it lacks willing incremental buyers. For tokens that possess the required liquidity, the unlocks sometimes result in positive price action – which is usually a priced-in version since the downward impact is felt some time before the actual unlock. Some projects go a step further and generate temporary liquidity through positive news.
Most (if not all) projects distribute their tokens based on a predetermined schedule, often completely unrelated to the project’s health. In certain cases, the incentive for the team and investors to continue developing and growing a project declines. This poses the question: how can we incentivize team members and investors to deliver without reducing their allocation?
One way of doing this would be by opting for milestone-based unlocks instead of time-based unlocks. The impact of the token unlocks wouldn’t change, assuming the liquidity is low or the project suffers the low-float/high FDV curse. But, it does force the team and investors to deliver before receiving their tokens. Delivering a working product would bring in more users and, by extension, more demand. This could potentially translate into a reduced impact from a token unlock. Though this solution is far from the holy grail, it would be difficult to imagine where this structure doesn’t fare better than the current structure.
Milestones can vary depending on the type of project. For example, DeFi projects can have volume and utilization-based milestones; exchanges (both centralized and decentralized) can have user/volume-based milestones; L1s/L2s can have milestones based on user growth, transaction growth, or several other factors. The benchmarks for these milestones can be derived by drawing optimal TVL/MC ratios, user/volume ratios, user/application ratios, etc., from the best-performing protocols of the respective sectors.
Overall, crypto has some work to do in terms of perfecting token structures and creating conditions to lessen the impact of token unlocks. Figuring out which solutions work requires some experimentation from project teams. As the industry matures, teams start to figure out what makes a good token and the market becomes more efficient. We believe token unlocks could stop having such dramatic impacts on price, as dilution will be factored into pricing/valuation models.
Special thanks to Cheryl Ho for designing the cover image for this report and to Ashwath Balakrishnan and Brian McRae for editing.
0 Comments