Report Summary
Curve v2 marks the DEX’s foray into vanilla, unpegged assets. With this upgrade, Curve directly competes with general purpose DEXs like Uniswap, 0x, and others.
While both Uniswap v3 and Curve v2 use concentrated liquidity, the two DEXs approach the idea with vastly different solutions. Each DEX thus has its own merits and drawbacks.
Curve v2 concentrates liquidity around an internal oracle price. Liquidity in a Curve pool is dependent on the spread between the internal oracle price and the point at which liquidity is maximally concentrated.
From our deep data analysis, we were able to unearth some interesting findings — specifically, how Curve v2 actually offers superior execution prices in most situations.
The fee environment of a blockchain plays a key role in determining whether Uniswap or Curve offers the best execution. We confirm this by running simulations in a low fee environment.
As Ethereum’s scaling roadmap comes to fruition, Curve could become a force to reckon with in the broader DEX landscape.
If you would like to mess around with the data yourself, the scripts and csv files have been open-sourced here.
Uniswap v3 vs Curve v2: The Current Score
Uniswap and Curve are two of the largest exchanges within all of crypto. While the two were not always competitors, Curve’s foray into unpegged assets and Uniswap’s move to drop fees for stablecoin trades have turned the two into rivals. With v3, Uniswap moved away from its popular constant product (XYK) liquidity curve to a more dynamic model where LPs decide what price range they want to provide liquidity in. The concept came to be known as “concentrated liquidity,” as it effectively allowed LPs to compress their liquidity curve inside a tighter band.
As a rebuttal, Curve launched its v2 – a similar answer with a different approach. Curve v2 also relies on concentrated liquidity. Except, unlike Uniswap, LPs don’t choose their liquidity range – Curve’s market making algorithm does, enabling a passive LP experience. But let’s not get too deep into that at the moment. We’ll go through the intricacies of both Uniswap and Curve’s designs in due time.
In this piece, we seek to examine Uniswap v3 and Curve v2 with the goal of answering a very important question: can Curve’s passive LP experience offer competitive price execution relative to Uniswap v3’s actively managed liquidity?
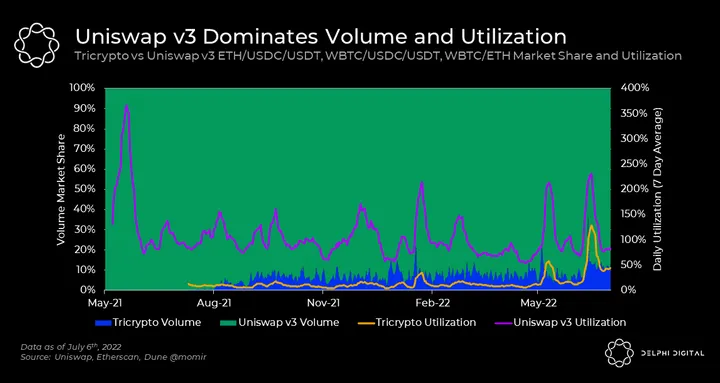
At the moment, Uniswap holds just under 90% market share on ETH and WBTC volume. As a result, it’s been able to attract significantly more liquidity utilization (volume/TVL) than Curve’s Tricrypto (a Curve v2 pool made up of ETH, WBTC, USDT).
Now that we understand the basics and have a sense of who’s leading this market, let’s take a look at how Curve v2 and Uniswap v3 work. Following this, we’ll get to the more interesting stuff. Namely, what the data tells us about Tricrypto’s chance of growing its market share.
Uniswap v3: The Most Dominant DEX in DeFi
As mentioned earlier in this post, Uniswap v3 is the latest iteration of the product, launched on May 5, 2021. The third iteration of Uniswap introduced two improvements that changed the entire DEX landscape:
- Concentrated liquidity – A novel mechanism that allows LPs to manage positions by providing capital in specific price ranges. Contrast this to Uniswap v2, where LPs provided liquidity in a near infinite price range. The benefit of concentrated liquidity is that it allows LPs to express a specific view on the market. It further aids LPs by generating more fees with less capital whenever liquidity is in range (again, in comparison to v2). The downside is that this concentration of liquidity amplifies impermanent losses and requires LPs to actively manage their ranges.
- Customizable fee tiers – While Uniswap v2’s fees are fixed at 30 bps, Uniswap v3 allows for pools with different fee tiers. Lower fee tiers (1 bps and 5 bps) combined with liquidity concentration are good for things like stablecoins and have allowed Uniswap v3 to steal significant stablecoin volume share from Curve. Higher fee tiers (1%) are better for long-tail assets, helping compensate liquidity providers for volatility and thus the impermanent loss risk they take on.
As all things, Uniswap v3’s design comes with some important tradeoffs:
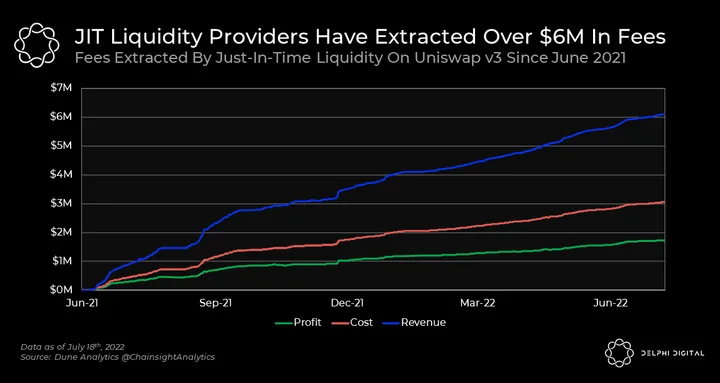
- This design enables “Just-In-Time” or JIT attacks, which steal fees from existing liquidity providers. JIT works as follows: MEV searchers see a large trade waiting to be processed, they add liquidity within a very tight range, service the trade, and then remove liquidity afterward. All within a single block. JIT attacks are arguably the most lucrative risk-adjusted liquidity provision strategy. And this is because they are able to net healthy profits without providing consistent liquidity and thus eliminate the risks other LPs take.
- If you are not an active liquidity provider, it becomes very difficult to be competitive and generate returns.
If you’d like to learn more about Uniswap v3, you can read our previous coverage here and here. We also recommend 0xfbifemboy’s research on Uniswap v3 liquidity dynamics. To learn more about impermanent loss in Uniswap v3, you can peep this research paper.
Curve v2: A Truly Automated Market Maker
While Uniswap focused on being a general purpose DEX for all assets, Curve started out with a very specific focus – pegged assets. Curve intended to build an extremely efficient DEX to trade stablecoins and liquid derivatives. And they were very successful in doing this. The best-known output of Curve’s stablecoin dominance is 3CRV, an LP token that consists of the 3 most popular stablecoins – USDC, DAI, and USDT.
After many rumors and much waiting, Curve v2 was launched on Jun. 9, 2021. This marked Curve’s entry as a general purpose DEX with functionality to support volatile, multi-asset pools. The first pool was called Tricrypto – a pool consisting of ETH, WBTC, and USDT. We can best describe Curve v2 as an AMM that attempts to mimic the behavior of order book-based market-makers without sacrificing the passive LP experience.
Here’s a high-level review of Curve v2’s key design choices vs Uniswap v3.
- Automatic Concentrated Liquidity – Instead of following Uniswap’s path of allowing LPs to express their view on markets by providing liquidity within any price range, Curve v2 enables automatic liquidity concentration around an internal oracle price, which is a moving average of all trades that occur in the pool. Curve v2 uses dynamic fees that increase during volatility to compensate for impermanent loss incurred by liquidity providers. This is similar to how traditional market makers increase spreads during volatility.
- Optimizing for Passive Liquidity – By preserving LP fungibility, Curve v2 retains the “lazy” liquidity provision experience. This is great for unsophisticated LPs but comes at the expense of eliminating price range flexibility for professional/active market makers. This fungibility also mitigates the JIT attacks Uniswap LPs are experiencing.
- Customized Pools – While Curve v2 does not allow liquidity providers to micromanage positions within specific price ranges like in Uniswap v3, Curve v2 offers in-depth customization in the form of pool creation. The impetus behind this design is to accommodate assets of varying volatility without sacrificing the fungibility of liquidity positions.
Understanding the intricacies of Curve v2 is no simple task. Thankfully, examples are a great way of simplifying complex concepts. Let’s illustrate how Curve v2 works using data from the ETH/USDT pair in Tricrypto on Jun. 8, 2022 – a particularly volatile day.
But before that, there are some terms that are critical to understanding how Curve v2 functions:
- Purple Line = “Price Scale”: this is where liquidity is maximally concentrated.
- Green Dots = “Trades”: trades that occurred within Tricrypto.
- Red Line = “Internal Oracle”: exponential moving average of the pair price.
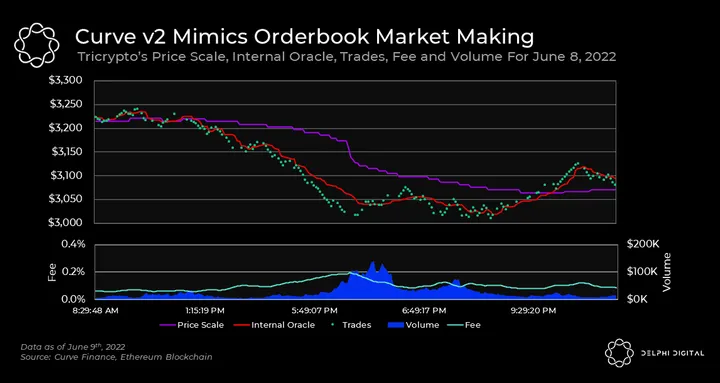
When the spread between the price scale (where liquidity is) and the internal oracle (where liquidity is in equilibrium) widens, it represents increased volatility. In response to this, the Tricrypto pool dynamically raises fees. This is akin to increasing the bid-ask spread, which is what traditional market makers do during volatile periods.
We can see that Tricrypto is constantly re-concentrating liquidity towards the internal oracle, but what determines the frequency and magnitude of these re-pegs?
Every time a trade occurs, Curve v2 will measure the difference between the price scale and the internal oracle. It will move the price scale if, and only if, the losses from re-pegging can be offset by at least half of the pools profits from fees. To save on computational costs, some additional parameters ensure that this process does not happen too often or result in changes that are too small.
Why does re-pegging have a cost? Well, changing the price scale results in realizing some of the IL that has accrued since the last re-peg. You can observe that Tricrypto re-pegs more frequently during times of high volume, as more accrued fees can offset realized IL.
Note: LPs are still exposed to the remaining “unrealized” IL that has accrued prior to a re-peg, so IL has not been completely eliminated by Curve v2.
This mechanism births a bonding curve that is very capital efficient when spot prices are close to the current price scale, and slowly degrades to behaving like an X*Y=K AMM as prices move away from the price scale. While this represents significantly increased capital efficiency in most scenarios, this mechanism does open up edge cases where Tricrypto’s liquidity can get “stuck”. If spot prices move away from the price scale fast enough, without collecting sufficient fees to justify a repegging, the pool (as mentioned before) degrades to offering slightly worse execution than Uni v2. It will remain that way until enough fees can be collected to justify a re-pegging, or the price naturally moves back to equilibrium.
When compared to Uniswap v2 and v3, the Curve v2 implementation is extremely complex. This can be very intimidating for pool creators to use as there are 10 parameters to set up a pool.

While there are many parameters here, it’s not ideal to go through all of them. Instead, we will briefly touch upon the Amplification Coefficient and Gamma, which are two of the most important parameters that shape a market’s bonding curve.
- Amplification Coefficient (A) – This parameter dictates the flatness of the center of the bonding curve. To put it simply, the higher the A factor, the higher the liquidity concentration around the current price scale.
- Gamma (g) – While A mostly impacts the center of the curve, Gamma is used to fine-tune the tail ends of the curve (during pool imbalances). The higher the Gamma, the closer the bonding curve is to the axes. To put it somewhat simpler: the lower the Gamma, the thicker the liquidity outside the midpoint. As a general rule of thumb, Gamma is better kept at the low end as it has overlapping effects with A.
For those interested in really getting a feel for how these parameters affect pricing, here’s an interactive Desmos graph built for this report that you can use to visualize the impact of these two parameters.
Time of Reckoning: Which Model Works Best?
Now we can move on to the juicy bit.
To truly understand both models, it’s important to do more than just analyze their designs from a theoretical perspective. In the spirit of practical analysis, we pulled data for every trade in 2022 on Ethereum for the ETH/USDT pair on Curve Tricrypto and Uniswap v3. After that, we simulated all of these trades on the opposite exchange based on quoted prices in the block prior to trade execution (i.e. what price the pools quoted while each trade was in the mempool). And to say the least, we uncovered some interesting findings.
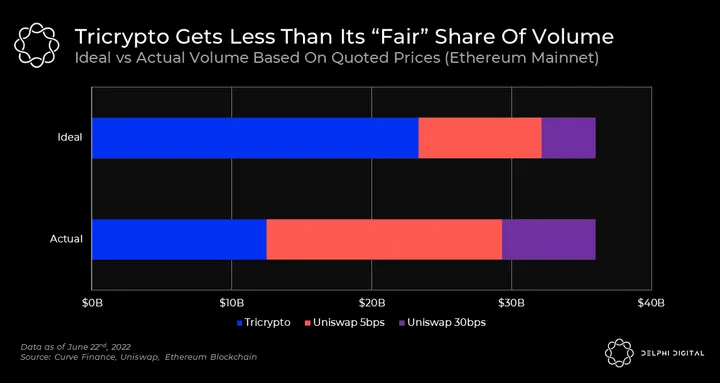
If we look strictly at price execution, Tricrypto was quoting a better price than Uniswap v3 for ~65% of volume. However, it only managed to capture about 35%. What caused this massive discrepancy? Before we answer that, we need to figure out how much better quotes offered by Tricrypto really were.
Below is the value forfeited per trade by the ~177K trades that chose Uniswap over Tricrypto, even though Tricrypto was quoting them a better price in the block prior to execution.
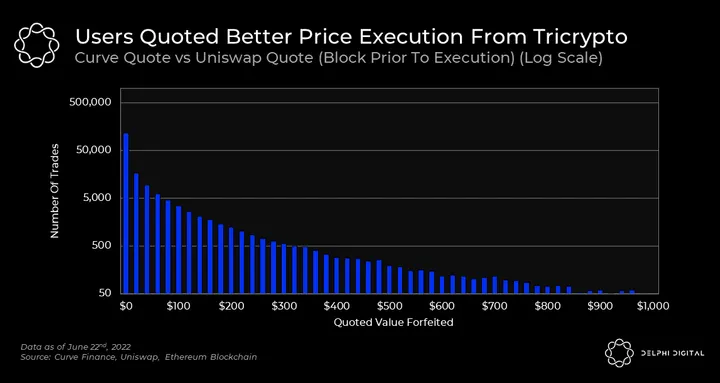
The above is a log scale which can make the data appear a bit deceiving, but the median value forfeited was just $6.22 per trade. Note that is purely based on Curve’s quote vs Uniswap’s quote. However, when it comes to true trade execution, it isn’t quite as black and white.
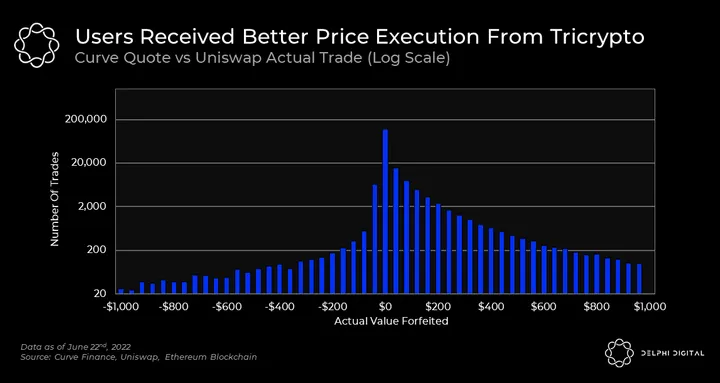
We thought this would be interesting to show as it highlights the positive impact that JIT can have on trader execution (even though it hijacks fees from other LPs). The “negative value forfeited” is a result of JIT or other situations that positively affected trade execution, such as a large trade in the opposite direction. The median value forfeited when compared with actual trade execution remained small and positive at $5.81 per trade.
It’s safe to say that since the median value forfeited was so low, the discrepancy between “ideal” and actual volume can be mainly attributed to gas costs. Since Curve v2 is more complex, the cost of a swap ranges from 250-300K gas versus 125-175K gas on Uniswap v3.

Even with depressed gas prices, this difference in gas costs is quite a large factor. But with gas costs starting to trend down, Tricrypto utilization has been gathering momentum.
To verify our hypothesis, we also simulated the performance of Uniswap v3 and Curve v2 on Arbitrum. The reason for this is simple. Ethereum’s roadmap will see consumer-side execution become dominated by rollups. As rollups can offer cheaper settlement fees to users, we use Arbitrum as a means of figuring out how the Uniswap vs Curve fight shapes up in a lower fee environment.
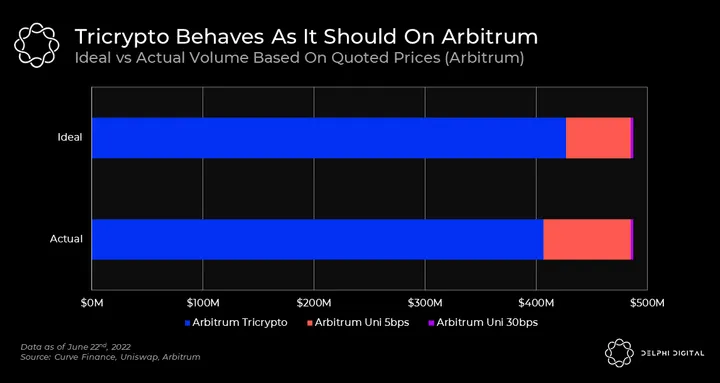
When using the same methodology as before and looking at actual vs “ideal” volume, the results improve significantly for Curve v2. On Arbitrum, Curve v2 “should” be getting 87% of volume, and in reality, it is getting 83%, these values are significantly closer together than on Ethereum Mainnet. As a result, we believe one of the biggest reasons Curve v2 doesn’t enjoy greater volume on Ethereum Mainnet is due to gas costs.
While the gas effect is certainly mitigated on Arbitrum, there is another factor that we can attribute to Curve still getting less than its “ideal” share: not all users use aggregators, and Uniswap’s brand is powerful. In a rational world where homo sapiens are replaced by homo economicus, everyone would use aggregators to always get the best price quote.
But the reality is that psychology and brand value play a big role in consumer product selection. And Uniswap enjoys the strongest brand value of virtually any DeFi protocol – perhaps any on-chain product in general. Another factor to consider is that if users are looking to buy a long-tail asset on Uniswap (most of which are not on Curve), some trades may be routed through an ETH-USDT/USDC pool first (since a lot of pools are paired against ETH instead of stablecoins).
Conclusion
Our key takeaways from this analysis are as follows:
- When compared in a silo (ETH-USDT pool) and in a gasless environment, we find that Curve v2 has the ability to offer, at the very least, comparable if not superior execution to Uniswap v3.
- Curve v2 is slowly gaining traction. Its merits stand out clear as day, offering a balance between an efficient yet passive market making strategy.
- Curve v2’s UX for traders and pool creators is intimidating. This probably contributes to why altcoin liquidity is still mostly on Uniswap; it’s just so easy to spin up a new pool. And, as always, there’s a trade-off. Uniswap makes actively providing liquidity difficult for unsophisticated users, yet setting up and managing a pool is easy. Curve does the exact opposite.
In terms of pure efficiency, it’s safe to say that Curve v2 is shaping up to be the closest competition to Uniswap v3. For Curve, success now boils down to attracting significant liquidity and improving UX. Usurping Uniswap will be no easy task, and it cannot be achieved on technical merit alone. Curve will have to build up brand value and battle Uniswap for consumer mind share.
As and how the Ethereum scaling roadmap starts to come to life, gas costs for end-users are expected to drop meaningfully. As trade execution costs reduce, Curve v2 has the potential to grab more market share by attracting passive liquidity en masse. And so, the DEX wars are once again igniting.
Note: if you would like to see and play around with the data for yourself, the scripts and csv files have been open-sourced here.
0 Comments