
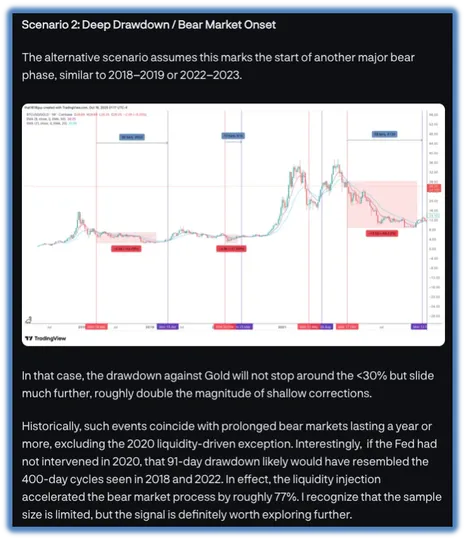
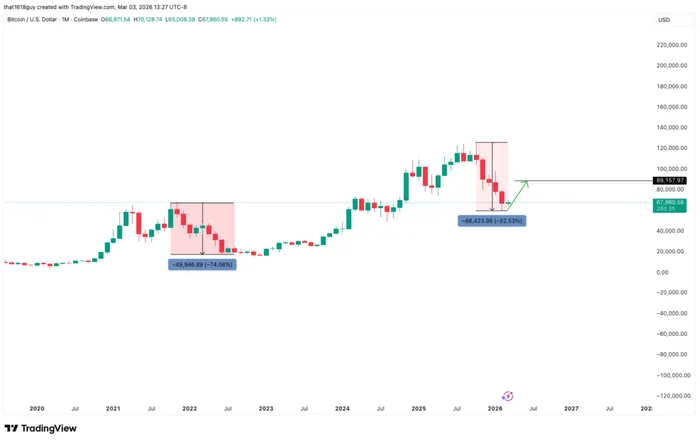
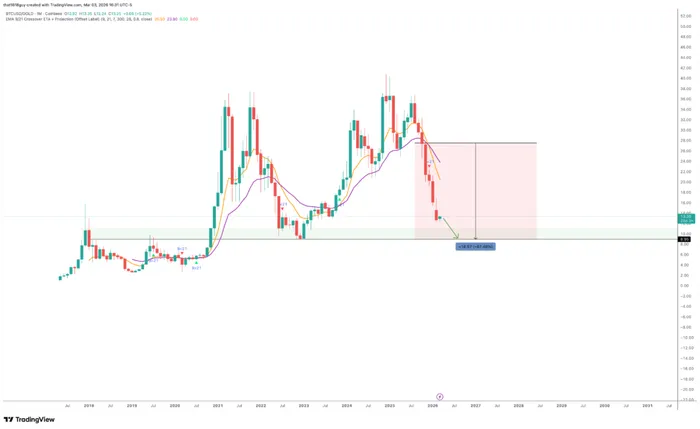
If y’all remember the BTC/GOLD chart and the 1W 9/21 crossover framework I’ve been tracking ever since we got that red downside cross, BTC against Gold has dropped -62.42%. The largest drop on record for this signal was -68.53%, and that was during the 2022 bear market. It seems like Scenario 2 from the AF that I wrote last year has played out. Question is, where do we go from here?
TLDR
My base case is that we are very close (if not already at) the bottom for BTC/Gold on this chart, give or take a few percentage points. And critically, BTC “outperforming” Gold from here doesn’t necessarily mean BTC rips. There are multiple paths to outperformance and I think the most likely one is actually the least obvious.
Let’s walk through the data, the scenarios and the setup.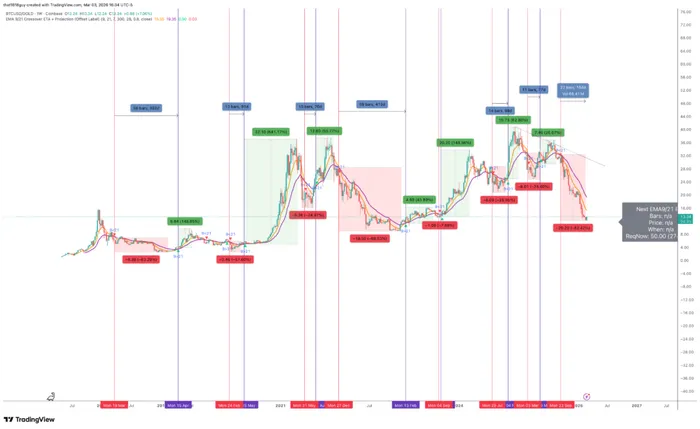
The BTC/Gold ratio has long served as a reliable gauge of macro risk appetite and liquidity cycles. When Bitcoin strengthens relative to Gold, it often reflects improving market sentiment and rising liquidity conditions across crypto risk assets. The inverse holds true on the downside and right now we’re deep in that downside regime.
The 1-week 9/21 EMA cross strategy remains the simplest and most consistent framework for mapping these shifts:
- When the 1W 21 EMA crosses above the 9 EMA, BTC tends to enter a sustained downside phase relative to Gold.
- When the 1W 9 EMA crosses back above the 21 EMA, it signals the start of a sustained upside cycle.
The Data
Across BTC/Gold’s full history, there have been 8 downside crosses. Here’s the complete dataset:
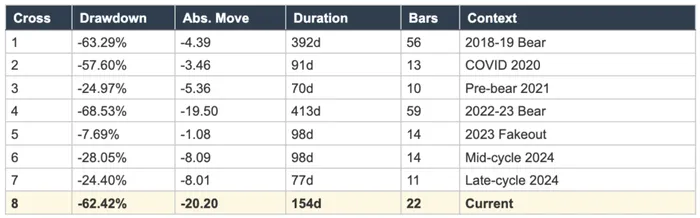
The largest drawdown following a bearish cross reached -68.53%, while the smallest and briefest was the -7.69% “fakeout” in 2023 which was the quick shakeout that I was hoping we’d get again coming into Q4 last year.
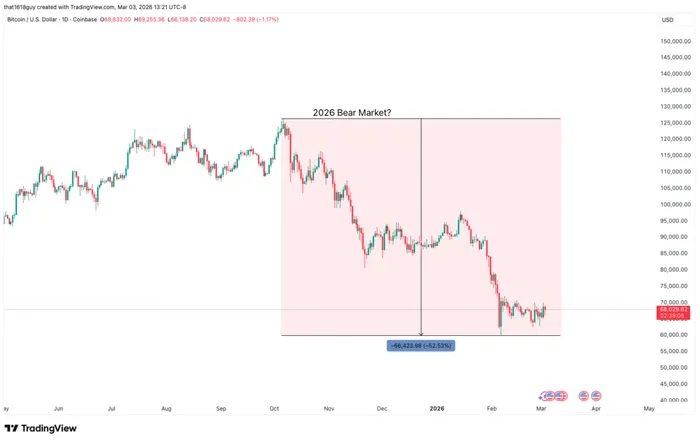
Unfortunately BTC’s drop from $126K and Gold’s incredible rally into the $4,000s+ last year made sure that didn’t happen this time.
The major declines of -63% in 2018-2019, -58% in early 2020 and -69% in 2022-2023 were also the most prolonged – lasting 392, 91, and 413 days respectively.
Both 2018 and 2022 were extended Bitcoin bear markets. The exception was 2020, when COVID-era liquidity injections compressed the cycle to just 91 days – effectively short-circuiting what might have been another year-long unwind.
The key stats for context:
- Average drawdown across all 8 crosses: -42.1%
- Median drawdown: -42.8%
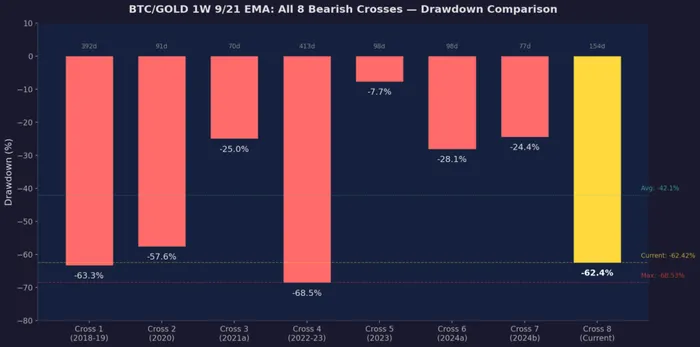
- Current drawdown (-62.42%): 3rd deepest in history (2nd deepest was -63.3%)
- 5 out of 7 completed crosses bottomed at shallower levels than where we are today
That last point is the important one. Only 2 prior crosses, the 2022 and 2018 bear saw a deeper declines than the current -62.42%. We are firmly in historical extremes.
Duration vs. Magnitude
The 154 days we’ve logged on this current cross is interesting because of what it tells us about the character of the move. Look at where the current cross sits on the duration vs. drawdown scatter:
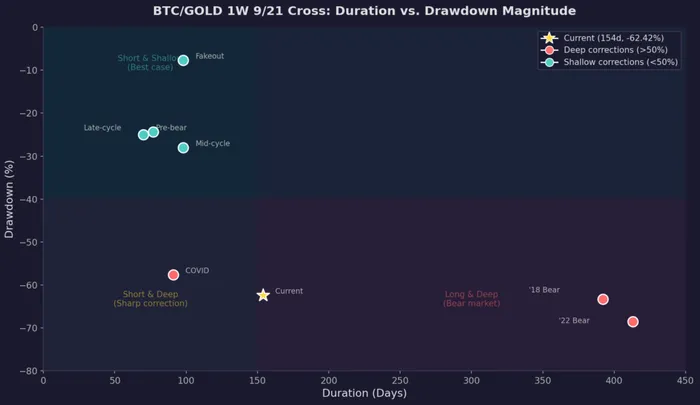
The current cross sits in the “short and deep” quadrant, meaning the magnitude of the drawdown has caught up to historical extremes much faster than duration would suggest. The two prior crosses that reached comparable depths (2018-19 and 2022-23) took 392 and 413 days respectively. We’ve gotten here in 154 days.
This matters because sharp, compressed moves tend to produce sharper reversals. The 2020 cross is actually the closest analogy in terms of profile – deep and relatively fast, and that resolved with the 9 EMA crossing back above the 21 within 91 days, kicking off the historic 2020-2021 bull run in BTC relative to Gold (+641%).
I’m not saying we get a +641% rally on the other side of this as that was fueled by unprecedented monetary stimulus, but the profile suggests we’re closer to exhaustion than continuation.
The Reversal Upside: What Happens After?
One of the most compelling aspects of this framework is that every single bearish cross has eventually resolved with a bullish re-cross, followed by meaningful upside.
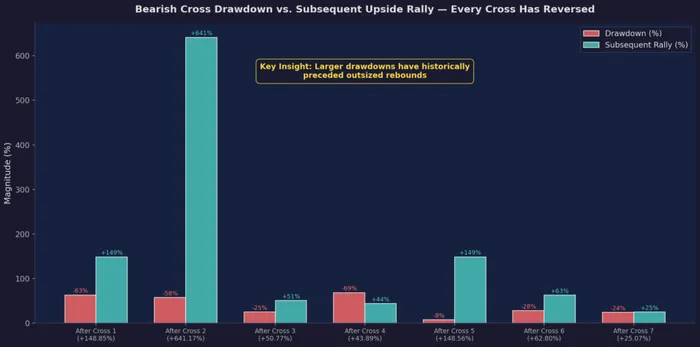
The subsequent rallies after each cross resolved have ranged from +25% (smallest, after the shallow -24% late-cycle correction in 2024) to +641% (largest, after the COVID-era -58% drop in 2020). The average subsequent rally across all 7 completed crosses is roughly +160%.
The pattern is clear: larger drawdowns have historically preceded outsized rebounds. The two deepest prior drawdowns (-63% and -69%) were followed by rallies of +149% and +44% respectively. Given that we’re currently at -62%, the historical setup leans heavily toward a meaningful recovery on the other side.
Outlook Scenarios: How BTC Outperforms Gold in 2026
This is the part people tend to get wrong. When I say I expect BTC to outperform Gold, I am not necessarily saying BTC rips higher. The BTC/Gold ratio can recover through multiple paths, and understanding which one is most likely matters for positioning.
Scenario 1: BTC Stagnant, Gold Pulls Back
Likelihood: Moderate-High
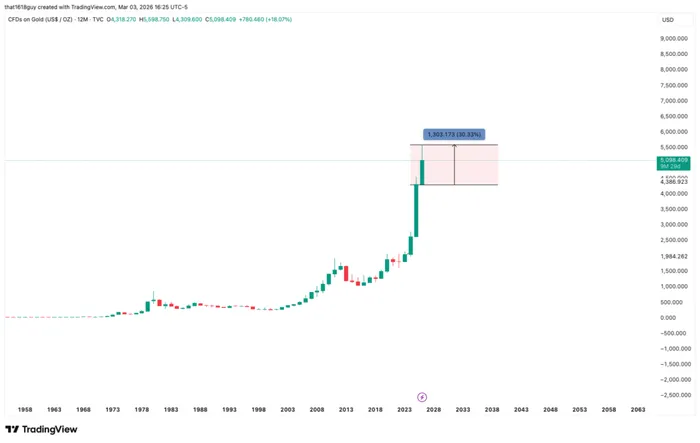
BTC ranges between $60K-$75K. Gold corrects from current levels ($5,100 as of today) after a parabolic run up of 30% in just the first 2 months of 2026.
Even a 10-15% pullback in gold to $4,400-$4,700 with BTC flat would produce a significant recovery in the BTC/Gold ratio.
This is probably the most underappreciated path for outperformance. Gold has gone essentially vertical. Central bank buying, tariff uncertainty, US-Iran tensions, the flight from risk assets… it’s all converged. But parabolic moves don’t sustain forever, and any resolution (even partial) on the geopolitical or trade front could trigger profit-taking in gold while BTC just sits there.
The current macro setup actually supports this: tariff pass-through effects are expected to wane by mid-2026 (per the CBO and Fed staff projections), and if any of the trade deals hold or geopolitical tensions de-escalate, the fear premium in gold starts to compress. Meanwhile, BTC has already repriced 52% from its October high; a lot of the risk-off selling is already done.
Scenario 2: BTC Rips, Gold Flat
Likelihood: Moderate (H2 2026 bias)
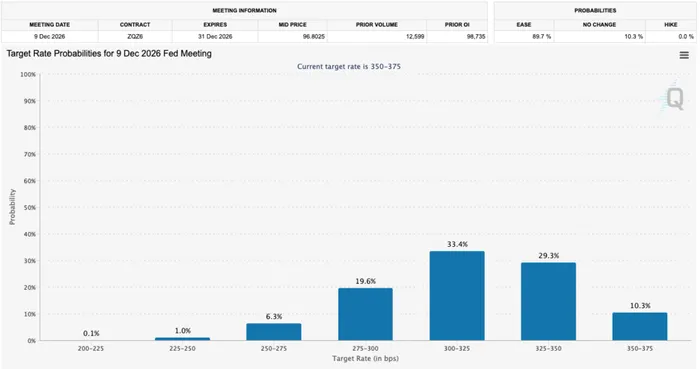
This is the more traditional risk-on scenario. The Fed currently sits at 3.50-3.75% with markets pricing 1-2 cuts for 2026, and the next likely window is June. Powell’s term ends in May, and a potentially more dovish successor shifts the reaction function. If liquidity conditions improve in H2, capital rotates back into risk assets.
BTC is also coming off a historically unusual stretch – 5 consecutive monthly losses, down 47% from ATH, spot ETF outflows, and leverage has been flushed. On-chain data from Glassnode shows the market has been absorbing aggressive leverage unwinding since late 2025. The positioning is arguably clean enough for a re-accumulation phase.
If we get a proper risk-on rotation in H2, BTC could reclaim $80K-$90K while gold consolidates around $5,000-$5,500. That’s a massive move in the ratio.
Scenario 3: Both Rally, BTC Outperforms on Beta
Likelihood: Moderate
Both assets catch a bid, gold on continued structural demand (central banks, fiscal deficits), BTC on improved liquidity and institutional re-engagement. But BTC with its higher beta moves more. A 30% BTC rally paired with a 10% gold rally still produces significant outperformance on the ratio.
This is basically the “everything rally” scenario if the Fed cuts more aggressively than expected – Goldman is projecting funds rate down to 3-3.25% by year-end, and the CBO has it at 3.4%. Current target rate probabilities for 2026 year end Fed meeting shows a lack of confidence of more than 1-2 cuts. Any movement to skew this probabilities for further rate cuts have not been priced into the broader market yet.
Scenario 4: Continued Grind – BTC Down, Gold Up
Likelihood: Low
The bear case. Recession fears deepen, credit stress materializes, BTC trades as a pure risk asset while gold catches an even bigger safe-haven bid. This would push the ratio toward or past the 2022 lows, into the -68% to -70% range.
I put low odds on this for three reasons:
(a) the drawdown is already at historical extremes, currently we’re at the 71st percentile of all prior red cross drawdowns, (b) BTC has already repriced massively from $126K, and (c) the labor market, while softer (unemployment at 4.3%, payrolls averaging ~60K/month), isn’t collapsing in a way that would signal a deep recession.
Current Base Case
My base case is a sequenced combination of Scenarios 1 and 2.
Near-term (Q1-Q2 2026): BTC ranges, gold potentially overextends and mean-reverts. The BTC/Gold ratio stabilizes and begins to turn. The 9/21 EMAs start converging.
H2 2026: Tariff pass-through fades, the Fed delivers 1-2 cuts, Powell’s successor takes the helm. We get a more constructive liquidity environment. BTC catches a bid from currently oversold conditions while gold digests its 74% rally. The ratio firmly turns green.
The net result: BTC outperforms Gold by year-end 2026, with the bulk of the ratio recovery likely coming in H2 as the macro backdrop shifts from risk-off to risk-neutral.
Confirmation and Risk Markers
i. Validation Criteria
A confirmed reversal would require:
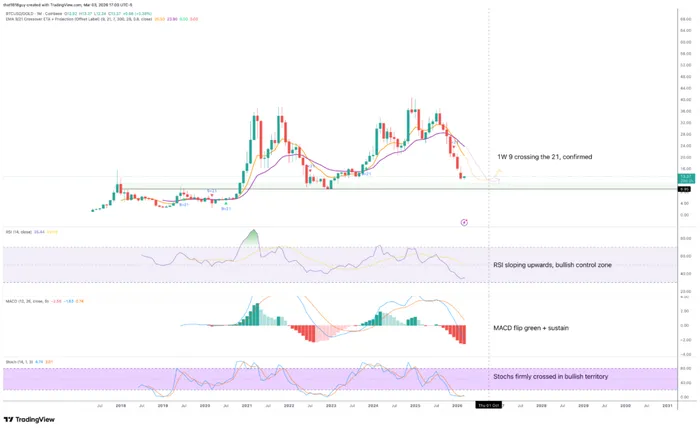
- The 1W 9 EMA crossing above the 21 EMA and holding – this is the primary signal.
- A MACD flip into green that sustains for multiple weeks. As noted in my prior AF, every previous successful cross-up has coincided with the first green weekly MACD print.
- Stochastics firmly angled upward near the 80 region or higher at the time of cross.
- Gold showing any signs of topping – a weekly close below its 9 EMA would be an early signal.
ii. Invalidation Criteria
- If the drawdown pushes past -68.53% (the 2022 record), that breaks the historical precedent and we need to re-evaluate the entire framework. At current levels, that’s roughly another -16% on the ratio, meaning either BTC dropping below $55K or gold surging past $5,800-$6,000 without any BTC relief.
- If the EMAs continue diverging through Q2 without any signs of convergence, the shallow correction thesis is off the table and we’re looking at a structural bear market in BTC relative to Gold, similar to 2018 or 2022.
- A US recession signaled by unemployment spiking above 5% or a major credit event would fundamentally change the macro backdrop and favor Scenario 4.
Closing Thoughts
The BTC/Gold ratio is at the 2nd deepest drawdown in the history of the 1W 9/21 EMA bearish cross framework. Only the 2022 generational bear market produced a deeper decline.
We are statistically speaking very near the floor.
The question isn’t whether the ratio reverses but when and through which path. My base case is that the reversal is a H1 stabilization / H2 recovery story, driven first by gold mean-reversion after its parabolic run, and later by BTC catching a bid as the macro environment shifts toward easier financial conditions.
Unlike downside crosses where drawdowns cluster tightly around well-defined ranges – upside reversals show much broader dispersion, ranging from +25% to +641% depending on where the cross occurs within the broader macro cycle.
Given the depth of the current drawdown, history suggests the subsequent rally should be meaningful.
The risk case would require a recession, a credit event, or BTC losing relative strength in a way that has only happened twice before (2018, 2022), both during confirmed bear markets. The current environment while painful doesn’t yet resemble those conditions.
I’ll be tracking the convergence of the 9/21 EMAs closely and when the cross-up eventually comes, I’d view it as a signal to rotate toward higher-beta BTC exposure relative to defensive Gold positioning.
For now, the data says we’re nearing the endgame and the setup into the back half of 2026 is compelling.