 TLDR
TLDR
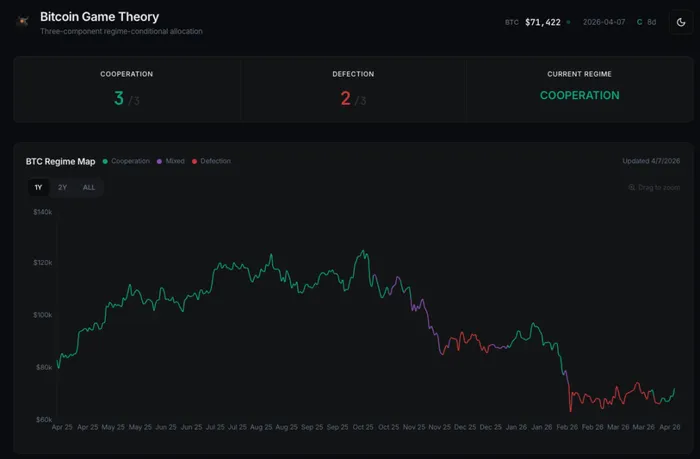
The BTC Game Theory model flipped into a fresh Cooperation regime on March 31. By Day 2, CPS had already cleared the 0.57 durability baseline, something that typically takes weeks and has never happened this early across 34 episodes. As of Day 8, CPS is 0.7411 and accelerating. Cooperation inputs are 3/3 while 2 of 3 defection signals remain active, meaning the cooperation side is dominant but the model is not reading all-clear. That context matters: this Cooperation regime is forming under pressure and not in a vacuum.
Most C regimes that are going to fail do so early. The ones that survive the initial window tend to run. Mean forward return by Day 60 is roughly +17%. We’re still in the fragile period, but the speed at which this regime reached durability suggests it belongs to the latter group, not the former. If it holds, the asymmetry from here gets interesting. If it doesn’t… we’ll know soon enough.
Framework Context: The BTC Game Theory model classifies market regimes as Cooperation (C) or Defection (D) based on a composite of on-chain patience signals, positioning behavior, and volatility structure. The Composite Patience Score (CPS) measures regime strength on a 0 to 1 scale, with 0.57 as the durability threshold.

For a deeper look at the framework, see the full research report: Bitcoin Markets Are a Coordination Game, Not a Price Prediction Problem.
Defection Built the Foundation
The interesting part of this transition is not the March 31 flip. It is what was happening inside the model while the tape looked terrible.
February and March were a Defection regime.
BTC sold off on Iran headlines, oil spiked toward $95 and risk appetite broadly contracted. On the surface, it read like deterioration. Underneath, the model told a different story. CPS bottomed near 0.15 in early February and then spent the entire Defection period climbing. By late March, the patience composite had already recovered to the 0.60 range before the regime officially turned.
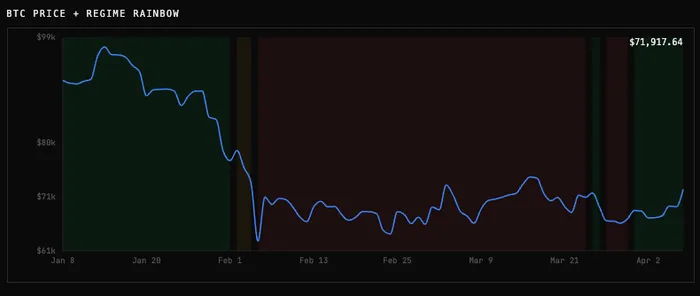
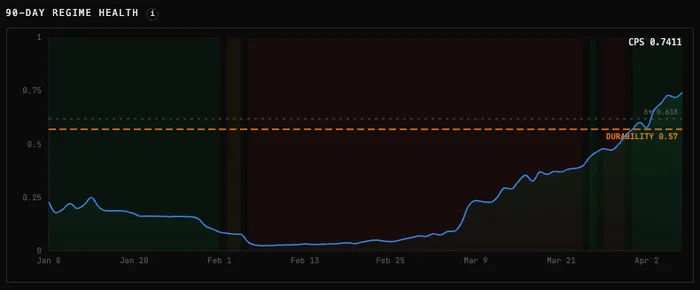
Figure 1: BTC Price vs. Composite Patience Score (Dec 2025 to Apr 2026)
That is not how most regime transitions work.
Typically, Cooperation regimes start weak and need weeks of quiet range compression to build the internal strength that pushes CPS above durability. This one inherited its strength from the Defection phase itself. The implication is straightforward: while price was falling, the composition of the market was improving.
Weak hands were exiting and patient capital was replacing them. By the time the model registered the flip, the structural work was already done.
The Fastest Durability Print on Record
Across 34 Cooperation episodes since 2020, CPS has typically needed 15 to 25 days to climb above the 0.57 durability baseline. The current regime cleared it on Day 2 at 0.6010 with BTC around $68,228.
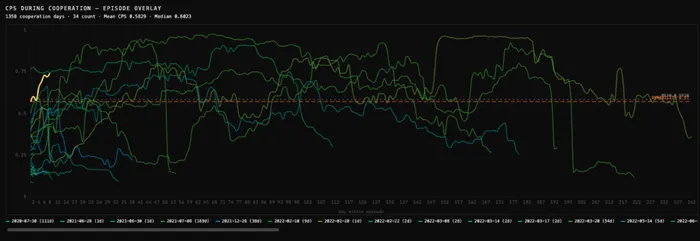
Figure 2: CPS During Cooperation, Episode Overlay (34 episodes since 2020).
The current regime entered above the durability baseline immediately, a path visible in the upper left of the chart that most prior episodes took weeks to reach and that does not happen very often.
The overlay makes the distinction clear. Most C regimes start with CPS well below 0.57 and either grind their way up to durability over weeks or roll over and die before getting there. The current regime’s path is an outlier from Day 1. It entered above the threshold and has only accelerated since.
6 days later, CPS has accelerated to 0.7411. The 10-day trend is +0.27 and rising. The trajectory is not just holding but also expanding.
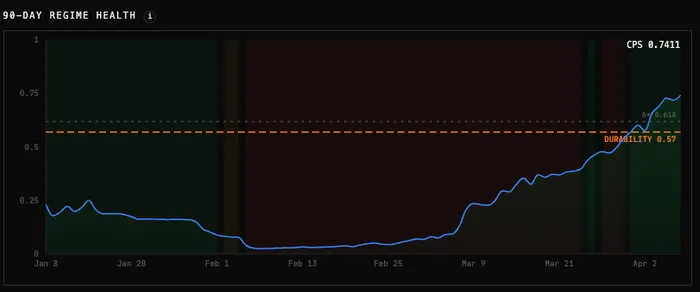
Figure 3: 90-Day CPS Regime Health (Jan to Apr 7, 2026)
What Day 8 Looks Like
BTC has moved from $68,228 at entry to $71,918. That is roughly a 5.4% gain, quiet and unremarkable on a chart. But that is exactly what healthy early-stage Cooperation looks like. The returns in C regimes are back-loaded and not front-loaded. Historical mean forward return at this stage sits around +5% by Day 20 and roughly +17% by Day 60. The first week is not where the edge lives.
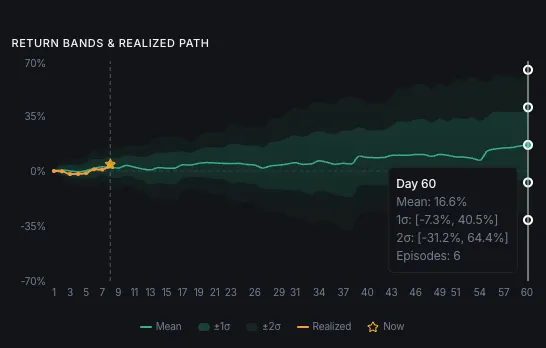
Figure 4: C-Regime Forward Return Bands, Day 1 to Day 60
Fwiw, the whole point of this framework is that the edge comes from sitting in regimes that persist, not from catching the first few days. If this C holds, the forward path gets better every day it survives.
Survival Window
The survival and hazard data sharpens the picture considerably.
At Day 8, the hazard rate has dropped to 7.1%, down from the steep cluster of failures in the first five days that eliminates the majority of C regimes. Only 14 of 34 Cooperation episodes in the model’s history have made it this far. The survival rate at Day 8 is 41%, which sounds low in isolation but reflects how aggressively fragile regimes get filtered early. The median C regime lasts just 3 days. The mean is 40.
That gap tells you everything about the distribution: most die fast, but the ones that survive tend to last a long time.
- Days 1 to 20 (Formation Phase): Coordination is emerging but fragile. Approximately 30% of all Cooperation regimes fail before reaching Day 20 – this is where we are now.
- Days 20 to 40 (Reinforcement Phase): Supply migration, volatility compression and leverage normalization begin reinforcing coordination. Roughly 70% of regimes that survive to Day 20 persist to Day 40+.
- Day 40 and beyond (Reinforced Coordination): In the tested sample, every Cooperation regime that reached Day 40 persisted well beyond it.
The key property of Cooperation regimes is that hazard declines with age. Unlike a mean-reverting process where the probability of reversal increases the longer a state persists, coordination becomes more stable over time. Duration strengthens the regime rather than weakening it.
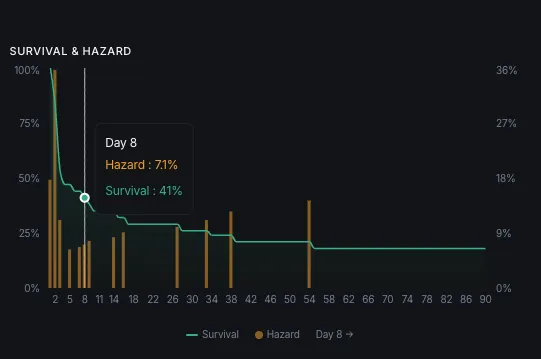
Figure 5: Cooperation Regime Survival and Hazard Rate, Day 1 to Day 90
At Day 8, the hazard rate is 7.1% and falling, CPS is at 0.74 and accelerating and the cooperation side of the model is fully lit. The 2 active defection signals are worth watching but have not been enough to slow the CPS trajectory so far. The next milestone is Day 20, which marks the end of the Formation Phase and the point where conditional persistence odds improve materially.
The biggest risk to this regime is not the model but rather the macro.
What I am Watching
Day 20 is the first real milestone.
That marks the end of the Formation Phase where roughly 30% of C regimes historically fail. Every day of survival between now and then compresses the hazard rate further, and the regime is already tracking well ahead of the typical path given where CPS entered. If we clear that window with CPS still above durability, the conditional odds of this becoming a multi-month regime improve considerably.
CPS direction matters more than level at this point.
A continued hold above 0.70 means the regime is strengthening. A rollover toward 0.57 would be the first sign that internal momentum is fading. So far, the trajectory has been one-directional.
On the macro side, the model cannot see Iran and it cannot see oil.
What it can see is that every patience input kept making new highs through the worst of the headline risk. If the geopolitical backdrop stabilizes even partially, this regime has the structural foundation to let price catch up to positioning. If it doesn’t, and we get a material escalation, even durable coordination can get overridden by forced selling.
For now the base is forming. The model’s allocation signals have not fired yet and that’s by design. But the internal setup heading into the confirmation window is as strong as anything in the model’s history. If this regime persists, the signal is coming.