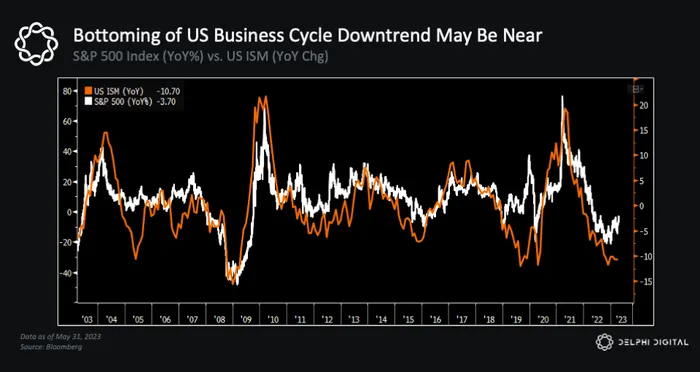
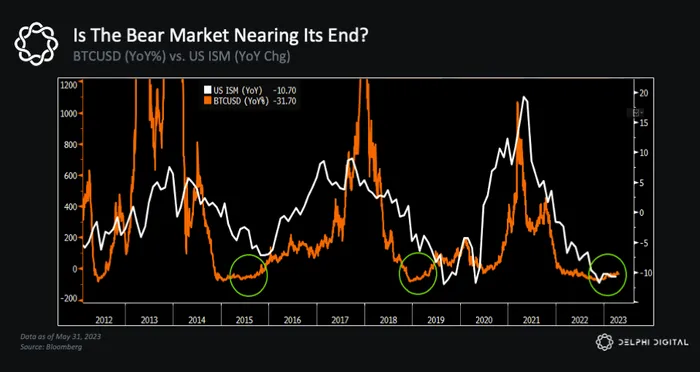
The US ISM is one of the best indicators for forecasting trends in asset prices. Today’s ISM print came in just below expectations (46.9), which continues to point to a weakening economic outlook.
But barring a serious recession, history tells us the ISM is likely getting closer to a bottom.
BTC tends to show signs of a reversal ahead of this, and so far that’s exactly what we’ve seen this time around as well.
As we’ve highlighted, the ISM tends to lead changes in Global Liquidity trends. In other words, when the ISM is falling – as it has been over the last 18 months – we eventually see an increase in global liquidity in response to a weaker growth outlook.
For a more in-depth discussion on some of these points – and the implications for crypto and markets – be sure to check out this week’s Bull vs. Bear.

