The Year Ahead for Markets is the final report of our Year Ahead series. It provides our top-down view of the biggest macro and market trends we’re focused on as we close the book on 2022 and look to the new year. We highly recommend reading all of the other sector Year Ahead reports to get a much deeper understanding of the most critical trends impacting individual sectors and the teams and protocols building the future of this industry.
The Year Ahead for NFTs | Gaming | DeFi | Infrastructure
A Tale of Two Halves – The Great Reset
2022 was The Great Reset for crypto. Overly hyped trends and mass speculation pushed the crypto market far out over its skis by the end of 2021, so this year’s washout was a necessary reset. Sizable corrections are healthy for long-term secular uptrends.
The last three years have been a tale of two halves.
The plot of act I was the culmination of policy responses to the post-COVID flash recession — massive stimulus programs were the stars of the show.
“The giant backstops put in place by such policies turned markets around almost on a dime, and were a key catalyst in propelling asset prices to new all-time highs. Financial conditions eased, risk appetite returned, and BTC and crypto assets were huge beneficiaries of this environment, which saw global liquidity expand at one of the fastest rates on record.”
– Why Bitcoin is Behaving Like It Should (January 2022)
Act II was the fall of the market’s shining white knight as our story’s hero turned into its biggest villain. All the tailwinds that propelled asset prices to new highs reversed course, and 2022 was the polar opposite of the previous 12 months — something we warned of a year ago:
“Several macro tailwinds that helped propel BTC and crypto assets to new highs over the last 12-18 months have reversed course; the shift away from excess liquidity and accommodative monetary conditions is a structural headwind we’ve highlighted in recent months, which now appears to be coming to a head.”
This leads us to an important theme we’ve been harping on since our earliest days — crypto is macro.
What’s happening in macro has a direct impact on the crypto market, as we’ve seen not just over the last two years, but arguably the better part of the last few price cycles. We’ll get into that shortly, but first let’s get a quick sense of the current state of the crypto market.
State of the Crypto Market
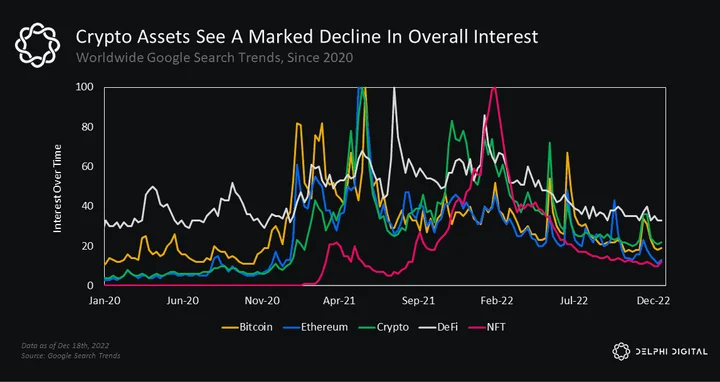
The sharp drawdown in crypto asset prices this year has many wondering when the pain will subside. General interest in many of the most prominent crypto themes of the last few years has died down considerably over the last 6-9 months.
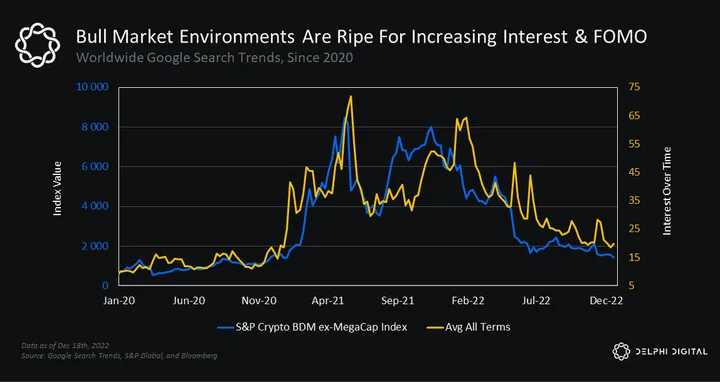
Unsurprisingly, interest tends to pick up during bull markets and wane in bear markets.
BTC is trading right in the range of its previous 2017 peak and its summer 2019 retest, an area many consider to be a pocket of vulnerability as we head into 2023.
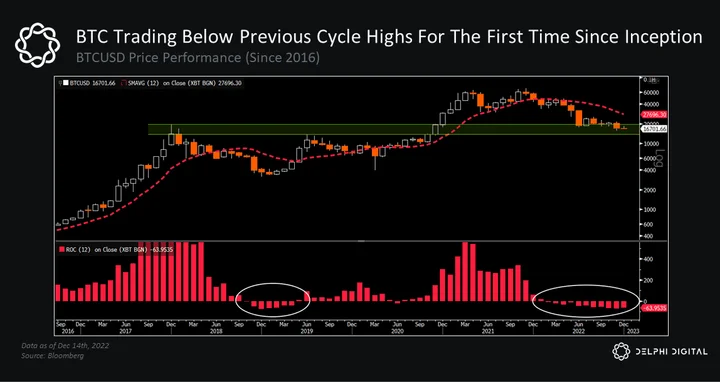
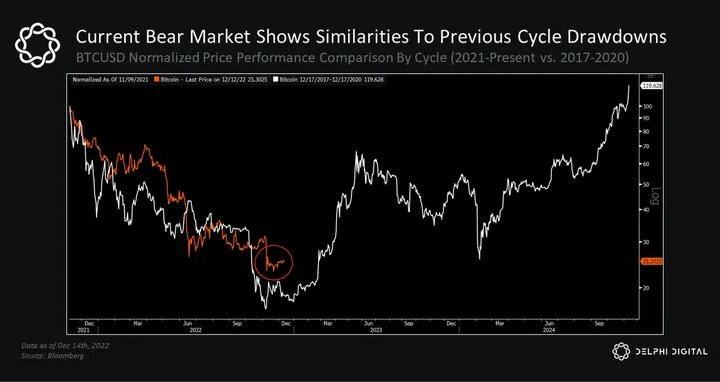
BTC is down ~76% from its prior all-time high. For context, the price of BTC fell ~85% from peak-to-trough in each of the last two major bear markets. History never repeats itself, but this year’s drawdown mirrors that of 2017-2018 in many ways.
ETH saw an even larger drawdown during the 2017-2018 cycle, falling 93% from peak-to-trough. ETH’s peak drawdown this year was 82% back in June — it’s currently trading ~76% off its prior ATH as well.
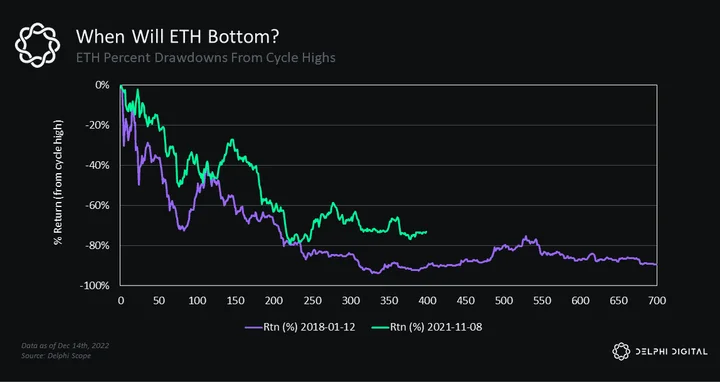
Interestingly, BTC and ETH peaked in November 2021, unlike the rest of the crypto market which peaked earlier in the year back in May 2021, as measured by the S&P Crypto BDM Ex-MegaCap Index. The broader crypto market has experienced an even sharper ~82% price drawdown from its all-time high.
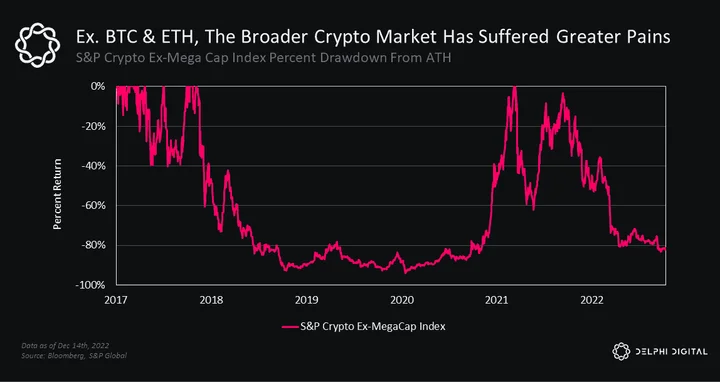
If the market were to mimic the same peak-to-trough drawdown of last cycle (~93%), the total market cap for the broader market would have to fall another ~60% from here (though that’s not our base case).
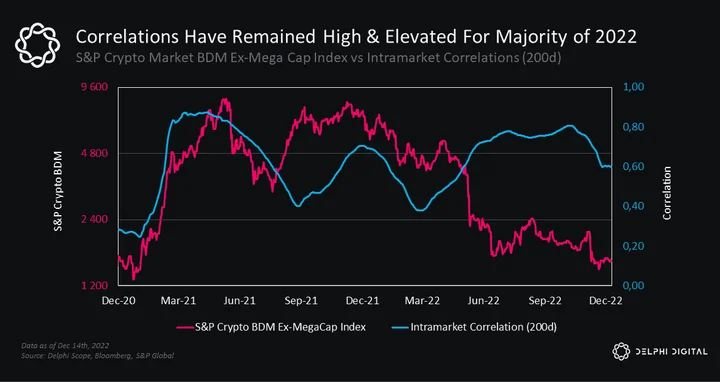
Correlations between crypto and traditional asset classes have been very tight over the last 12 months, and for good reason. Intramarket correlations within crypto have also remained elevated this year, which has led to widespread weakness across every major sector.
Bitcoin is now trading roughly two standard deviations below its long-term trend.
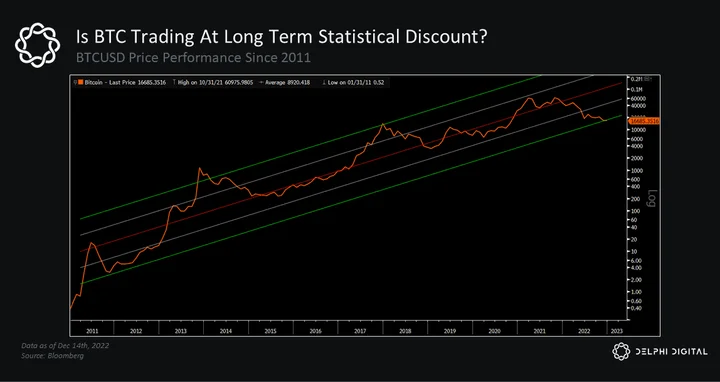
Prior cycle bottoms were marked by a sizable selloff that pushed BTC into oversold territory on its 14-month RSI and a test of its 200-week MA, which historically served as strong support for price to find a floor. We saw these same conditions play out this past summer, and BTC has been largely rangebound since.
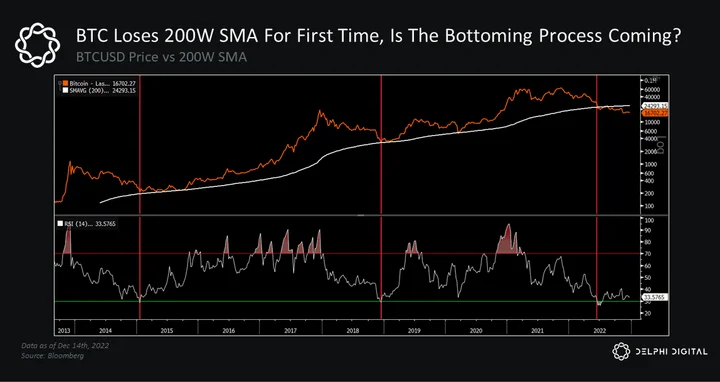
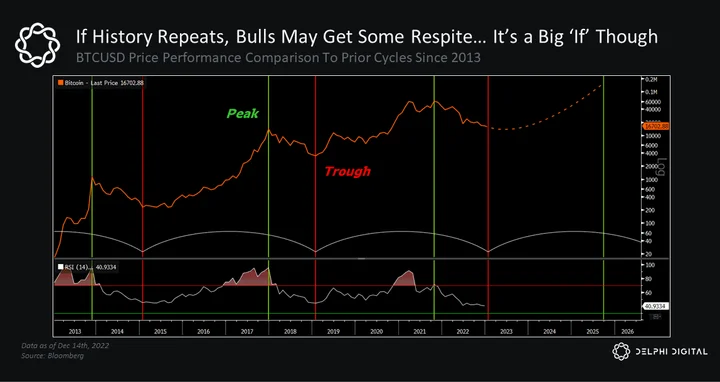
Past performance is not indicative of future results. But if this cycle follows the general path of those before it, one would expect to see markets consolidate into Q1 2023 before forming a clear bottoming pattern. This accumulation period in H1 2023 would be a welcoming setup for the crypto market to move into its next bull cycle. We would add that this is dependent on a reversal in the key macro headwinds that have weighed on risk assets throughout 2022.
Key Theme #1: Liquidity Still Runs the World
For those who haven’t read our “Liquidity Runs the World” report, we highly recommend it as a precursor for the topics discussed below.
We noted at the turn of last year that a sustained downtrend in global liquidity was the biggest risk to crypto markets heading into 2022.
“Bitcoin is one of the purest plays on fiat currency debasement. It also happens to be one of the most leveraged bets on global liquidity; when liquidity is abundant and expanding, BTC and crypto assets tend to outperform; when liquidity tightens, they struggle.”
Global liquidity is the most powerful force in macro, which is why it’s our first key theme and one which we believe will have a significant market impact in 2023.
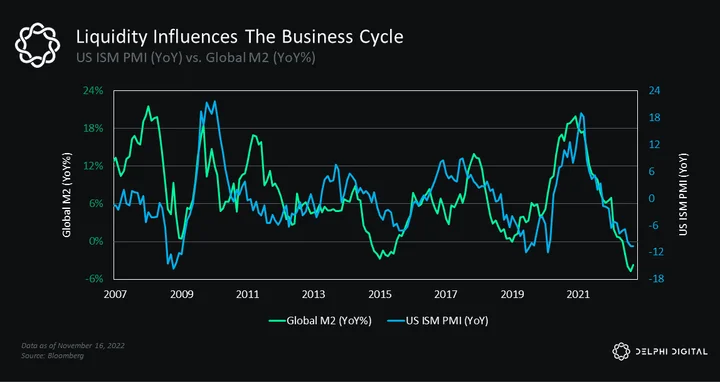
Global liquidity cycles have a strong correlation with changes in the business cycle.
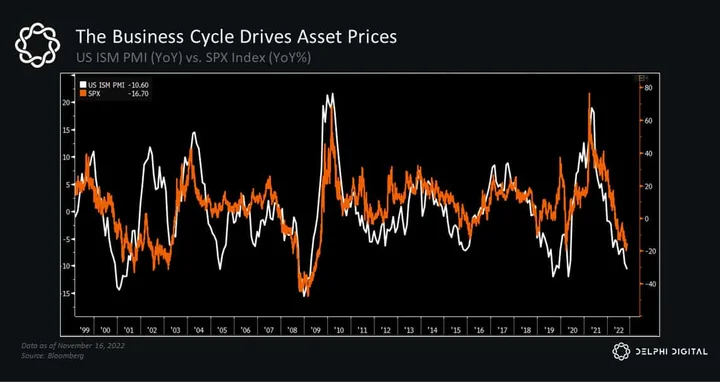
And the business cycle drives changes in asset prices.
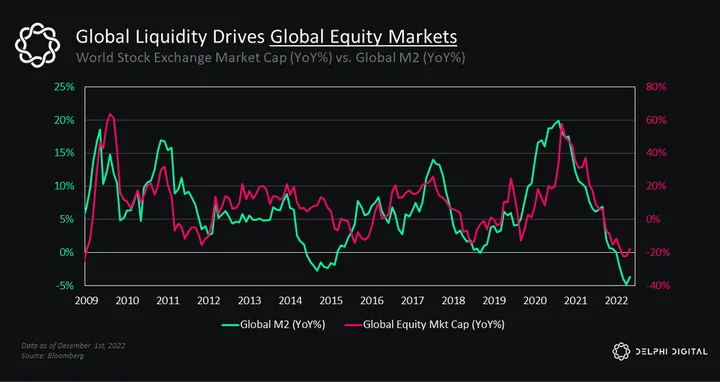
Therefore, trends in global liquidity influence the direction of markets. They drive fluctuations in global equities…
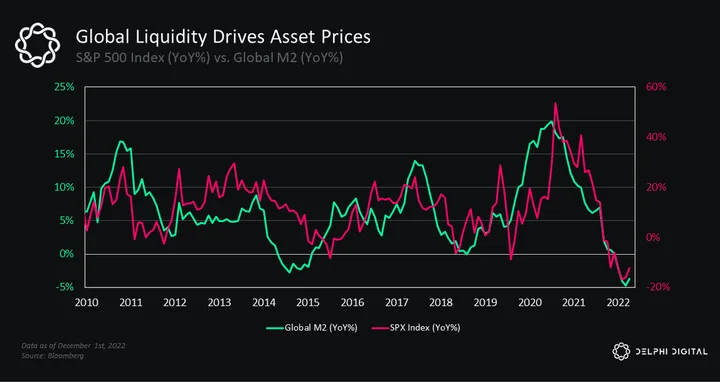
And have a strong impact on the largest equity market in the world.
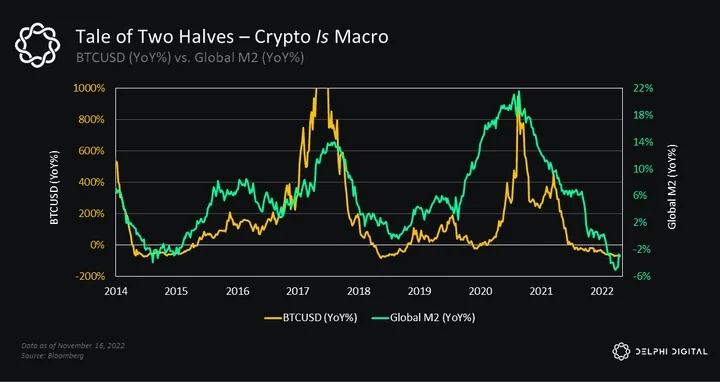
They even influence the direction of the crypto market.
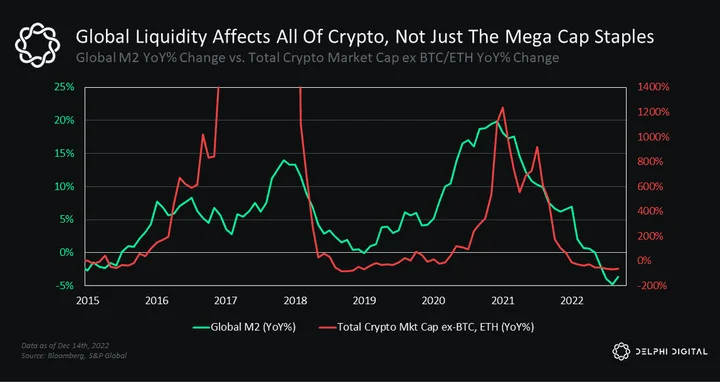
And not just mega caps like BTC and ETH…
Global liquidity’s influence on crypto asset prices also affects capital flows into (and out of) crypto funds.
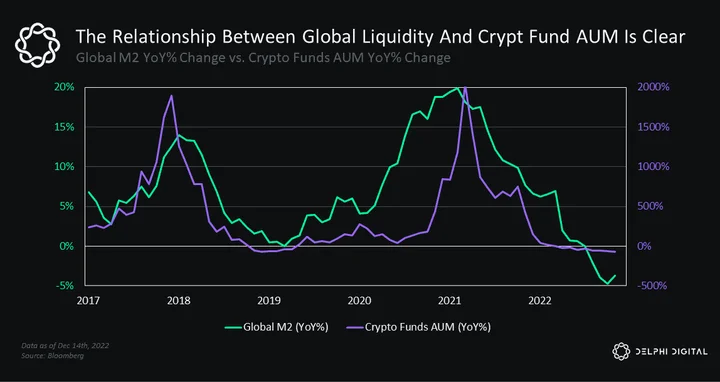
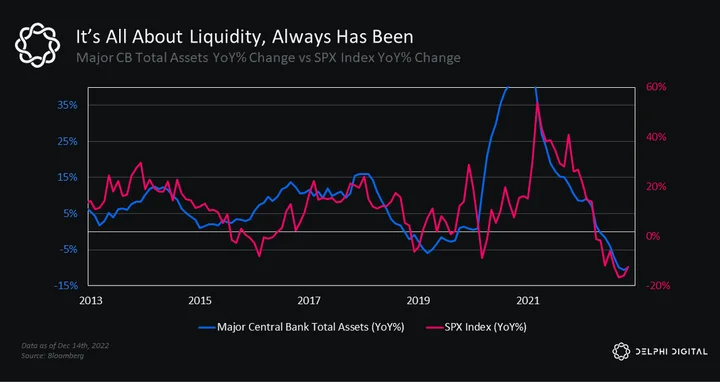
One caveat is that M2 is not an all-encompassing measure of global liquidity (see our prior report Liquidity Runs The World for a more in-depth discussion on these points), but it serves as a decent proxy. It tracks trends in major central bank balance sheets…
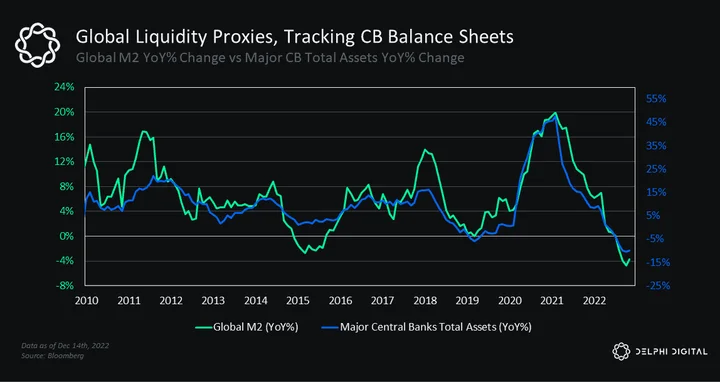
…and the relationship with markets, including crypto, is striking.
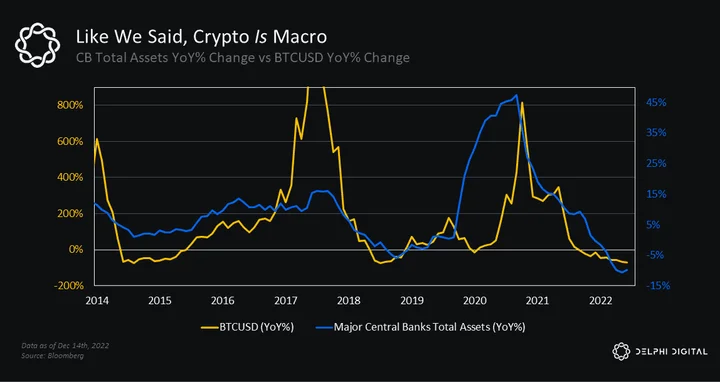
Liquidity cycles aren’t new — we’ve seen their power before. Global liquidity growth slowed considerably back in 2018 as financial conditions became more restrictive. The result was a sizable correction in risk assets and a prolonged bear market for the most speculative long-duration assets (like crypto). We saw a similar dynamic play out over the last 12 months, though on an even greater scale.
Global liquidity cycles drive changes in asset prices. They influence the direction of global equity markets. They drive fluctuations in bond yields and credit spreads. They even have a substantial impact on the crypto market, which is why a reversal in global liquidity is one of — if not the most — important catalysts for a renewed bull market.
It also looks like this liquidity cycle is approaching another inflection point.
Global Liquidity – The Reversal We Need

There are early signs that a reversal in global liquidity is upon us. Here’s an updated chart from CrossBorder Capital that shows the early signs of a potential bottom in this current cycle:
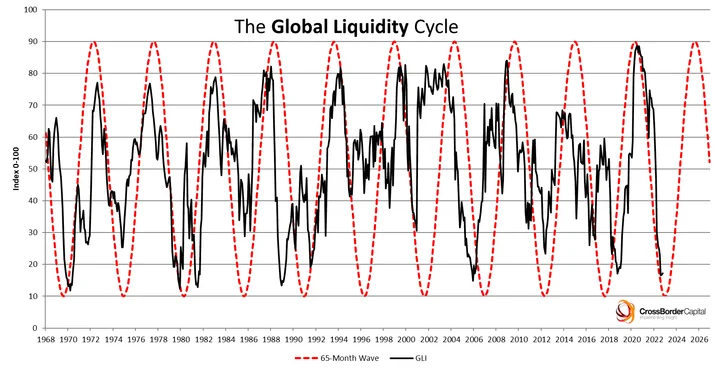
“The cycle moves in 5-6 year waves and is currently just starting to turn higher from its mid-2022 lows. Global liquidity leads financial markets by some 6-12 months and economies by around 12-18 months…it shows that we are at ‘maximum tightness’” – CrossBorder Capital
Our good friend Raoul Pal also has a great chart showing how the business cycle tends to lead liquidity reversals as well.
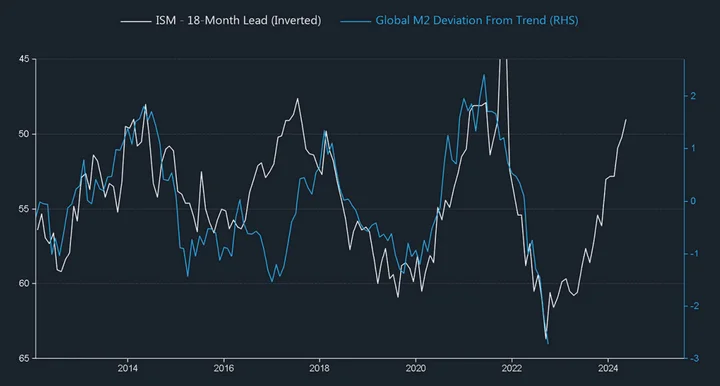
“…but the business cycle leads liquidity, and the ISM (shown inverted here) is forecasting significant economic weakness ahead, and thus liquidity is on the cusp of turning to offset falling growth…” – Raoul Pal, GMI
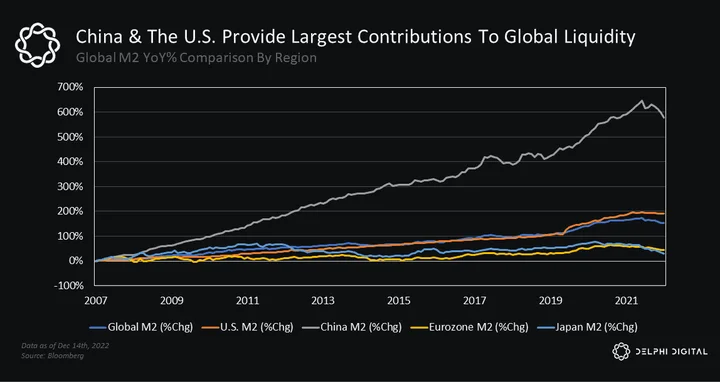
The two biggest contributors to global liquidity are the US and China. The world’s second largest economy has grown to be a liquidity powerhouse over the last 15 years.
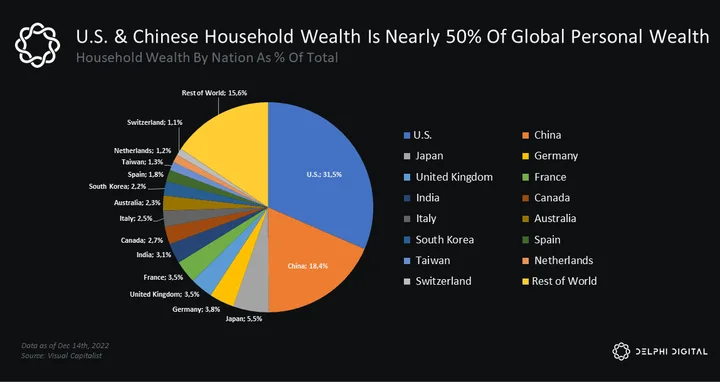
Households in the US and China also make up nearly half of the world’s personal wealth.
After months of stern rhetoric, pressure is starting to mount on China as its economy sputters. Policymakers are warming up to the idea of supportive initiatives aimed at promoting growth as the country continues to grapple with significant headwinds (some of which are self-induced, e.g., zero-COVID).
The focus in China is shifting, and reopening its economy is now top of mind to combat its weakening growth outlook. The PBOC has already asked banks to “stabilize” lending to property developers, a critical sector for China’s economy, who’ve struggled to claw their way out of a year-long slump that’s left many companies cash-strapped and facing greater insolvency risk. The PBOC recently cut required reserves for banks for the second time this year — the latest of which is estimated to free up ~$70B of liquidity — and will likely take further action to prop up growth (especially as the rapid spread of COVID infections impact a growing percentage of its workforce).
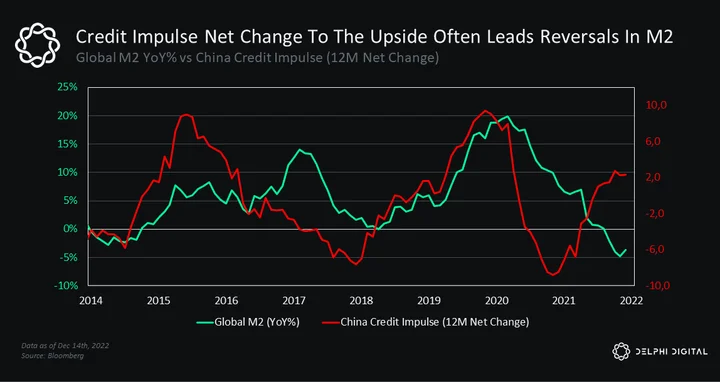
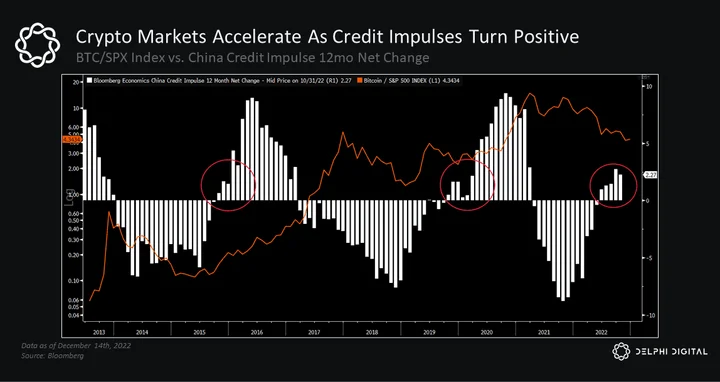
China’s credit impulse has turned higher in recent months too.
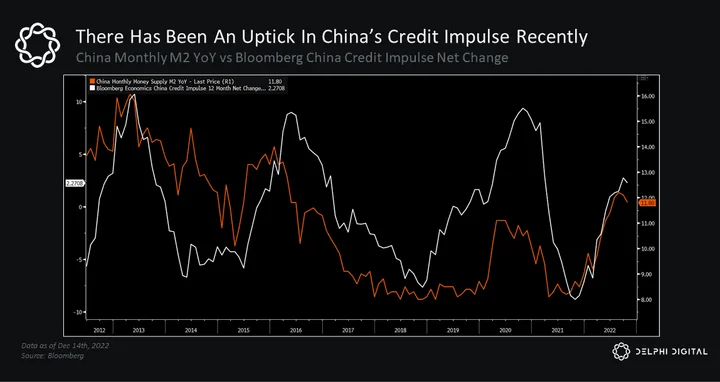
Positive net changes in China’s credit impulse tend to lead to reversals in global M2 growth.
In recent years, they’ve also led trend reversals for the US dollar (which would be a very welcoming sign for markets).
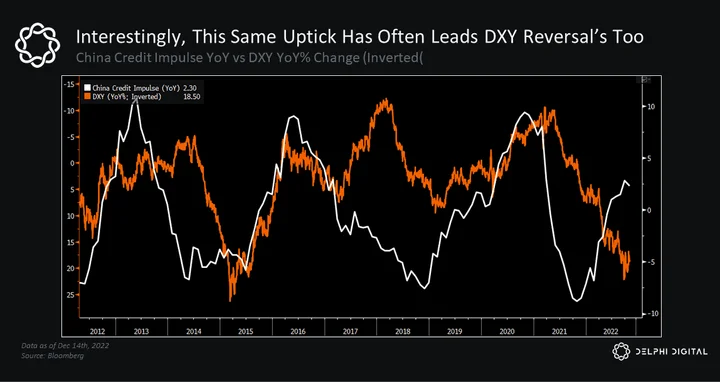
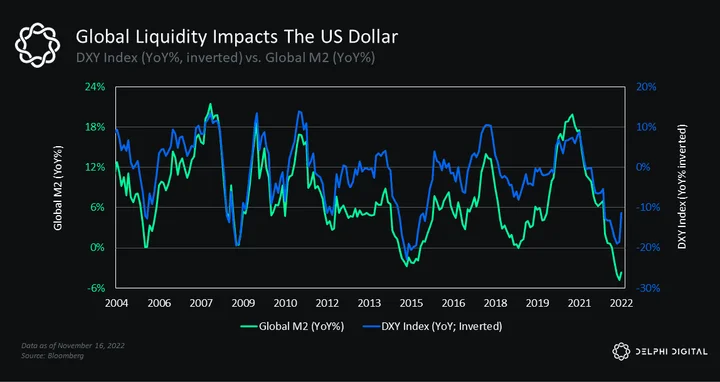
Global liquidity cycles have an inverse relationship with the dollar, making them a key trend to monitor given our past warnings that a strong USD remains one of the biggest headwinds facing risk markets (including crypto).
We saw the year-over-year change in China’s credit impulse bottom ahead of the crypto market back in 2018, which may support a more optimistic outlook as we get deeper into next year.
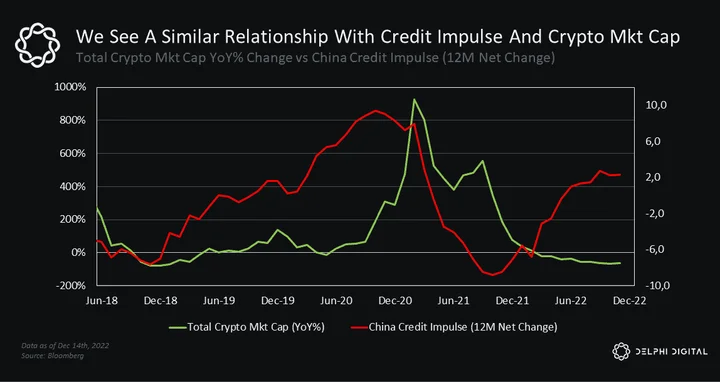
The crypto market’s outperformance really started to accelerate after the net change in the China credit impulse turned positive, which is something we’ve already started to see over the last few months.
The Fabled “Fed Pivot”
The US is a bit of a different story, at least for now. Much to the dismay of investors, the Fed has aggressively targeted tighter financial conditions in its battle against inflation.
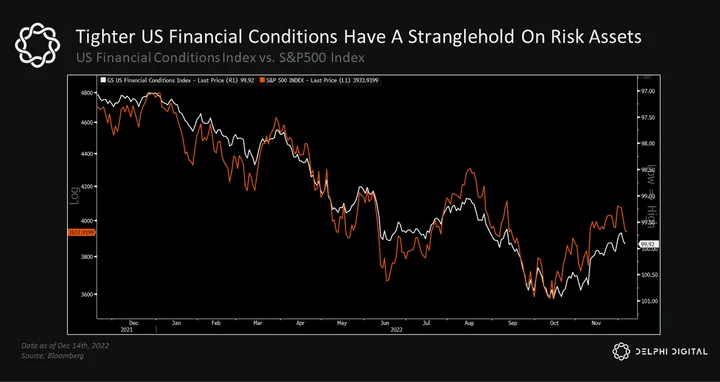
Tighter financial conditions are no friend of markets, especially risk assets whose valuations are grounded in potential growth further out in the future.
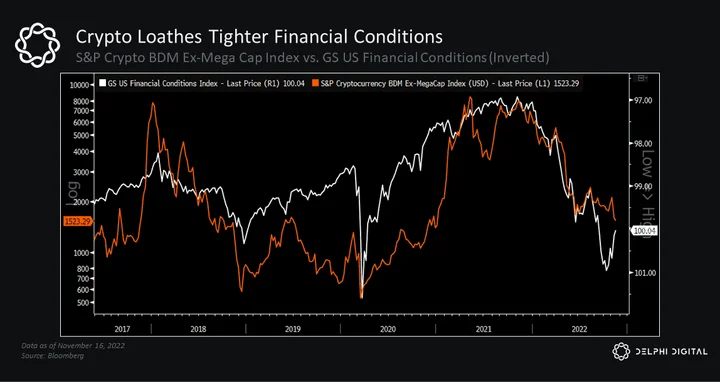
The US has yet to show signs of a liquidity reversal. Liquidity conditions have improved somewhat over the last several weeks, but more improvement is needed to see a sustainable move higher in markets.
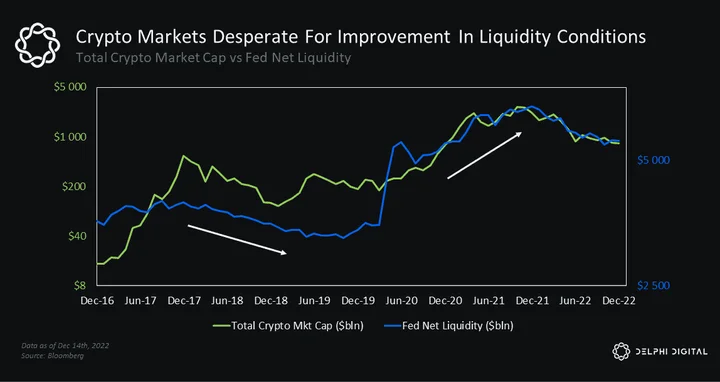
The problem is that an expansion in global liquidity tends to loosen financial conditions, which is the opposite of what the Fed wants right now (at least until they have more confidence that persistently high inflation is officially behind them).
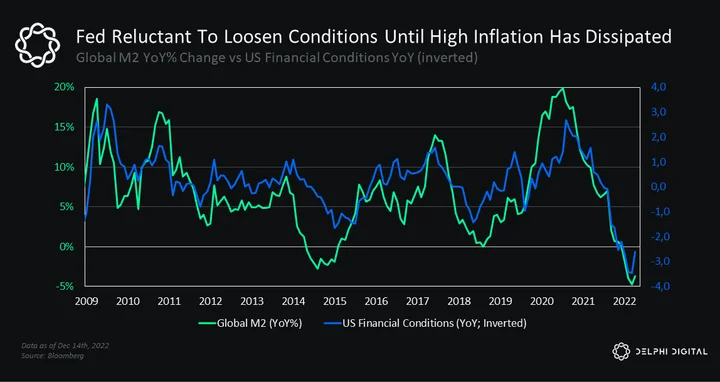
Many pundits are trying to predict when we’ll see a “Fed pivot,” but most are focused on when the Fed will pause rate hikes and if/when they’ll start signaling a new wave of rate cuts.
Rather, we’d argue that what really matters is when we see a reversal in liquidity conditions — that’s what will continue to have an outsized influence on markets and asset prices going forward. We saw this dynamic during the 2017-2018 cycle, which we highlighted at the start of the year:
“…the crypto market had one of its best bull runs on record [during 2017], even as the Fed (and other major central banks) started to raise rates…it wasn’t until liquidity conditions started to deteriorate that BTC topped out [as we saw in early 2018].”
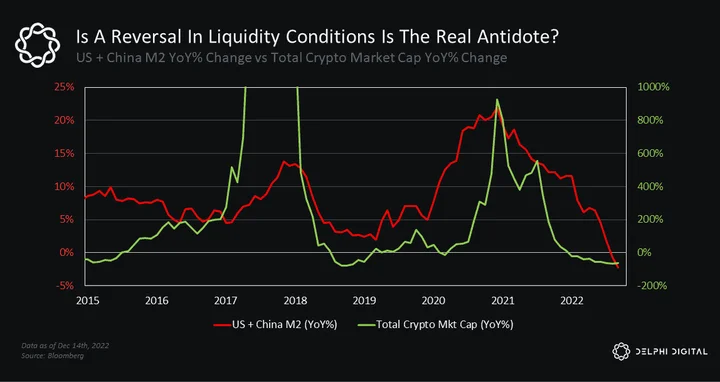
TL;DR: We have to keep our eyes on changes in liquidity.
If the US and China move towards a more expansionary liquidity environment, that would give us stronger conviction that a bottom is truly in the rearview. Longer-duration risk assets will likely lead the way when the market realizes that the liquidity trend reversal has legs.
Liquidity Impacts Crypto Markets Too
This liquidity phenomenon isn’t just present in traditional markets, it’s also prevalent in crypto.
When prices are high, the crypto economy has a bigger balance sheet that can be borrowed against. During the 2020-2021 bull market, we saw the total amount of loans outstanding balloon alongside asset prices.
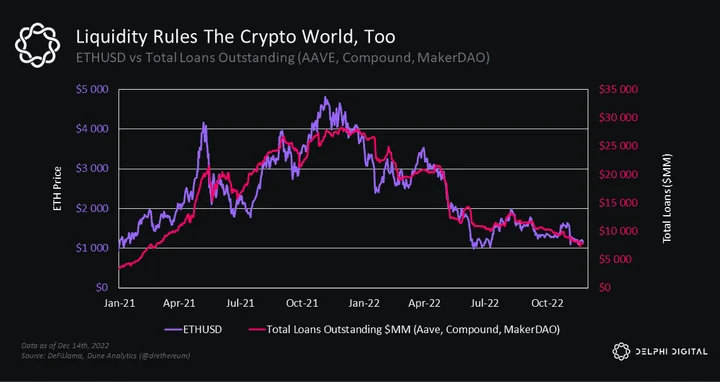
This year, we’ve seen a significant decline in demand for borrowing alongside the value of crypto assets.
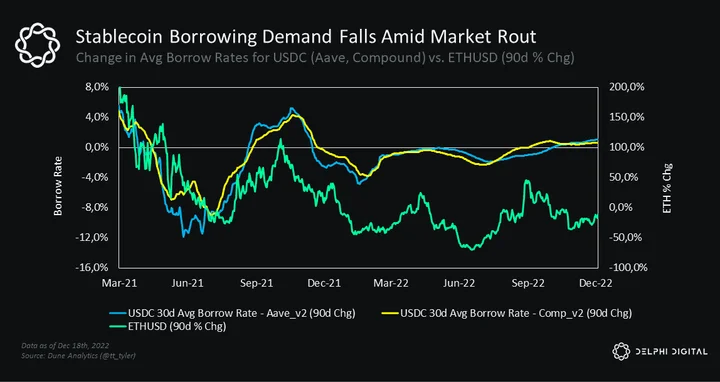
This pullback in borrowing demand has led to a decline in utilization rates for the most prominent collateral types like USDC.
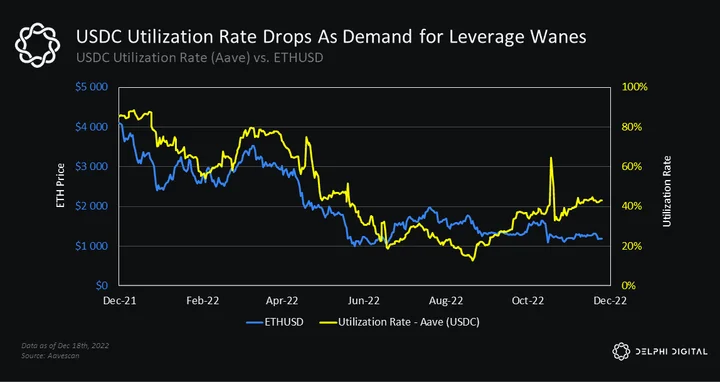
Centralized lenders have historically served as a notable source of liquidity. That’s why headlines about large prime brokers and lenders (like Genesis) needing emergency funding are so impactful. If we see further contraction in credit growth, that means less liquidity for the crypto economy.
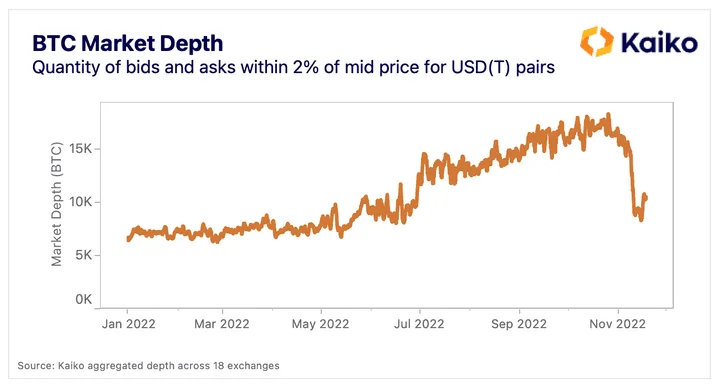
Market makers also got caught up in the FTX collapse. Higher volatility forces MMs to reduce their risk, leading to worsening market liquidity conditions, as seen over the last several weeks. In the immediate aftermath of the FTX collapse, market liquidity for BTC-USD pairs dropped to its lowest level since early June, according to data from Kaiko.
The sizable drop in total stablecoin market cap after the LUNA/UST implosion is another example of a negative liquidity shock this year.
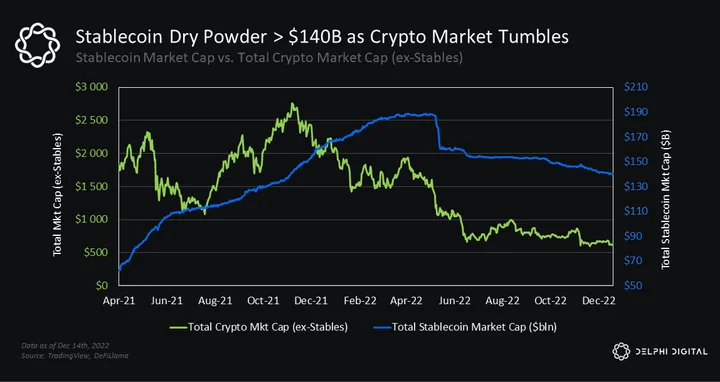
The transition to a risk-off environment has pushed many market participants to stack stables, which has drastically increased their percentage of the total market cap. This represents capital that hasn’t left the crypto economy. Once the market turns, we’d expect to see some of this dry powder re-enter the market.
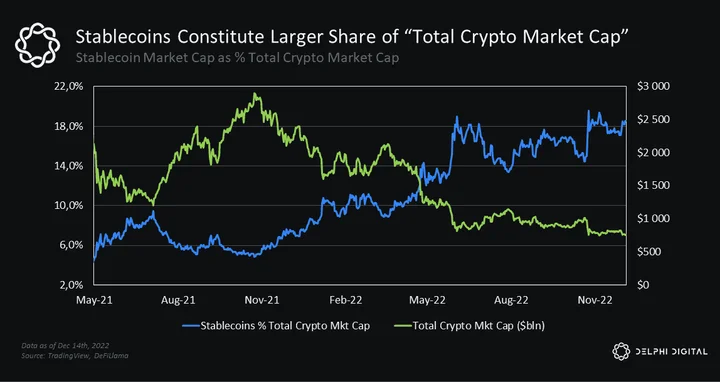
Capital flows have a big impact on asset prices throughout global markets and economies. As we’ve seen, the decline in funding liquidity can have an adverse impact on market liquidity too.
Access to liquidity is one of the biggest risks to the crypto industry over the next 3-6 months. Venture capital funding has fallen considerably year-over-year, which is forcing companies big and small to cut costs and headcounts in an effort to ensure their survival. The back half of the year has been challenging for many teams looking to raise capital for new projects or series funding for existing ventures, and conditions will likely get worse before they get better.
Key Theme #2: The Almighty US Dollar
The strong dollar narrative has been a cornerstone theme of ours throughout 2022. In our January report, Why Bitcoin Is Behaving Like It Should, we cited the likelihood of a strong dollar as a key risk to the crypto market. More specifically, we cautioned that:
-
Growing expectations for higher rates, coupled with a relatively strong economic outlook in the US — at least compared to other regions — have helped breathe new life into the US dollar
-
A stronger greenback implies tighter monetary conditions, which does little favor to assets like BTC that tend to move inversely with the USD
-
The US dollar is extremely important in determining the direction of global markets, especially assets tethered to a currency debasement narrative
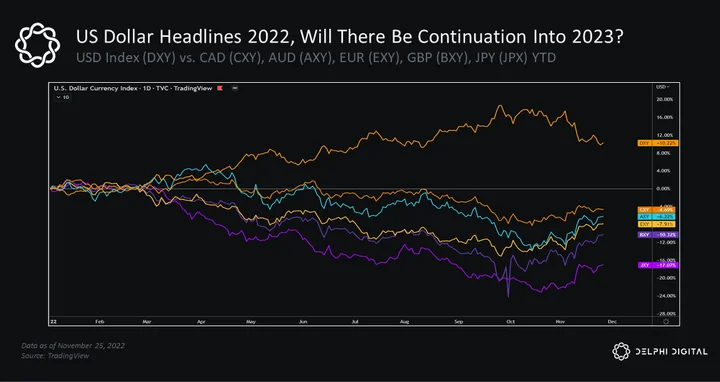
Fast forward a year and we’ve seen the USD strengthen against just about every major currency to the detriment of risk assets like crypto. The 15 months leading up to its late-September peak saw the strongest dollar move we’d seen in decades, so we expected some consolidation after such a rapid rise.
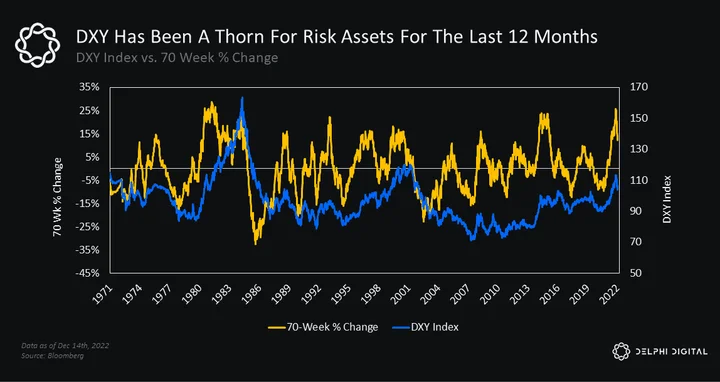
Aggressive monetary tightening, demand for dollars and US safe havens, and the contraction in global liquidity helped propel the dollar to 20-year highs.
Historically, dollar momentum can continue after a healthy consolidation period.
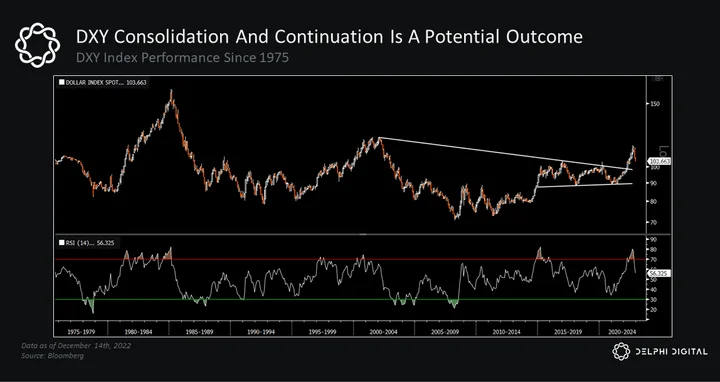
We saw the DXY’s 14-month RSI break above 70 at the end of April for the first time since its 2014-2016 run-up. Shortly after, we cited the importance of USD momentum, specifically how “Similar overbought readings over the last four decades led to a stronger dollar ~78% of the time over the following 12 months [with average gains of ~5.7%]…which would put the DXY index just shy of 111…”
The DXY went on to gain another +10% through late September (peaking at 114), but has since fallen back to the same levels we saw in May.
The worldwide fight against surging inflation has prompted a synchronized tightening of global rates and financial conditions, and the strong dollar continues to be a big part of that story.
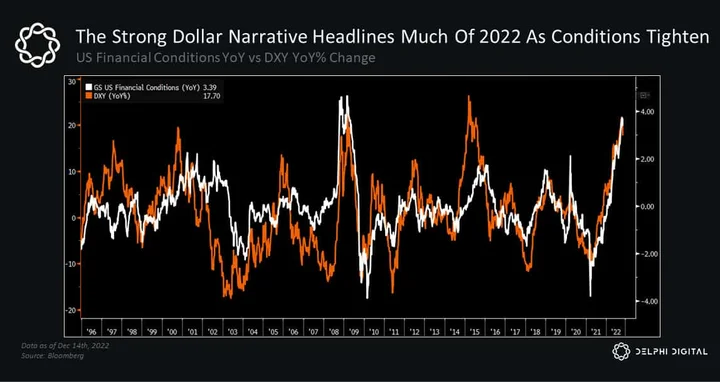
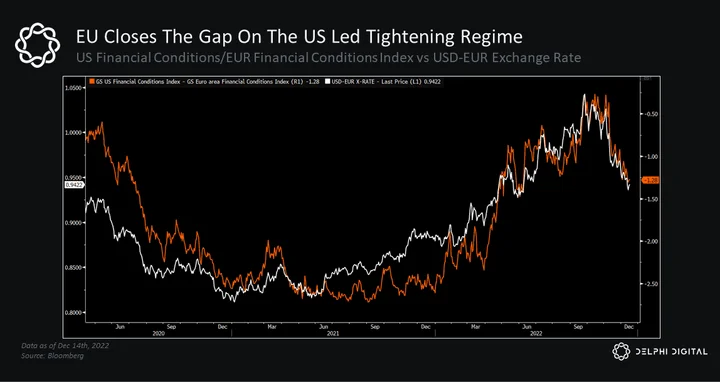
October marked the recent turning point, as peak “tightness” led to somewhat easier financial conditions and the market started repricing future rate hikes as fears shifted from inflation to rising recession risk.
The US led the pack in tightening financial conditions over the last 12 months, but that’s starting to change as inflation and energy pressures inflict hardship on Europe while the Fed gets closer to its expected terminal rate.
The destructive strength of the US dollar has also forced other countries (both advanced and developing) to take action, defending their own currencies in the face of major economic headwinds. Foreign CBs have started selling dollar reserves at an accelerated pace, similar to what we saw after the last strong USD run-up (2015-2017).
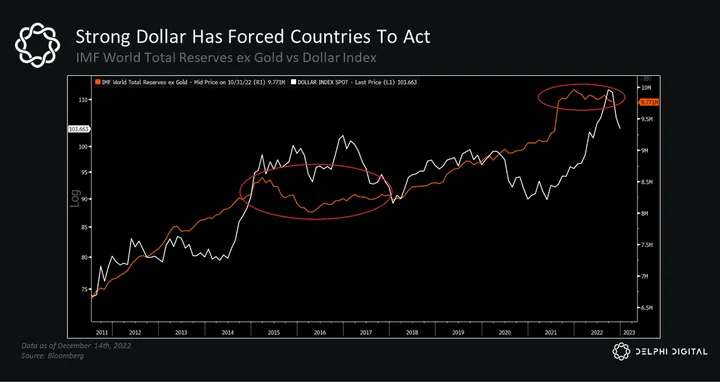
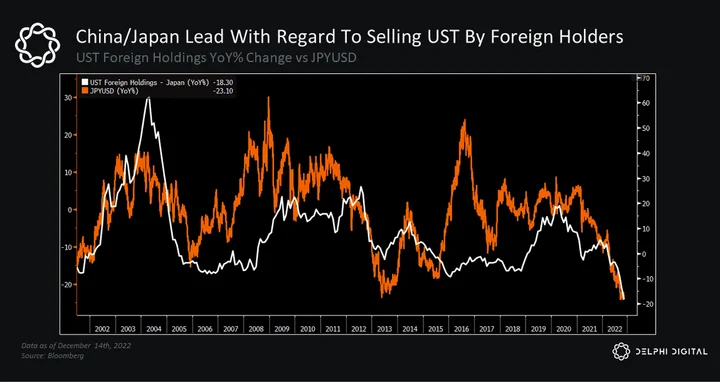
This trend has been led by China and, more recently, Japan (more on this later).
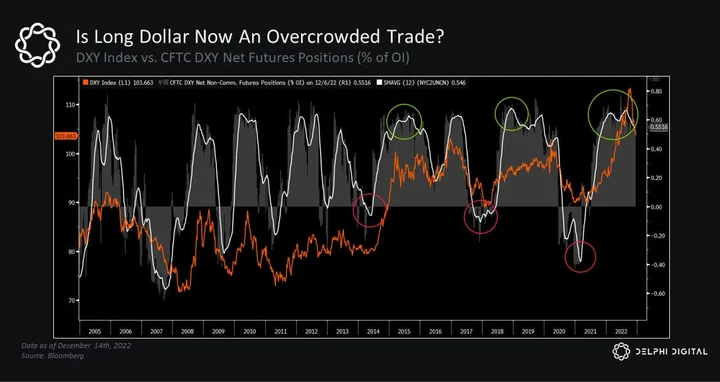
Long dollar is also one of the most overcrowded trades at the moment.
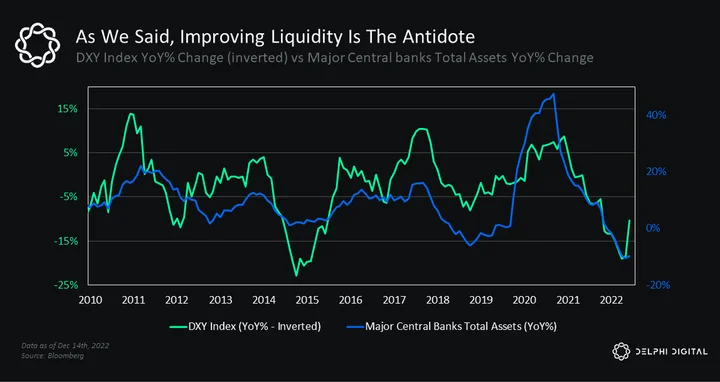
We know global liquidity cycles have an inverse relationship with the dollar. We also noted how the business cycle tends to lead changes in liquidity trends, and the US ISM has been warning of a significant slowdown for months now.
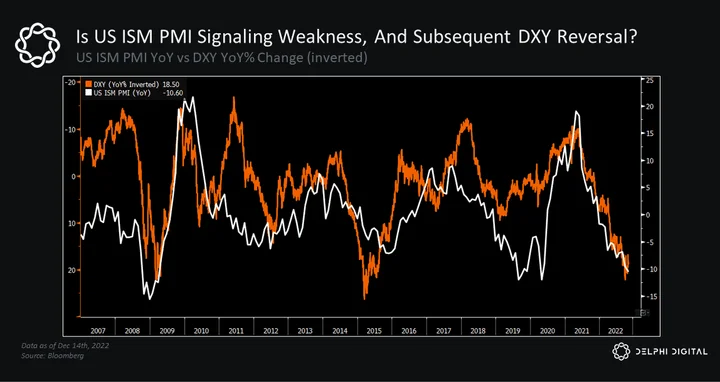
Therefore, if we expect the liquidity cycle to turn (as we’re already seeing early evidence of) to combat this weakening growth outlook, then we’d expect to see a reversal in the USD too.
So, are we out of the woods? Not necessarily. Another wave of dollar strength is still a key risk as we move into 2023. It is important to acknowledge that the Fed remains steadfast in their fight against inflation, and we know through historical precedent that the latter stages of inflation can be sticky, especially if wage growth remains strong.
The dollar’s run-up has already caused a lot of destruction, but the US still looks like the “cleanest shirt in the laundry” to many. If capital flows to the US in search of safety against weakening growth prospects elsewhere — like the eurozone — we could see another dollar rally. Demand for dollars remains high, and dollar liquidity constraints only add more fuel to the fire.
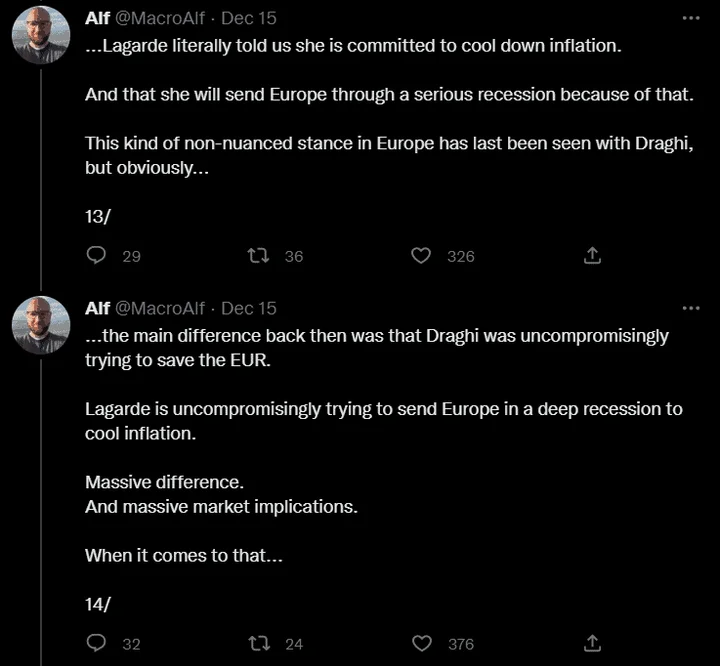
If we get another period of dollar strength, it’d likely mark the end of the latest relief rally. The size and speed of USD fluctuations is critical too. If the USD appreciates too much too fast, the potential for major currency depreciation and debt issues becomes increasingly high — with cracks already emerging in both. Dollar-denominated debt outside the US has grown considerably over the last 15 years, and another leg higher would tighten global financial conditions even further.
Periods of extreme stress often lead to unforeseen breakdowns in financial markets, something crypto participants know all too well at this point.
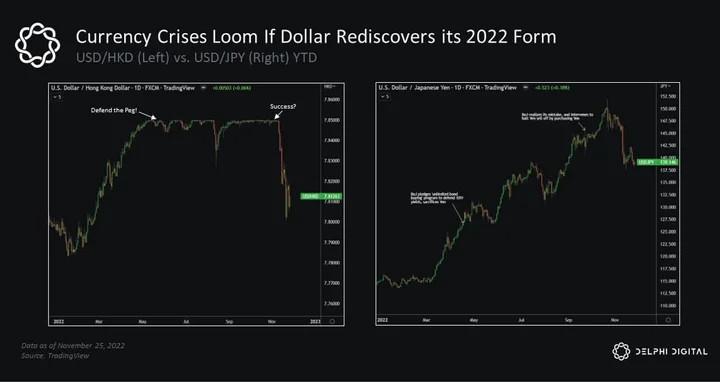
A couple of interesting examples where this stress could manifest are the Hong Kong dollar peg (HKD, above left) and the Japanese yen/JGB market (above right). The above charts are prominent examples of potential cracks in global currency and sovereign debt markets, and ones that could be strained if we see another period of consistent USD strength. The debacle in the UK gilt market is another example that’s lingering in the minds of US officials.
It’s important to note that betting on an HKD depeg has been an infamous “widowmaker” trade over the last 15 years. Also, as this was going to print, the BOJ announced an increase in the yield cap on 10yr JGBs. This sparked a jump in the yen and a new wave of hawkish concerns, as many believe this opens the door for a tighter monetary regime after Japan’s seemingly steadfast dovish stance.
Once again, global liquidity trends have a lot of influence on where we go from here. The fragility of sovereign bond markets may inhibit the Fed’s QT plans, bringing with it a weaker dollar and some much needed relief to markets that’ve lost their luster this year. If policymakers can avoid an outcome in which the dollar remains a strong, consistent threat, then risk assets stand to benefit considerably.
Key Theme #3: The Narrative Shift From Inflation Risk → Recession Risk
Our third key theme for 2023 is the narrative shift from inflationary risks to recession risks. The Fed remains focused on its top priority to curb inflation, and Fed Chair Powell has stated numerous times that a period of sustained, below-trend growth is likely necessary in order to achieve this end.
Obviously, the Fed isn’t in the business of destroying wealth and forcing recessions. While there’s much debate over their effectiveness, Jay Powell & Co. aren’t sitting behind closed doors scheming up ways to inflict as much pain as possible. They’re implementing the policies that they believe have the best chance of combating the highest inflationary pressures seen in decades. Unfortunately, the best antidote for stubbornly high inflation is a recession, and the Fed knows that.
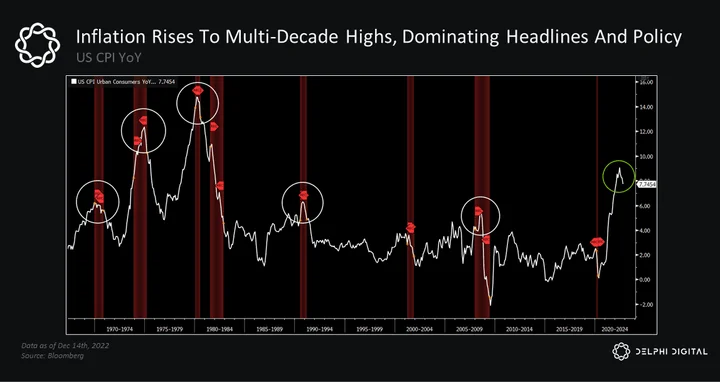
In recent weeks, there have been signs that peak inflation may be behind us, leading to a less aggressive 50bps hike at the December FOMC meeting. However, we believe the Fed will aim to keep financial conditions tight for a prolonged period in order to avoid the perceived mistakes of the 1970s, even if it means an increased risk of recession. The transition from inflation concerns to recession risks is a narrative we believe will dominate the headlines throughout 2023.
Policy Paths Forward
It appears the market is preparing for its next boss to fight.
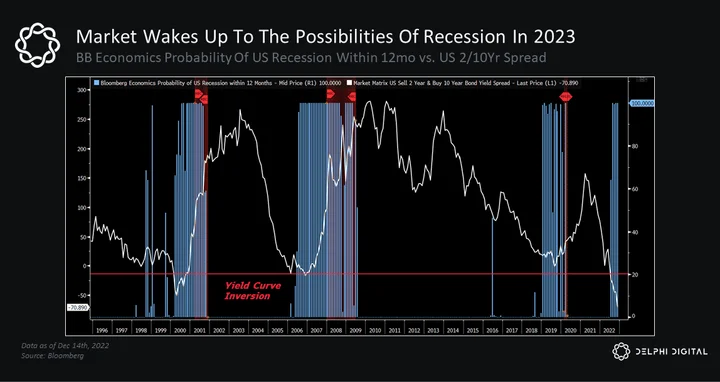
Leading indicators continue pointing to an economic slowdown.
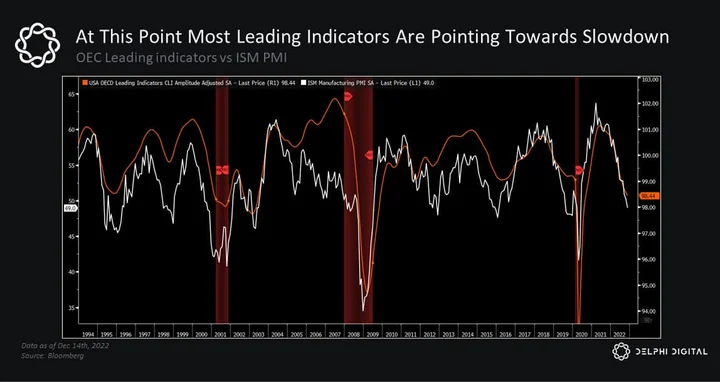
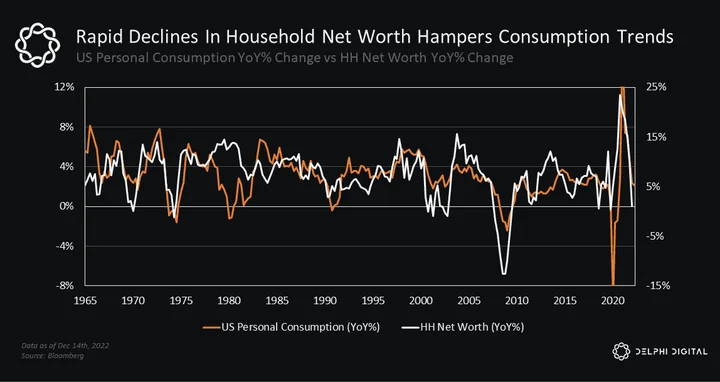
The rapid decline in global liquidity growth and the aggressive tightening of financial conditions this year led to one of the largest wipeouts of net worth we’ve ever seen. The degree of such a negative wealth effect can also hinder personal consumption, but it may not be as effective given the high concentration of wealth in the US (where the top 20% of earners own ~70% of household wealth).
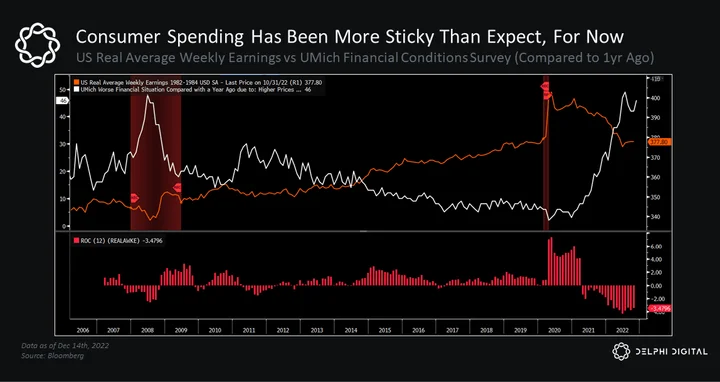
Consumer spending is holding up better than many expected, but inflation continues to eat into purchasing power and real wage growth.
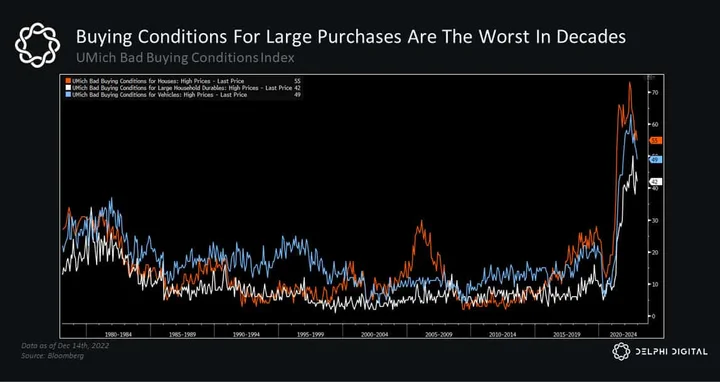
Buying conditions for large expenditures (houses, vehicles, household durable goods) are still near the worst levels we’ve seen in decades.
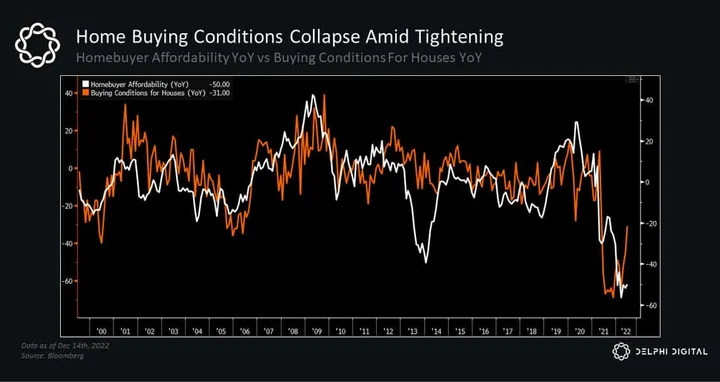
We’ve also seen the fastest decline in homebuying conditions and housing affordability as average rates on a 30-year mortgage still top 6.5%.
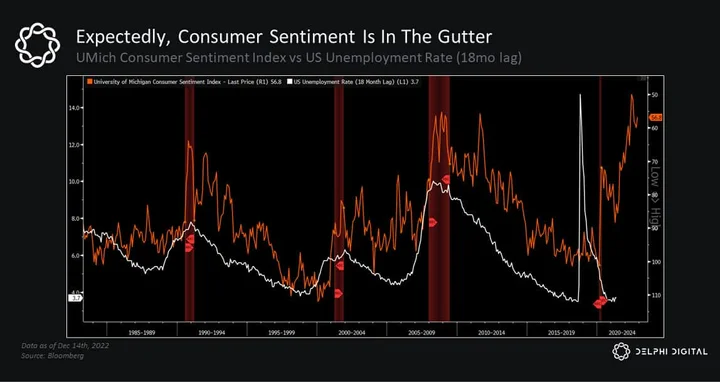
As a result, consumer sentiment has taken a big hit this year. Historically, lower sentiment readings of a similar magnitude have preceded material increases in unemployment (UE rate is lagged 18 months in the below chart).
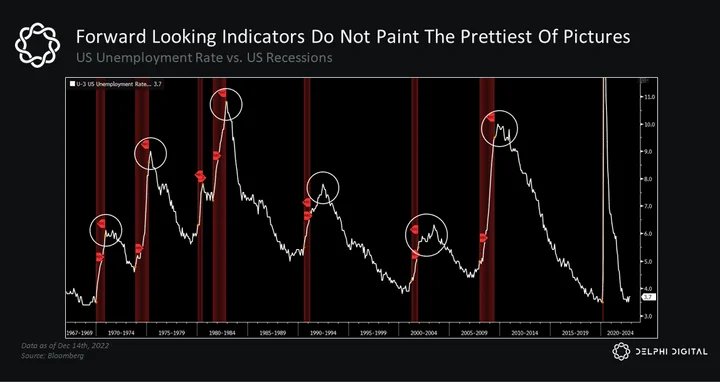
Forward-looking indicators also imply a less optimistic outlook for the labor market, especially if we’re knocking on recession’s door.
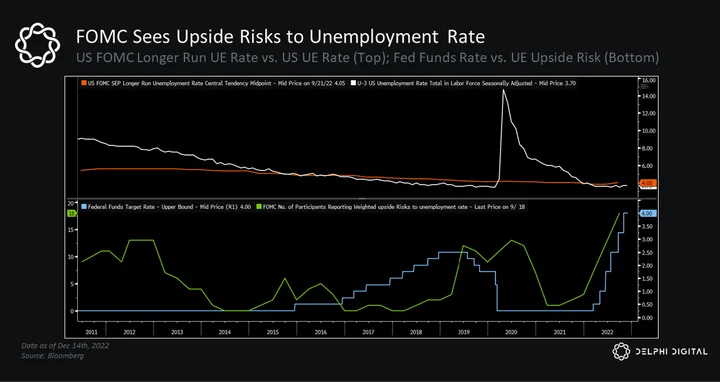
The latest FOMC forecasts show that more Fed members see upside risks to unemployment, but the reported unemployment rate is still hovering near record lows.
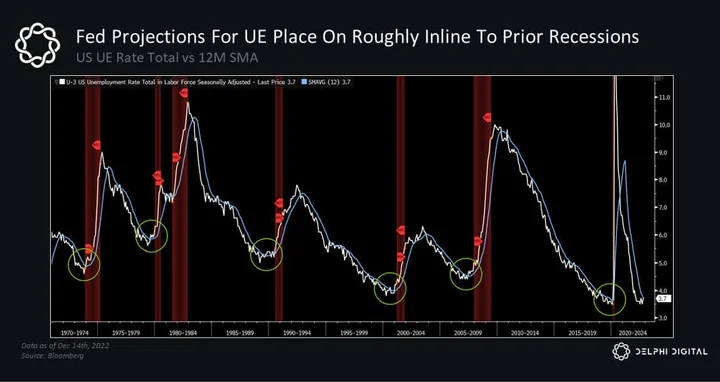
Typically, we see the unemployment rate start to tick up and cross over its 12-month moving average heading into recessions. The current 12-month moving average is right in line with the latest unemployment rate print, but the Fed’s latest forecast shows unemployment rising to 4.6% next year, which would put us on a similar track to prior recession examples.
Financial conditions have tightened at a record pace, which typically doesn’t bode well for future unemployment either (UE rate is lagged 9 months in the below chart).
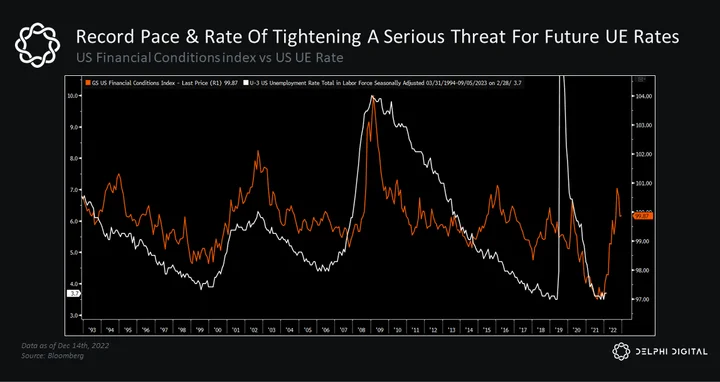
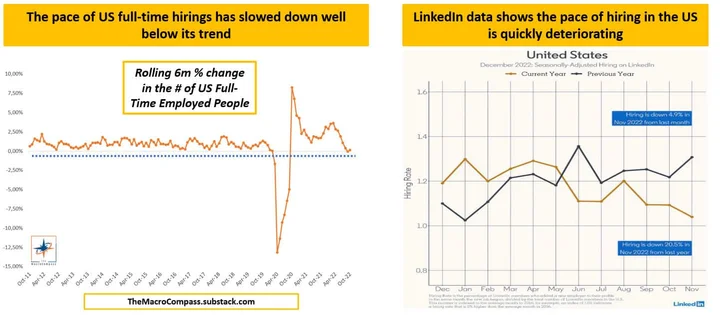
The Fed has cited the resilience in nonfarm payrolls and wage growth as key pressure points that may keep inflation elevated. However, alternative data and dissections of the US labor market are telling a different story.
“A good gauge for the current state of the US labor market is the pace of full-time hirings (excluding multiple jobholders). On a rolling 6-month % change basis, the momentum in US full-time hiring is basically flat and in line with the weakest prints (ex-pandemic) of the last 10 years.” – The Macro Compass
Alf Peccatiello, founder of The Macro Compass, also shows how rapid changes in US financial conditions tend to “lead job creation trends by 9 months.”
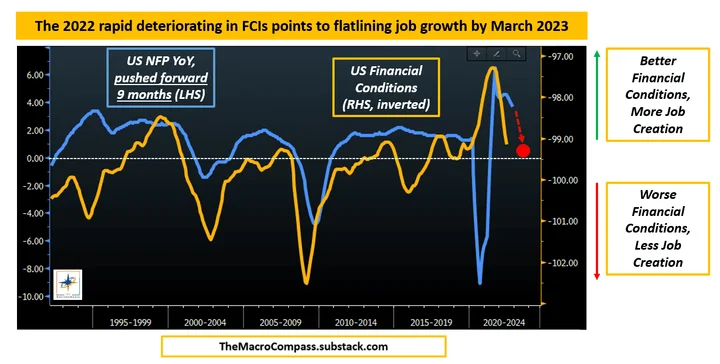
The question now is whether policymakers will wait for unemployment to signal a weakening labor market in order to justify a transition away from tighter policy, or if they’ll lean on forward-looking indicators to get ahead of what’s expected to come. Rising recession risks mean peak labor market tightness may be in the rearview, as wage growth tends to fall alongside rising unemployment (both of which are lagging indicators).
The Fed’s credibility rests on its ability to rein in inflation, no matter the cost. Several forward-looking indicators imply economic weakness ahead, setting up 2023 as a year where recession worries take center stage.
Until Something Breaks
If we avoid a serious recession and policymakers somehow manage to engineer a “soft landing,” it’s less likely the Fed will make any drastic pivot — that is unless something breaks and their hand is forced.
Liquidity conditions have been deteriorating in the world’s most important securities market (US Treasuries), the proper functioning of which is critical for the entire global financial system. We’ve been talking about the growing fragility of the US Treasury market for months, and it’s a situation we continue to monitor closely.
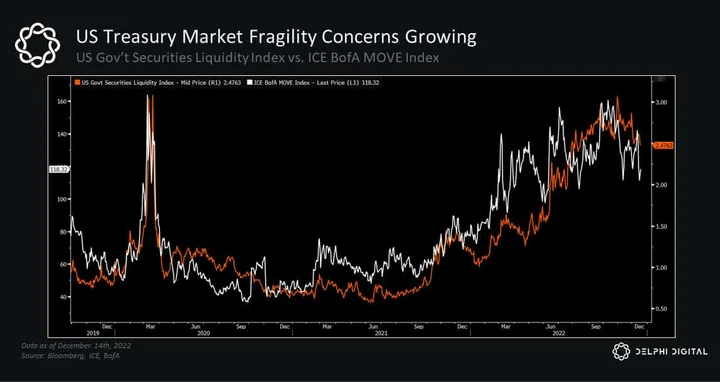
Historically, these types of conditions tend to be a bullish setup for bonds. But so far, Treasury yields have deviated from their historical trend, even as the business cycle continues to show signs of weakening.
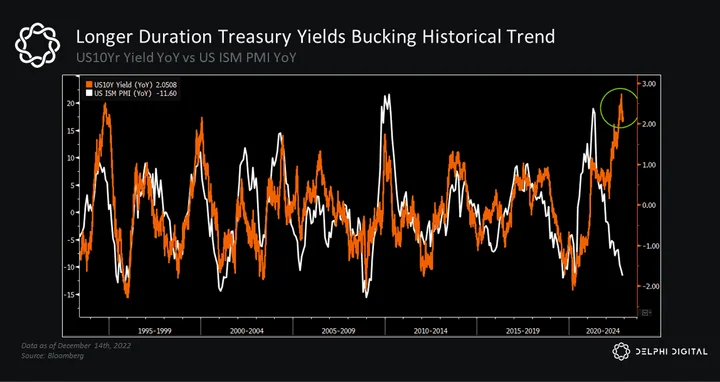
US Treasuries are the world’s risk-free asset. They’re the pillar of global FX reserves, they underpin global risk portfolios, and they’re one of the most prominent forms of accepted collateral. There is no comparable alternative, which is why an illiquid Treasury market is a real systemic risk. If the market loses faith in the ability to accurately price — and importantly sell — the global risk-free asset, the whole system starts to break down.
Bond losses also reduce the value of pledged collateral, which increases margin calls and reduces leverage in the financial system. This can have adverse consequences for market liquidity and can further dampen growth when credit becomes more scarce.
“The tide of the last bull market is rapidly going out and leaving many leveraged investors dangerously exposed. The irony is that, on this occasion, much of this leverage is concentrated in conventional ‘safe’ asset markets, like government bonds, rather than traditionally in the speculative ones.” – CrossBorder Capital
Illiquidity leads to volatility, which leads to even less liquidity and more volatility. This is a real risk and has the potential to break the Fed’s hawkish spirit. If this were to materialize, the infamous “Fed pivot” would not be caused by a victory over inflation, but rather because policymakers have no choice but to step in and provide liquidity as the backstop-of-last-resort. The consequences of sitting on the sidelines would be too dire at that point.
In our view, this has become a higher probability scenario as we move into 2023. Financial stresses have largely been isolated incidents thus far, but history tells us that spillover risk and contagion can become very real, very quick.
Markets = Supply and Demand
All markets are a function of supply and demand. Fortunately for the US, the demand for US Treasuries (USTs) is quite massive. Foreign buyers (public and private), the Fed, retirement funds, banks, and money market funds are all large holders of Treasuries. But several big buyers are turning into net sellers just as the Fed has started to remove itself from the equation.
Foreign central banks have been net sellers of USTs since 2014, which many have cited as a big risk to UST demand (especially since foreign CBs are large holders of longer-duration UST notes + bonds). The foreign private sector more than offset that reduction, but foreign official holders have accelerated their selling this year as private sector holdings have plateaued (we noted Japan is a key example of this).
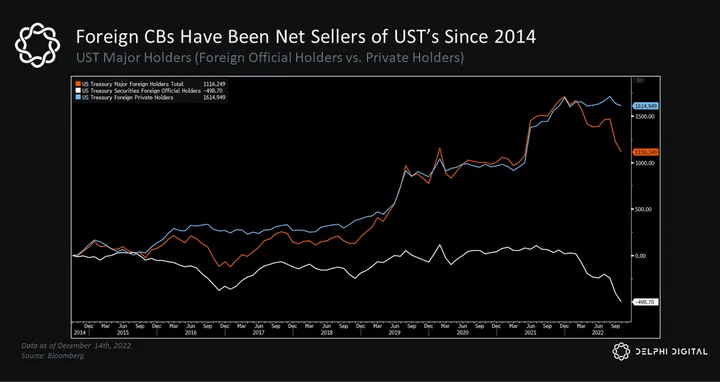
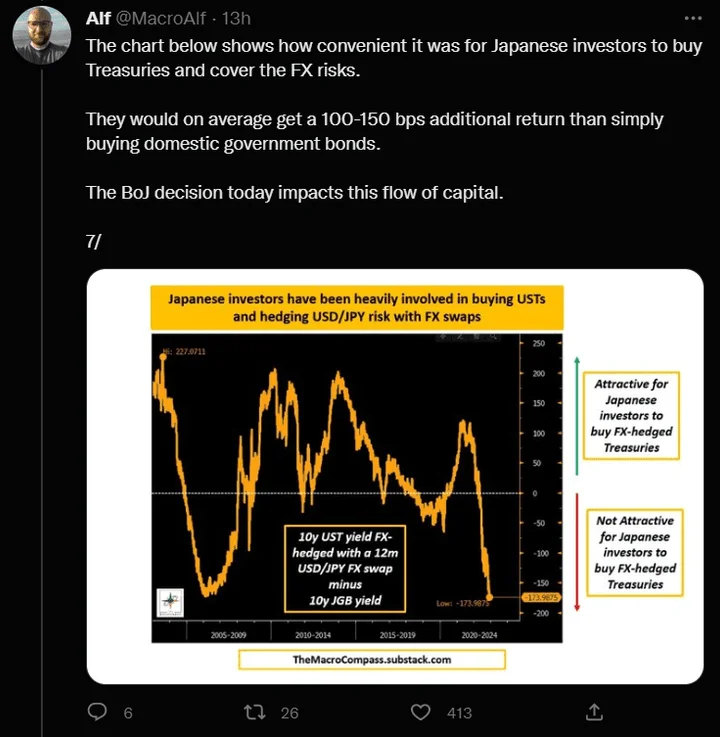
The BOJ’s move to increase the yield cap on 10yr JGBs is the latest wrench in the UST demand story.
Banks are another source of UST demand, but their dynamics are changing too. Banks saw a significant increase in deposits in 2020-2021, and in order to earn a return on that cash, banks could deposit it with the Fed, buy securities, or lend it out. But the risk/reward tradeoff for each has evolved over the last 12-18 months.
Initially, deposit growth was offset by a spike in demand for borrowing. But massive spending programs and a recovering economy helped pad the pockets of consumers and businesses alike, causing a decline in loan demand. This pushed banks to buy securities to generate yield on their deposits.
Over the last 12 months, we’ve seen a steep decline in bank reserves (to the tune of $1.1T) while bank lending has been on the rise, ultimately leaving less liquidity chasing alternatives (like USTs). Bank security holdings peaked in February and have declined ~$300B since August as loan growth picked up (offering the prospect of higher returns).
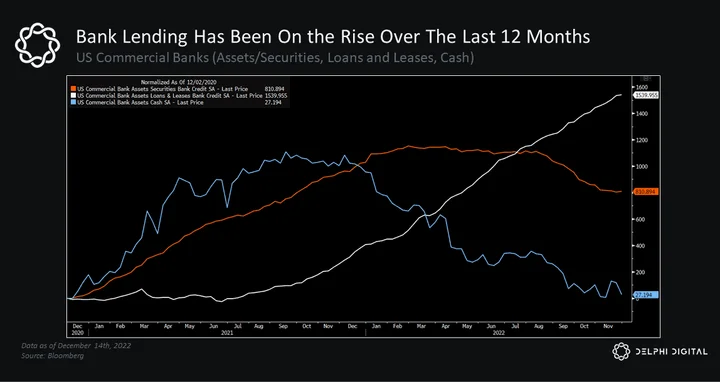
We could see an acceleration in this trend should demand for borrowing remain strong and bank reserves fall further. The Fed has yet to fully remove itself though, and may try to thread the needle of QT optics (UST runoffs) with liquidity provisions to shore up financial stability.
Deposits have also fallen by ~$500B since their April peak as assets in money market funds (MMFs) continue to swell. But MMFs have been net sellers of USTs in favor of parking funds in the RRP where they can earn a higher risk-free return on cash.
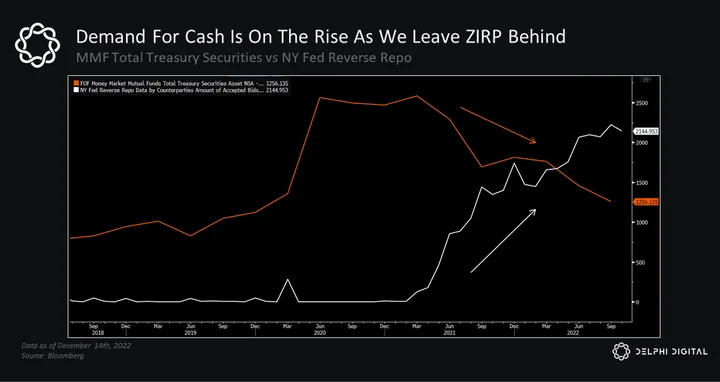
We’ve left the era of “free money” where cash was plentiful and accessible. Demand for cash is on the rise, and so is the competition for it.
The RRP has been popularized because it offers access to the most liquid income-generating USD assets. It is important to note that funds held in the RRP represent liquidity being taken out of the financial system. In other words, they are funds not being used or invested elsewhere (like in financial/productive assets). We’ve seen how the contraction in liquidity has already had a significant impact on financial assets.
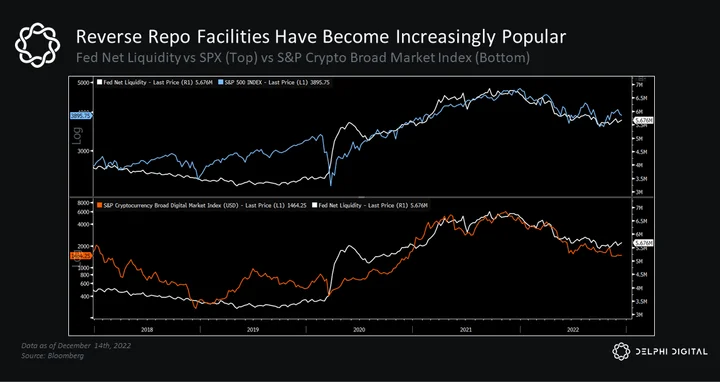
Major buyers of USTs appear to be pulling back just as new UST issuance is expected to ramp up over the next 12-24 months. This new supply will have to be absorbed by other participants if the Fed remains on the sidelines (or doesn’t act to source liquidity elsewhere).
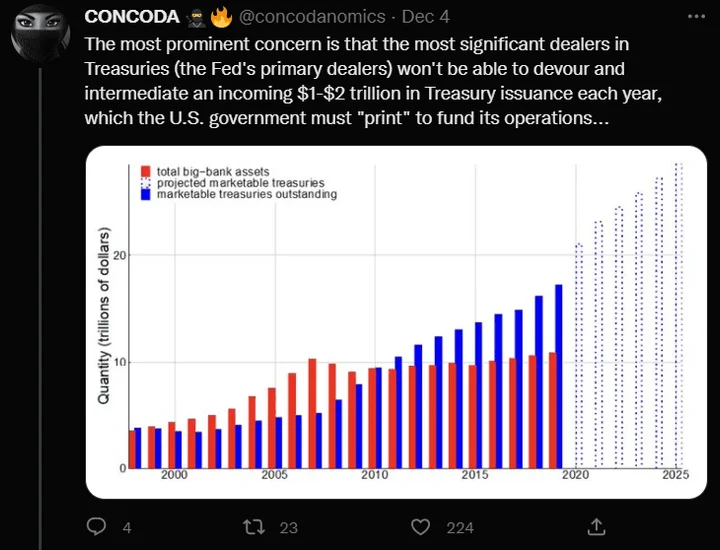
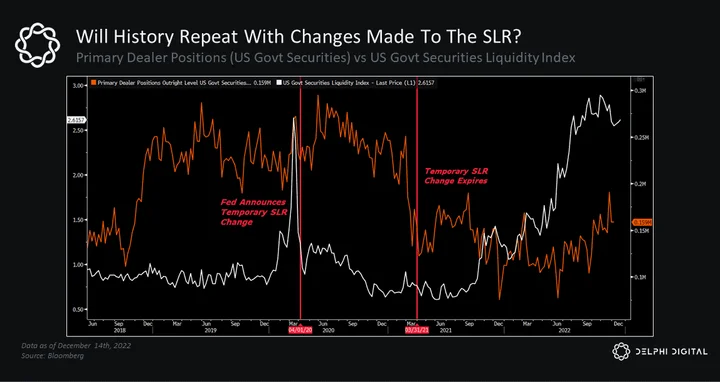
Policymakers do have other ways to improve liquidity conditions. They could reinstate the “temporary” changes to SLR, which currently includes bank reserves and Treasuries in bank capital ratios, thus freeing up primary dealers to absorb new Treasury supply coming to market.
The March 2020 market selloff was a prime example of the impact liquidity drying up can have. Everyone rushed to sell assets for cash, but even one of the most liquid markets (Treasuries) couldn’t handle the panic — which sent borrowing costs skyrocketing. Banks saw a huge influx of deposits, but due to balance sheet constraints they were hamstrung from stepping in. This pushed the Fed to instate a temporary exclusion of Treasuries and bank reserves from SLR calculations, which gave banks more capacity to absorb deposits, buy more bonds, and extend credit to households and businesses in need.
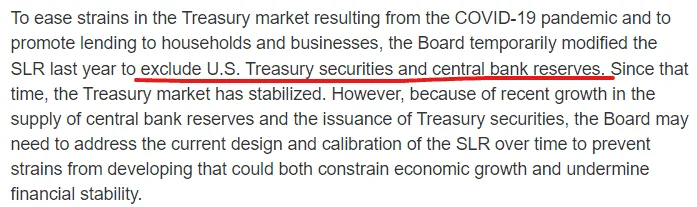
After the Treasury market stabilized, the Fed lifted the temporary exclusion in March 2021, much to the dismay of some pundits who argued it would lead to further disruptions in the Treasury market.
Treasury buybacks are being floated, which could alleviate liquidity pressures by issuing new T-bills (which trade more easily) to buy longer-dated coupons and off-the-run bonds (which are less liquid). The increased supply of bills would likely be gobbled up by MMFs and other investors/institutions seeking safe, high-quality assets to hold.
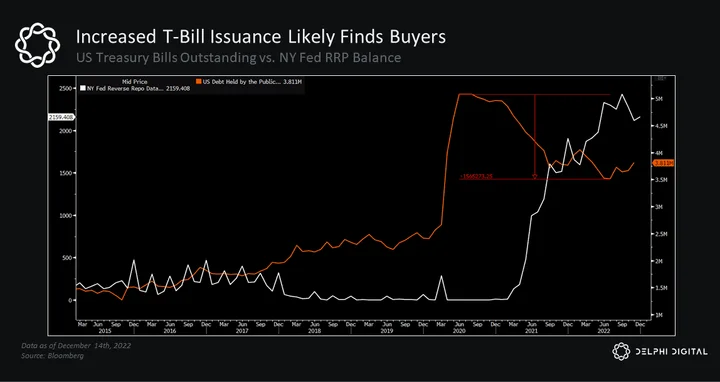
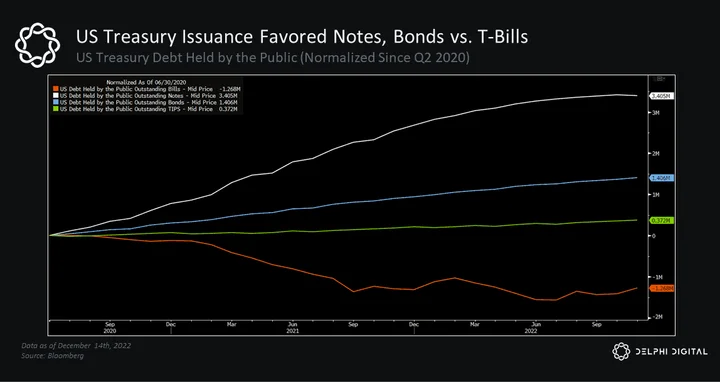
We’ve seen a shortage of “safe assets,” including the supply of T-bills. There’s been a substantial decline in net issuance of T-bills over the last 12-18 months with the US Treasury instead ramping up net issuance of longer-dated notes and bonds.
The Fed’s standing repo facility is another potential backstop if liquidity conditions worsen. The Fed could also reduce the cap on funds that counterparties can submit for the RRP, incentivizing excess cash to flow elsewhere (like newly issued T-bills) and thus increasing liquidity in the financial system.
All of these things could improve liquidity conditions without major Fed intervention. But if these measures prove inadequate, the Fed may be forced back to the table. Providing liquidity as a backstop to keep the financial system humming is a tradeoff the Fed is quite familiar with, especially if its active intervention would calm the market’s concerns of a potential liquidity crunch.
The pullback in global liquidity is starting to expose vulnerabilities in pockets of the financial system. Fed intervention may be spontaneous at first, acting only as needed. In time, though, we believe the need for QE will become increasingly apparent as UST supply outpaces demand and global liquidity constraints threaten to keep a lid on tighter financial conditions that hinder a sustainable economic recovery. The Fed may be faced with a pivotal decision (poor pun intended) as 2023 gets underway.
As a side note, massive government spending in the aftermath of COVID likely created some recency bias in the general population, who may push for another wave of stimulus if their financial situations get bad enough. However unpopular, it wouldn’t be all that surprising to see fiscal policymakers intervene again, which would only add more strain on UST supply-demand dynamics. This isn’t the highest probability outcome right now in our view, though.
Key Theme #4: The Great “Recoupling”
As we know, crypto isn’t the only market struggling this year. For better or worse, everything has been distilled down to one big macro trade with the consistently high correlation between crypto and traditional risk assets. This begs the question — can crypto finally decouple from legacy markets?
Bitcoin has struggled against this backdrop, but it is not alone. ETH has suffered at the hands of the same macro headwinds that BTC has (tighter financial conditions, liquidity contractions, stronger dollar), even despite the most bullish narrative any crypto asset has ever had at its back.
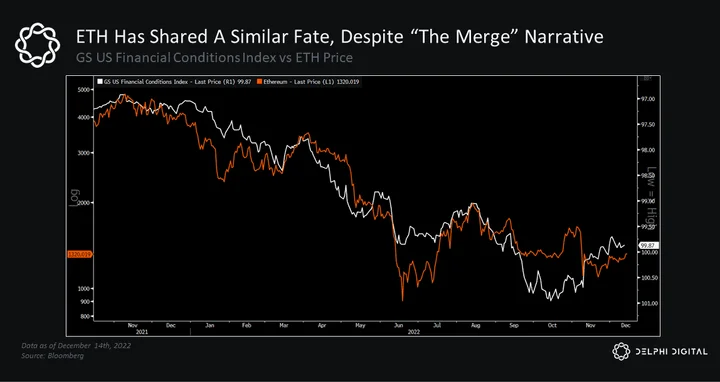
In order for us to have any strong conviction in the idea of a break in the crypto <> macro relationship, we would need to see more sustained evidence of divergences in these markets, and that hasn’t really materialized yet. If anything, crypto has been left behind over the last several weeks in the aftermath of the FTX collapse.
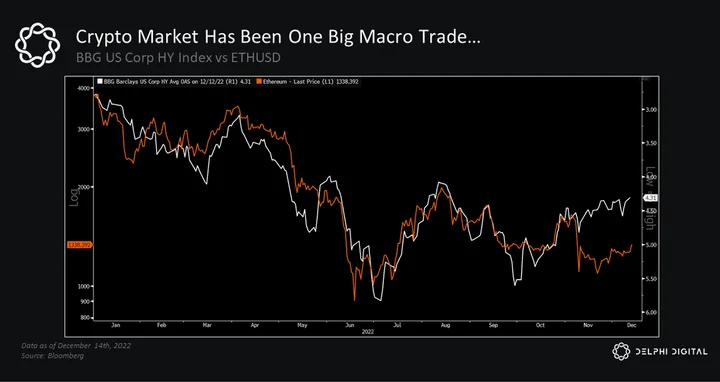
The correlation between many crypto assets and higher beta stocks remains high.
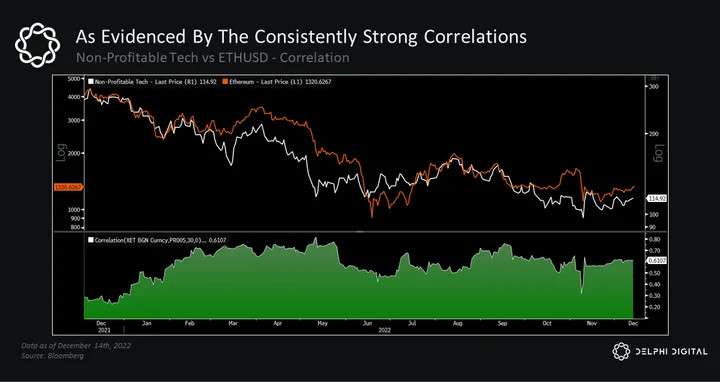
We expect this trend will persist, at least directionally, given the material overlap in current headwinds and potential tailwinds for both equities and crypto.
Bear Markets and Recessions
We know that BTC is more reflexive during periods of high volatility, and we’ve seen it latch on to momentum in equity markets. Assuming the two remain positively correlated, the next question is what’s next for equities?
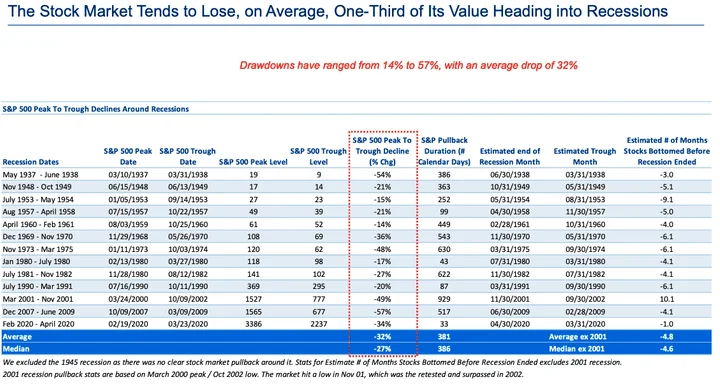
Looking at prior recessions, the SPX experienced a ~48% and ~56% peak-to-trough drawdown after the dotcom bubble and the GFC, respectively. If we include March 2020, the average drawdown of the last three recessions equates to a 45% decline from prior highs.
-
At its depths in mid-October, the SPX marked a 25% drawdown from its peak at the start of the year. If the index were to see a 45% peak-to-trough drawdown, it would need to fall to ~2,650 (from its current level of ~4,000).
The SPX also broke below its 200-week SMA in each of the last three recessions (including 2020). After breaking this level in 2001, the index fell another 37%. We saw a 48% decline after it lost the 200-week SMA in 2008, and another 17% decline in March 2020 (though this dip was short-lived).
-
In October, the SPX tested its 200-week SMA before rebounding >10%. If the SPX were to follow the recession playbook of the last 25 years, a 30% drop below its 200-week SMA would put the index around 2,550-2,600.
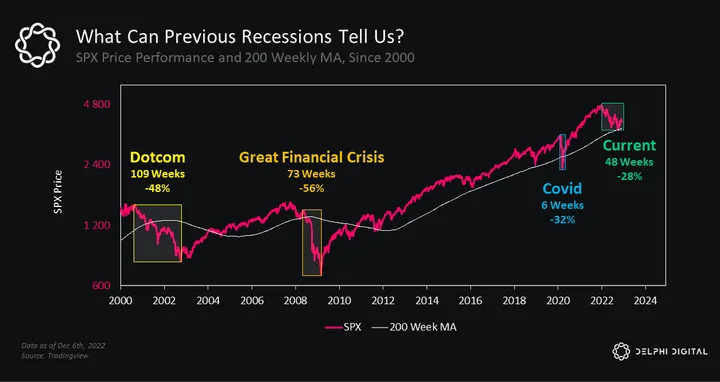
Moreover, the duration of the last two major recession drawdowns (ex-2020) lasted 109 weeks and 73 weeks (the duration of the March 2020 drawdown was a mere five weeks before policymakers jumped in as a backstop). For comparison, the current bear market cycle has lasted 50 weeks so far.
-
If we were to take the average duration, % peak-to-trough drawdowns, and the average % decline below the 200-week SMA of these more recent recessions, it would imply an SPX bottom in October 2023 with an index value in the range of ~2,550-2,650.
-
If, however, the SPX sees a peak-to-trough drawdown in line with its long-term average around historical recessions (-32%), its implied bottom would be closer to 3,260 (~18% lower than current levels) and it would occur in Q1 2023.
Rising Recession Risk
Stock prices are a function of 1) expectations for future earnings (and cash flows), and 2) the price investors are willing to pay for those expected earnings and cash flows (measured by price multiples like P/E, P/CF, etc.).
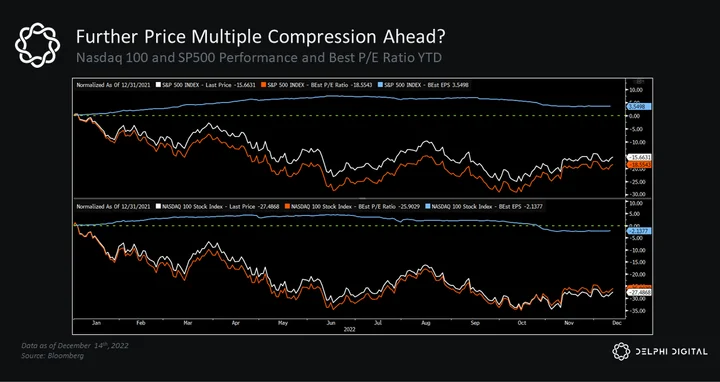
The vast majority of this year’s decline in equity markets can be attributed to multiple compression rather than lower earnings estimates, which haven’t fallen as much as one would expect in an environment where recession risks are climbing. So far, NTM EPS estimates for the S&P 500 have declined ~4% from their peak in June (its current NTM P/E is 17.5x after suffering a ~19% decline YTD).
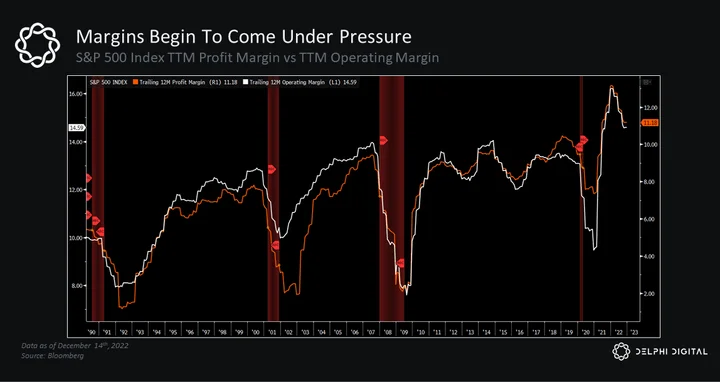
Worsening fundamentals caused by a weaker economy, and the spillover effects of persistently high inflation (lower consumer spending + higher cost pressures), could drag on margins and corporate earnings next year — especially if wage growth remains sticky. Margins tend to roll over heading into recessions, but typically bottom after.
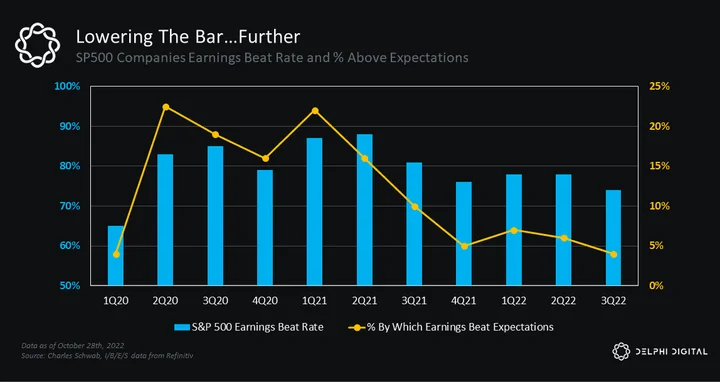
The resilience of Q3 earnings may be masking the challenges ahead.
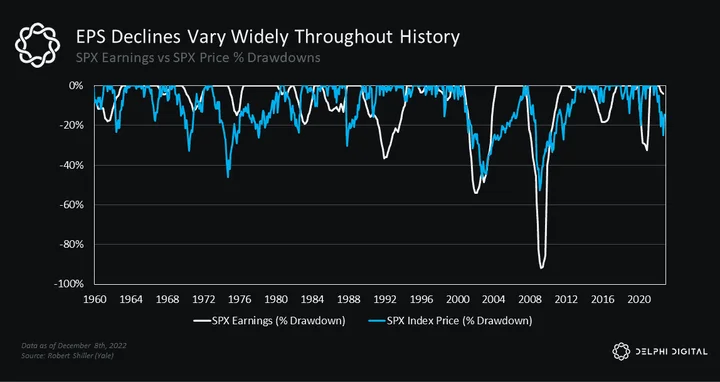
Peak-to-trough EPS declines for the S&P 500 varied greatly during past recessions. The minimum decline in trailing 12-month earnings over the last 40 years was ~20%.
If we zoom in on more recent recessions (2000, 2008, 2020), we find the average peak-to-trough decline in NTM EPS estimates was ~26% (2000-2001 and 2020 saw ~20% declines, with 2008 doubling that).
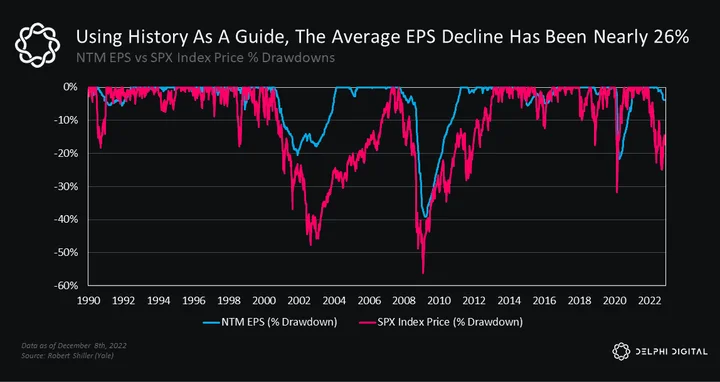
Earnings expectations for 2023 have started to come down, but history suggests we still have more room to fall before we see a bottom in earnings forecasts. If we are headed for a recession next year, one would expect to see earnings estimates contract as they have in prior instances. The bottom panel on the chart below shows the year-over-year change in NTM EPS estimates for the S&P 500.
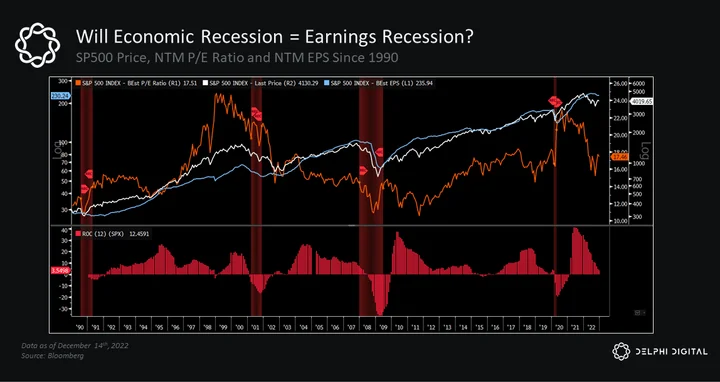
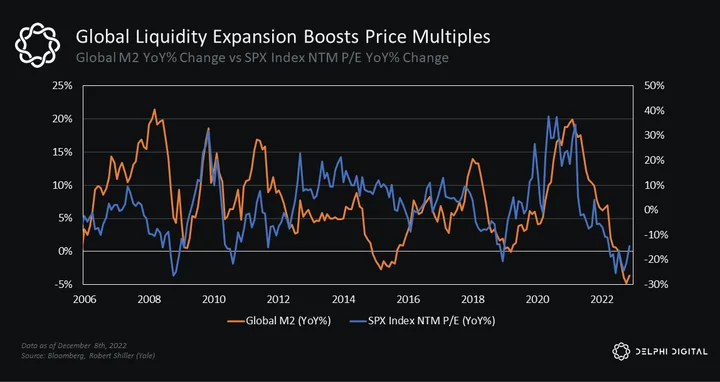
An earnings recession and a further contraction in price multiples would be a double whammy for stocks. Price multiples tend to compress when liquidity contracts and financial conditions tighten.
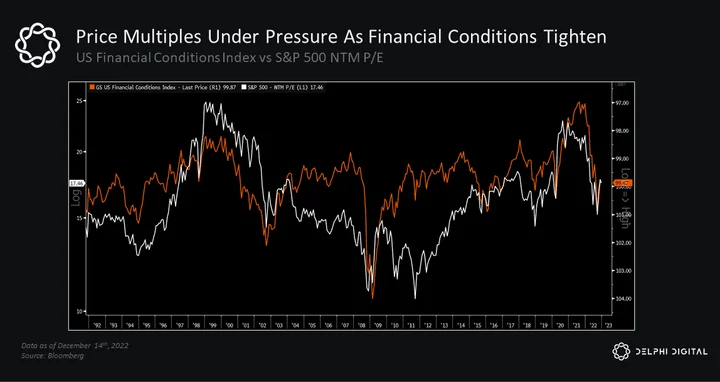
Price multiples also tend to take an even bigger hit around recessions. The S&P 500’s forward P/E fell to ~14x when the index bottomed in late 2002. It touched the same level briefly again in March 2020, and it dropped as low as 9.5x in the depths of Q4 2008.
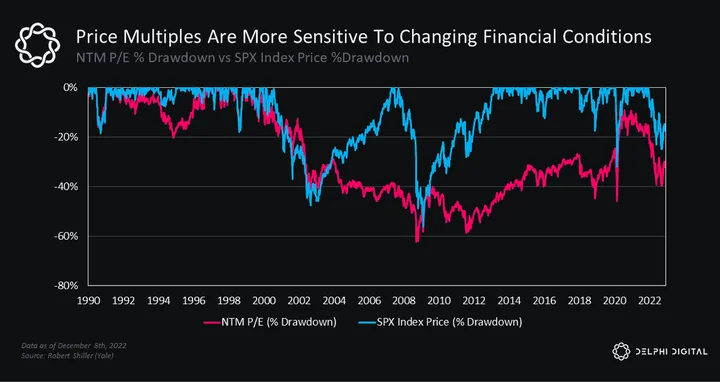
The question now is what flavor of recession, if any, will we see and what implications it would have for equities next year.
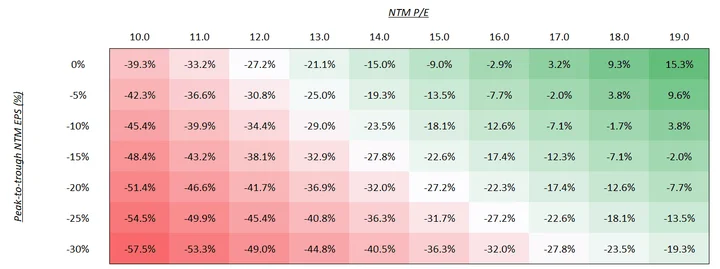
The worst case scenario in our view is if we get a recession next year and global liquidity conditions remain tight. If the SPX’s NTM P/E were to fall to ~14x and we get a 20% peak-to-trough decline in NTM EPS (in line with prior recessions), the index’s implied price would be ~2,675, indicating another 33% drawdown from current levels (and a total peak-to-trough drawdown of ~45%).
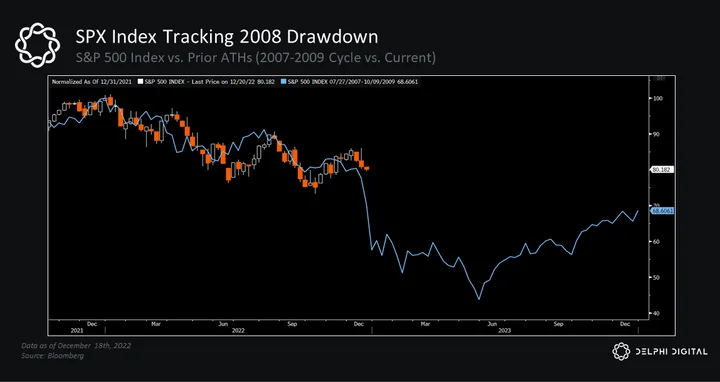
So far, the S&P 500 is tracking its 2008 trend pretty closely.
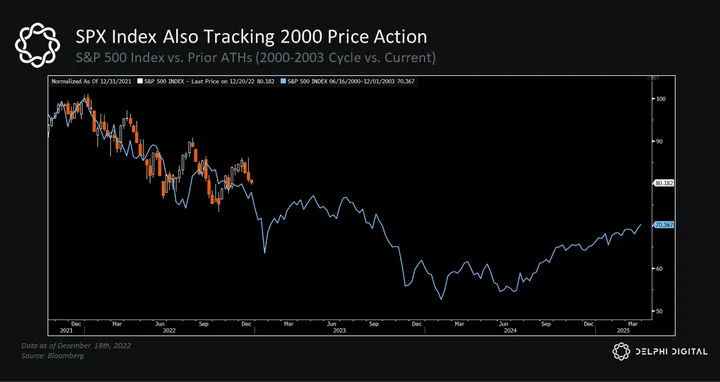
We see a similar picture if we compare the SPX price action to its 2000 peak (using the September 2000 peak after the SPX retested its prior high).
We did just go through one of the fastest rate-hike cycles in several decades. Prior hiking cycles led to yield curve inversions, which are one of the most widely tracked recession signals.
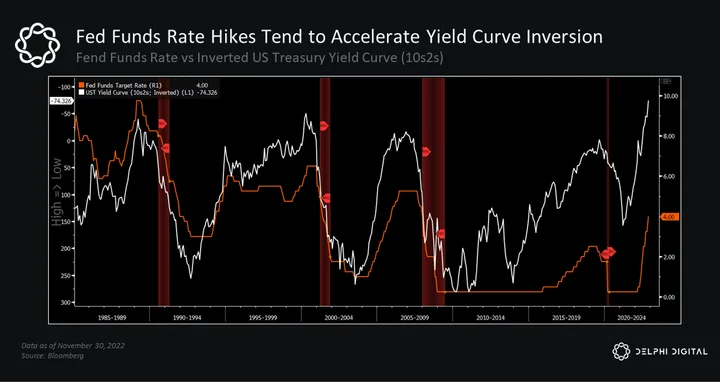
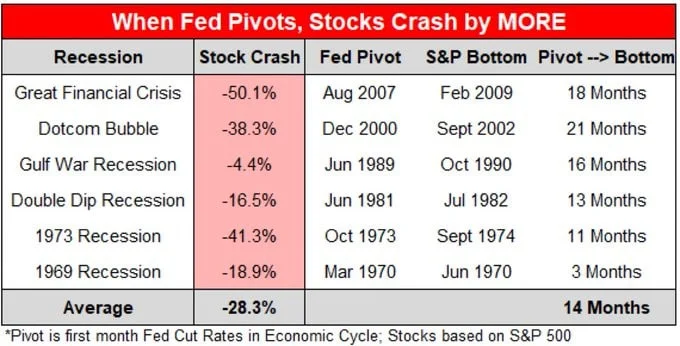
But equities tend to suffer painful drawdowns when the yield curve starts to re-steepen, as that’s when the market starts pricing in lower rates in response to weakening economic conditions. History shows that equities can perform quite poorly in the immediate aftermath of a Fed pivot.
Interestingly, a recent BofA note argued that the current selloff “has been more linked to higher rate volatility than higher rates.” That’s true, because the rate of change in interest rates matters more than the level of rates.
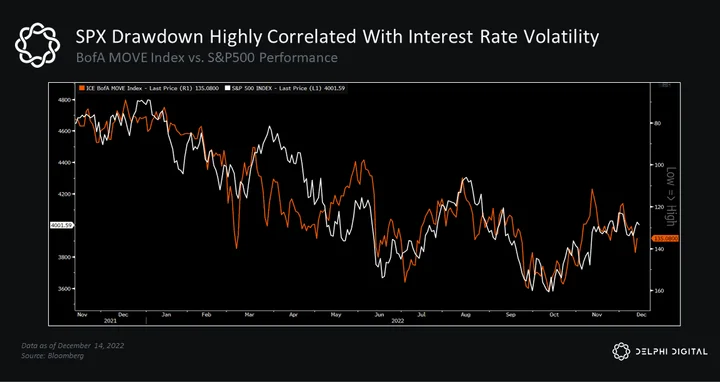
The longer that higher rates and tighter financial conditions persist, the greater the chances of recession. 2023 is already shaping up to be a real balancing act for policymakers.
If we get a more shallow earnings recession and price multiples fail to retest prior lows, equities could see another leg lower but avoid the type of steep drawdowns that historically coincide with deep or prolonged recessions.
Further downside in risk assets could also be mitigated by an expansion in global liquidity. Price multiples for equities expanded rapidly after massive stimulus in 2020, so an expansionary environment could bolster prices even if the outlook for corporate earnings remains tepid.
Crypto Is the Canary
The crypto market is one of the purest bets on global liquidity expansion and currency debasement. Not only is it influenced by macro factors, but when market conditions change, it’s often the first to react. Over the past five years, all major price reversals in BTC have preceded those in major equity indices. This is notable because we expect longer-duration risk assets to bottom as the turn in the liquidity cycle becomes more clear.
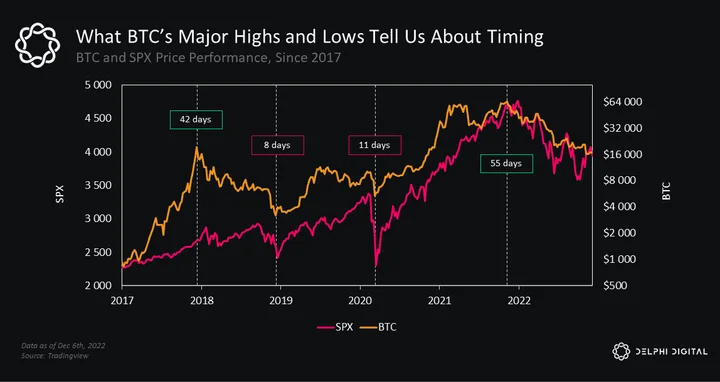
History shows that, on average, BTC has topped ~48 days and bottomed ~10 days before the SPX:
-
BTC topped 42 days before the SPX in 2017 (12/16/2017 vs. 1/26/2018)
-
BTC bottomed 8 days before the SPX in 2018 (12/15/2018 vs. 12/24/2018)
-
BTC bottomed 11 days before the SPX in 2020 (3/13/2020 vs. 3/23/20)
-
BTC topped 55 days before the SPX in 2021 (11/9/2021 vs. 1/3/2022)
Decoupling May Have to Wait
Considering the occurrence of several unforeseen crypto events in 2022, it’s possible the large majority of downside has already taken place. However, given how correlated crypto assets have been with global liquidity trends (and other factors like the US dollar), the possibility of a true decoupling seems unlikely in the near-term.
If liquidity conditions improve but the outlook for corporate earnings worsens, we could get a situation where equities remain weak/flat (because price multiple expansion is offset by weaker earnings) and crypto assets move higher. This is the most likely scenario in our view to see a true decoupling, if it were to happen.
If these conditions present themselves, or if equities do see another sizable selloff, the decoupling narrative will be stress tested. If the crypto market holds up, it could mark an inflection point for crypto to break its ties with traditional markets.
Sentiment would improve. Funding conditions would be more favorable, opening the door for even more investment in this space. Better financial conditions for project teams and protocols would attract more talent, some of which has been hesitant to take the plunge into crypto full-time because of this year’s events. Brands, talent, creators, and companies would be more enticed to explore Web3 strategies, especially those in need of a game changer to improve their current business models or foster new revenue streams.
Reflexivity and market feedback loops would begin to take over. Institutions would be back at the table as the argument for crypto as an uncorrelated asset class would have new life.
If, however, macro conditions worsen or fail to meaningfully improve, the crypto market will likely remain under pressure. We do expect to see crypto assets turn higher once the market realizes liquidity conditions are making a meaningful turn — and they may be the canary in the coal mine for traditional risk markets if history serves as a reliable guide.
Key Theme #5: Narratives Matter More in Bull Markets
When we do see a trend reversal, we believe that crypto narratives will begin to matter more and have a more meaningful impact on asset prices. This is not to say that narratives haven’t mattered at all this year. But during major bear markets, macro headwinds overpower sector or asset-specific catalysts and narratives often struggle to create sustained, positive price impact on individual names or sectors. Catalysts and narratives are often a bigger driver of asset outperformance during bull markets, and can even eclipse the most fundamentally-sound projects in the process. Narratives matter more in bull markets, especially within industries that are built on future growth prospects like tech and crypto.
We believe the key example of this theme will be the revival of the ETH Merge narrative, which has been the most impactful milestone from the original ETH roadmap. With the Merge behind us, there have been dramatic changes to Ethereum’s consensus, issuance, and energy efficiency (which helps with the ESG narrative). Perhaps most importantly, ETH’s supply will turn net deflationary as economic activity picks up.
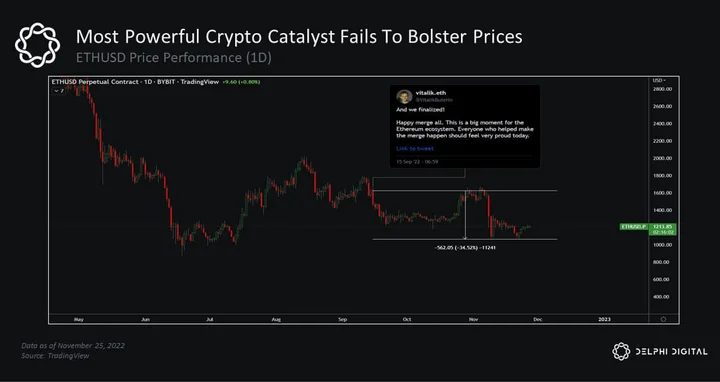
Even with the most compelling fundamental crypto catalyst and narrative to date, there has been little impact on crypto asset prices. In fact, ETH has slumped nearly 35% since the Merge completed on Sep. 6th, 2022. We attribute this to the macro bear market that has been the ultimate driver in the collapse of risk-asset prices across the board. When these macro headwinds begin to abate, risk assets will begin to make a comeback, and we know that bull markets give rise to some of the strongest narrative-driven asset price moves.
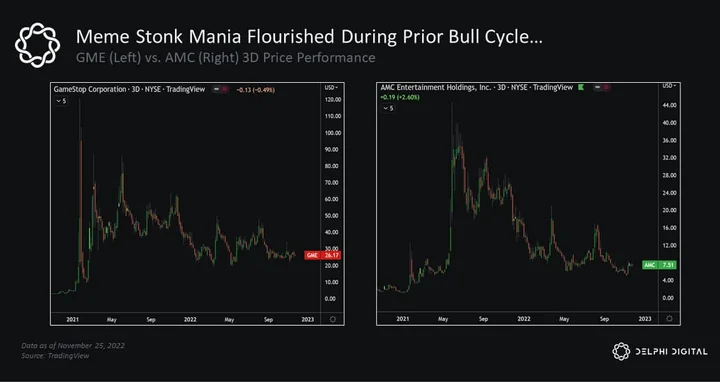
We saw this in traditional markets in the wake of COVID with the meme stonk mania between the GME and AMC crowds.
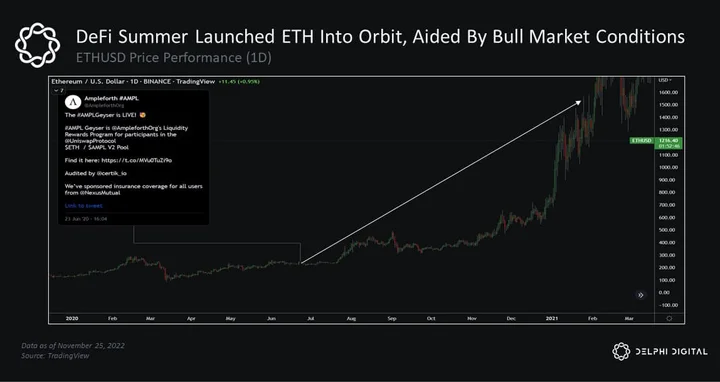
We also saw this within the crypto markets with the start of DeFi summer with ETH trading at ~$240.
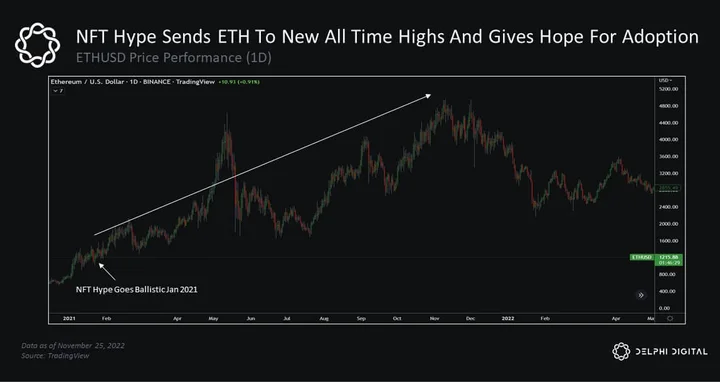
We also saw this with the meteoric rise of NFTs in January 2021. We believe this will be the case when the macro tides begin to turn, with the ultrasound money ETH narrative leading the charge (more on this in our Futuristic Ideas section at the end of this report).
Putting It All Together
This is arguably one of the toughest environments investors have faced in decades. We’ve seen a record level of wealth destruction this year, and we’re still in the midst of a challenging macro backdrop as there’s still a ton of uncertainty about the road ahead. If you ask 10 different experts where they see inflation (or the DXY, or financial conditions, or global central bank balance sheets) in 1-2 years, you’ll likely get 10 different answers. And each of them could probably provide strong evidence to support their view, which is a testament to just how much uncertainty still plagues markets right now.
There’s a lot to digest, so here are our biggest takeaways as we close the books on 2022 and look to the new year:
-
2022 was The Great Reset for crypto. Overly hyped trends and mass speculation pushed the crypto market far out over its skis by the end of 2021, so this year’s washout was a necessary reset. Sizable corrections are healthy for long-term secular uptrends.
-
We believe 2023 will be a period of accumulation, setting the stage for the next bull cycle. If this cycle follows the general path of those before it, one would expect to see markets consolidate into Q1 2023 before forming a clear bottoming pattern. We could see a renewed uptrend as early as mid-2023, but our base case is that the bulk of the move will occur in 2024-2025 as risk appetite and speculation return in full force.
-
This aligns with our assumption that global liquidity will transition back to an expansionary environment after the significant contraction we’ve seen over the last 12 months.
-
Liquidity trends tend to follow leading indicators of the business cycle, which means liquidity conditions should start to improve materially in Q1-Q2 next year. If we expect the liquidity cycle to turn in response to a weakening growth outlook, we’d also expect to see a weaker USD.
-
We’re already seeing early signs of this (PBOC easing + China credit expansion, Fed net liquidity stabilizing, a weaker USD, recent easing in financial conditions, etc.). If this recent uptick proves to be the start of a renewed uptrend, it would bring much-needed relief to many markets that’ve been thrashed by tighter conditions this year.
-
Similarly, many are trying to predict when we’ll see a “Fed pivot,” but most are focused on when the US central bank will pause rate hikes and/or when they’ll start signaling a wave of rate cuts. Rather, we argue that what really matters is when we see a reversal in liquidity conditions, since that’s what will continue to have an outsized influence on market conditions and asset prices going forward. We saw this dynamic during the 2017-2018 cycle, and again more recently.
- Looking further out, higher rates may not be as big of an issue now, but they will be when it comes time to roll over the enormous amount of debts outstanding. As we noted in a previous report, credit growth — and credit availability — are influenced by market conditions like changes in risk appetite and the availability (and stability) of collateral. As the aggregate amount of debt grows, more balance sheet capacity is required to refinance existing debt obligations, which is where the real vulnerabilities lie (and another reason why QE will have to return).
-
We believe crypto and equities will remain positively correlated, largely because both are facing similar macro headwinds and potential tailwinds which will continue to have a strong influence on asset prices. If we were to see a true decoupling, it would likely come if liquidity conditions improve but the outlook for corporate earnings worsens, where equities remain weak/flat but crypto assets get a lift.
-
This liquidity phenomenon isn’t just an exogenous influence on crypto, either. We see similar liquidity dynamics take hold within the crypto market as well. Liquidity truly is the lifeblood of financial markets.
-
When prices increase, the crypto industry as a whole experiences a wealth effect as the perceived size of balance sheets balloons (usually to be borrowed against). For example, during the 2020-2021 bull market, we saw the total amount of loans outstanding increase rapidly alongside asset prices, which in turn allowed active participants to take on even more leverage. This expansion in liquidity made its way into every corner of the market as capital flows fed higher asset prices (which fed more leverage and so on).
-
The Great Reset of 2022 saw a painful reversal in this trend, creating an environment defined by contractionary liquidity conditions rather than expansionary ones. Access to liquidity is one of the biggest risks to the crypto industry over the next 3-6 months.
-
When we do see a trend reversal, we believe crypto narratives will begin to matter more and have a more meaningful impact on asset prices. This is not to say that narratives haven’t mattered at all this year. But during major bear markets, macro headwinds often overpower sector or asset-specific catalysts. During bear markets, even the best narratives often dissipate as they struggle to create a sustained, positive price impact.
-
Market conditions will likely remain challenging over the next few months, but the light at the end of the tunnel appears to be getting brighter.
What Surprised Us This Year
Jason: 2022 was a year of many surprises, to say the least. The most surprising event for me was the magnitude of, and contagion caused by the 3AC collapse in June. Those of us who have been in the crypto markets for several years have seen a lot. Seeing protocols like Luna/Terra fail isn’t unheard of (while being terribly unfortunate and costly). Seeing exchanges collapse and/or commit fraud, while also terrible, isn’t unheard of either. The 3AC event was different in that it was the one of the first big institutional players to really “blow up,” taking many industry players out in the process. While these types of blowups have occurred in the traditional finance world, this was the first real one to occur within the crypto industry. In essence, it was our very own LTCM moment.
Andrew: Considering everything that has transpired in this year alone (the countless hacks, protocol collapses, NFT rug pulls, and underlying contagion, all while being overshadowed by the poor macroeconomic landscape), it’s not illogical that the prices of BTC and ETH are where they are today.
With that being said, if you told me at the beginning of 2022 that both BTC and ETH would fall beneath their previous cycle all-time highs (for an extensive duration), I probably wouldn’t have given you the time of day. Before this year, BTC and ETH had never closed below a previous cycle high, and BTC had never failed to maintain its 200-week moving average, which has historically been a key support level for cyclical bottoms.
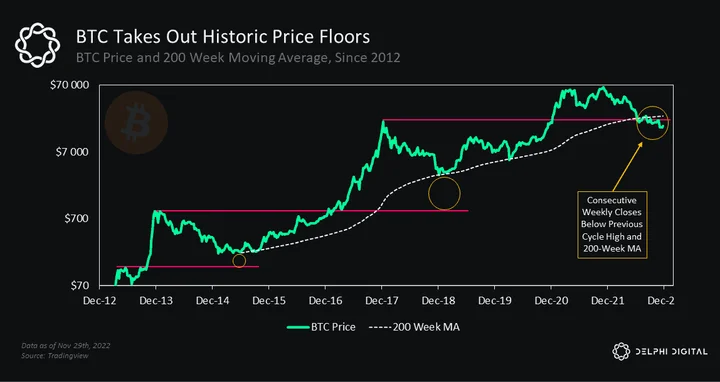
However, both of these levels were lost earlier this year. Although current sentiment and volatility may be difficult to stomach, the silver lining is the opportunity lower prices present. With time, the industry will heal. And in the future, when we look back on 2022, it may prove to be a generational entry point.
Futuristic Ideas for 2023 and Beyond
The ETH “Flippening”
For years, Ethereum advocates have popularized the notion that ETH would eventually take Bitcoin’s top spot on the crypto leaderboard, an inflection point known as “the flippening.” As of today, ETH’s market cap is ~45% of BTC’s. But at its peak in June 2017, ETH reached over 80% of the total valuation of BTC. However, when you compare all of the potential use cases, revenue projections, development/user activity, and sustainability aspects of BTC and ETH, it becomes clear which one has the higher likelihood of making a larger splash on a global scale.
Ethereum also has the most trusted brand and benefits from its first-mover advantage among L1 networks and smart contract platforms, which has attracted a diverse ecosystem with over 2,000 live applications and over 4,000 active developers. But we’ve only seen the tip of the iceberg when it comes to Ethereum’s applications and use cases.
ETH presents one of the best risk-reward opportunities if you believe crypto has a real future, especially given the structural changes to its economics in a post-Merge world. The Merge was the most highly anticipated narrative of 2022, but so far has been overshadowed by the perfect storm of macro headwinds we’ve discussed. Many believed that the new supply dynamics of ETH would trigger an immediate appreciation in price, but the opposite transpired in classic sell-the-news fashion. Since the Merge, ETHUSD is down 28% and ETHBTC is down ~9%.
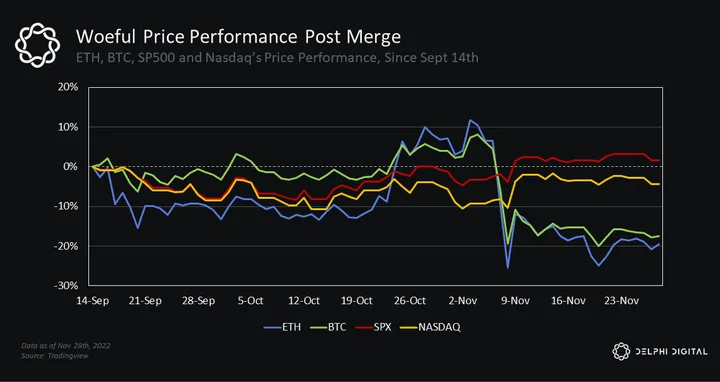
But the fundamental changes implemented through EIP-1559 and the Merge mean Ethereum now has real, measurable cash flows that directly increase value accrual to ETH. Unlike Bitcoin, which uses 100% of protocol fees to pay miners (with 0% distributed to holders), Ethereum now allocates 100% of its fees to reduce the total ETH supply (akin to a stock buyback) and reward validators on its network (akin to dividends). This allows us to use more traditional valuation techniques to come up with rough estimates for ETH’s potential value (and implied price).
Like other L1 networks, Ethereum has one main product — block space. The demand for block space has grown considerably over the last 5-6 years. Since 2017, the annual transaction count on the network has averaged a growth rate of 143% per year.
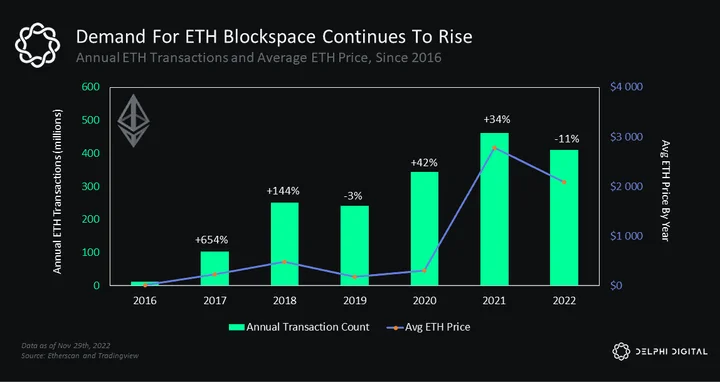
If we remove the outlier year of growth (from 2016-2017), transaction volume has grown 41% annually, which would be impressive for any company, even a high-growth startup.
Higher transaction volumes lead to higher gas prices, which lead to higher fees for the network. Ethereum’s total fees (in ETH) have grown at an average rate of 177% annually over the same period. If we convert those to USD amounts, annual fees in USD have grown at a rate of 658% per year.
More Use Cases → More Users → More Economic Activity → More Network Growth
There are several methodologies one can use to try and value decentralized networks. We highlighted some of the key factors and differences to consider when evaluating L1s in previous reports, and there are multiple frameworks one can pull from or combine to get a clearer picture of their potential.
”Staking rewards are composed of three sources: inflation block rewards, MEV, and transaction fees…Real staking yields capture fees and MEV accruing to validators (only in proof of stake), as well as token burning which also benefits all holders (beneficial in both PoS and PoW).” – Valuing Layer 1s – Memes, Money, or More?
How do you create a sustainable source of real yield? Increased network activity. That is why Ethereum is primed to benefit from the next wave of adoption, because it already captures meaningful revenue (network fees, MEV), which directly feeds into attractive real yields for its native asset, ETH.
That’s one of the reasons why the amount of fees Ethereum generates is important for its long-term health and sustainability. So far, it appears to be headed in the right direction, as total fees on Ethereum have increased each cycle as the network attracts more active users and transaction activity.
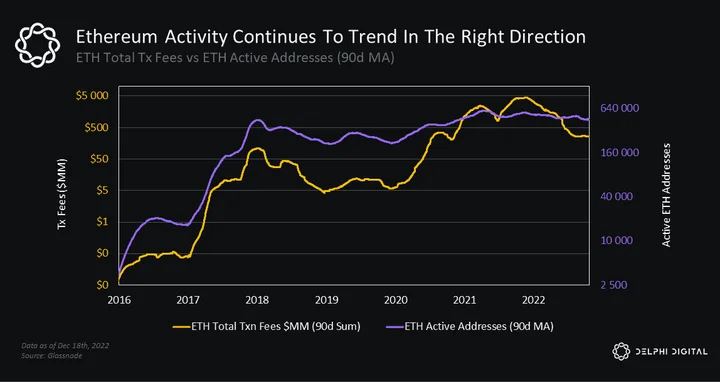
Ethereum has already demonstrated its ability to serve as a more robust alternative for services such as remittances, trading exchanges (settlement and clearing), and transparent collateralized lending. It’s also shown value as a system to record, verify, and settle value transfers of digital assets and tokenized IP like art, collectibles, or even music.
One of its biggest opportunities, though, is capturing market share from legacy financial services. There’s a strong argument that many financial services can be reproduced, and even improved upon, by leveraging DeFi primitives.
As with any forecasting tool, the conclusions are only as good as the assumptions behind its inputs. For example, there are several differences between traditional DCFs and ones that are appropriate for valuing a crypto asset as dynamic as ETH. Unlike a company, there are no payrolls, lease or rent payments, interest, taxes, or typical operating expenses that eat into expected profits. All costs are borne by network validators, so “fees” and “profits” are more synonymous than standalone line items.
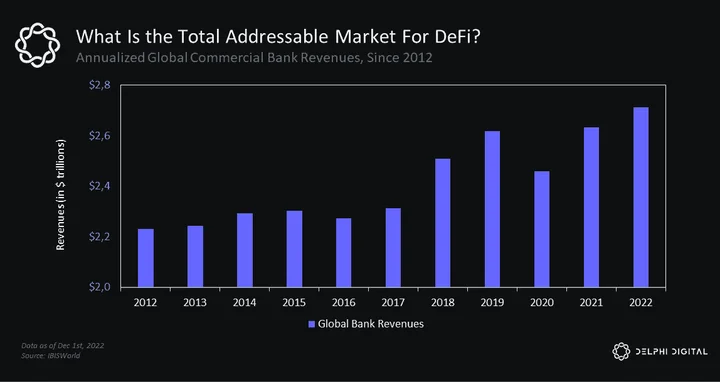
Taking a page out of Arthur Hayes’ post, Yes…I Read the Whitepaper, we can get a quick sense of ETH’s potential value using example target markets. Take financial services, for example. Global commercial banks are on track to report $2.71T in revenue this year, according to estimates from industry research provider IBISWorld. Hypothetically, if Ethereum were to capture just 2% of global banking revenue, ETH would be worth >4x its current valuation even if it traded at a conservative 11x earnings (roughly in line with industry averages). And that’s just one example of a market ETH can penetrate (albeit a very large one).
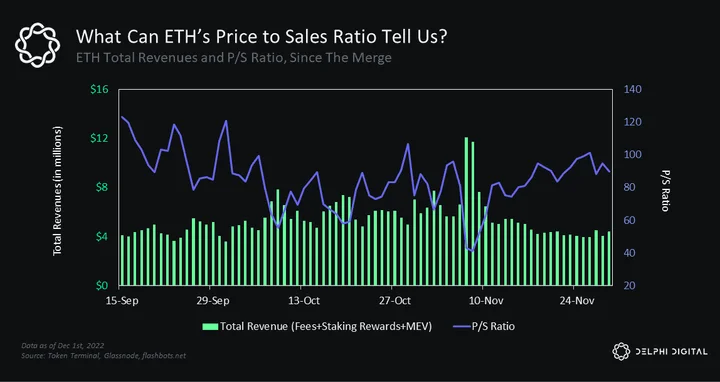
Admittedly, ETH trades at a significant premium compared to the amount of fees it generates today. But using the above example — which again is still just hypothetical — its implied price multiple would be 3-4x expected earnings (vs. today’s 80-90x).
In a world where Ethereum becomes a trusted settlement layer for a larger percentage of financial transactions, the “flippening” doesn’t seem that outlandish. If anything, it’s starting to look more inevitable. It’s still a big if, but if ETH were to capture just a small percentage of legacy financial services, its valuation would likely far exceed that of BTC. As of now, it looks increasingly likely that the potential ceiling for ETH is higher than that of its OG counterpart.
Like all emerging tech plays, this one doesn’t come without its own share of risks. For starters, competing L1s and L2 scaling solutions could pose risks to Ethereum’s stronghold on the fee market. Networks that offer low costs and faster block times have the potential to steal transactional market share from Ethereum, thus hurting its future fee prospects.
But even with the rise in competition, Ethereum continues to showcase why it remains the top protocol in terms of block space demand and total fee generation. Over the last 12 months, ETH has captured 78% of all fees generated by the top 10 fee-producing protocols.
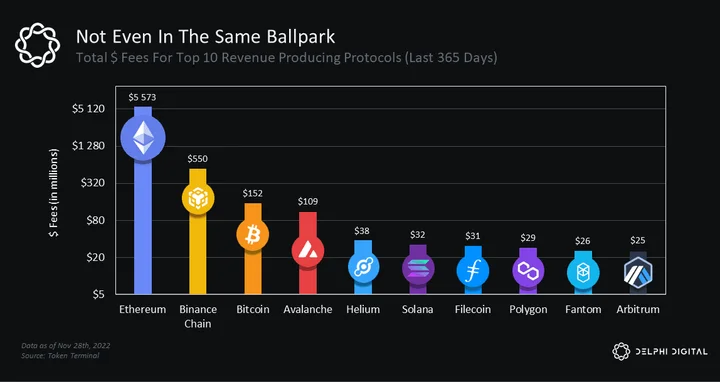
Drilling in a bit further, the disparity in fees is even more eye-catching. ETH has generated over $5.5B worth of fees over the past year. The next closest competitors are Binance Chain ($550M) followed by Bitcoin ($152M). Given its first-mover advantage and widespread popularity (both for users and developers), we believe ETH will continue to maintain its fee dominance over competitors in the coming years.
The concentration of ETH staking has also drawn attention. Four major platforms/staking providers account for more than 57% of all current ETH staked, with Lido alone representing 30% of the total.
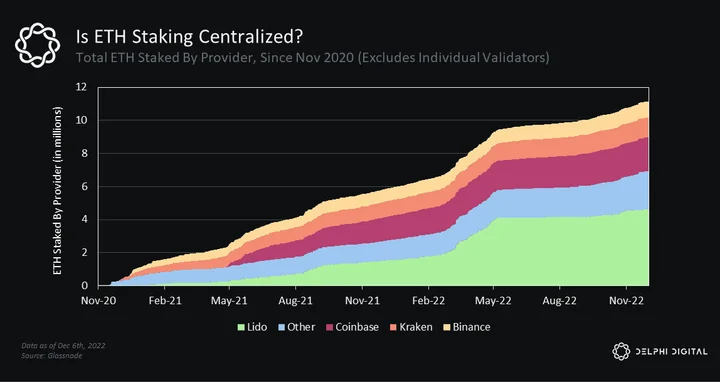
Furthermore, the top 10 holders of Lido’s governance token (LDO) make up over 52% of the LDO supply, resulting in potential decentralization and censorship issues. Although this topic is heavily debated across the industry, reducing the concentration of staked ETH wouldn’t hurt, especially if one of its stronger narratives lies in its decentralization benefits.
Be sure to read Delphi’s Infrastructure Year Ahead report for a deep dive on all the important trends our team is tracking in that sector.
DEX User Experience Will Trump CEX
The DEX user experience will match and exceed the CEX experience we are all accustomed to. Unfortunately, the time for this is not the present, which is why we find it in the “Futuristic Ideas” section of this report. As crypto continues to move from cycle to cycle, one theme continually re-emerges — self custody and the famous motto, “not your keys, not your coins.” In the aftermath of what has been a horrendous year, this lesson has never been more important. Surprisingly, it is precisely the horrific nature of these events that has given rise to perhaps the greatest opportunity for DEXs to challenge the incumbency of the CEX experience.
There are several challenges and hurdles that DEXs must overcome in order to compete with CEXs. A few of these include:
-
User experience and integrations: A big hurdle for DEXs is that they are often more challenging to use than CEXs for most users. Most DEXs require self custody; users must have their own wallet and must manage their own private keys. This is often intimidating, and a turnoff for most market participants. DEXs have the added challenge of requiring users to have a minimum level of technical knowledge in order to use them effectively, such as knowledge of smart contracts or other protocols. Within the traditional finance realm, there have been decades of third-party software integrations with CEXs. This has carried over to crypto, as many of the largest CEXs have similar third-party integration abilities as their TradFi counterparts. Integrations for DEXs do not yet exist in any meaningful way.
-
Liquidity: Another major challenge for DEXs is that they often have lower liquidity than CEXs. This can make it more difficult for users to execute trades on the exchange. This can also lead to higher volatility and wider spreads in various markets. In order to compete with CEXs, DEXs must find ways to increase their liquidity and make it easier for users to trade on their platforms.
-
Ironically, regulation: CEXs are often more heavily regulated than DEXs. This gives users MORE confidence in the legitimacy, security, and reliability of the exchange. This is ironic, as the aftermath of the FTX collapse is still playing out. DEXs, on the other hand, may not be subject to the same level of regulation, which can be a concern for some users. In order to compete with CEXs, DEXs will need to address user concerns.
DeFi applications have massive potential to disrupt and improve traditional financial services as well. Bringing more real world assets (RWAs) on-chain would increase transaction volumes and fees, especially for protocols that attract the most liquidity (as liquidity has its own network efforts). RWAs are more familiar instruments for TradFi investors too, which naturally should attract more institutional activity and capital.
The size of the global investable securities market is massive — even if DeFi facilitated a fraction of that total transaction volume, it would drastically increase its TAM by several magnitudes. For context, US equity exchanges regularly facilitate more than $80-100B of daily trading volume alone. Uniswap, the largest decentralized AMM, typically does 0.5-2% of that volume (but interestingly enough, it generated nearly 25% of the total annual revenue of Nasdaq over the last 12 months).
Special thanks to Cheryl Ho for designing the cover image for this report and to Ashwath Balakrishnan and Brian McRae for editing.
Additional Research




0 Comments