Ghosts of Cycles Past - The Early Innings of a New Cycle?
AUG 11, 2023 • 35 Min Read
To outsiders, crypto may lack rhyme and rhythm. But spend enough time doomscrolling on CT, and you begin to notice a method to the madness. Crypto is just like every other asset — driven by the whims and emotions of humans, who are cyclical beings. Since the time of Satoshi, studying past market cycles has been a valuable exercise. It offers an idea of where we are in the current cycle and, more importantly, what the future holds.
In our last report – Catalysts Stacking Up – we identified parallels between narratives today and the initial stages of past cycles. We examined two major narratives – global liquidity and government regulation – illustrating their slow transformation from headwinds to tailwinds. We also unpacked how this constructive shift lays the groundwork for their lightweight narrative cousins to flourish.
This month, we’re embarking on a deeper exploration of crypto market cycles; why we believe the evidence supports our thesis that we’re in the early stages of a new cycle, and a few high-conviction ideas to capitalize on the opportunities we believe lie ahead.
If we believe the worst has passed, where does this place us today? Let’s begin here.
“Crypto Market Cycles Rarely Repeat, But They Do Rhyme” – Satoshi Nakamoto
Despite all the parabolic charts, crypto markets are remarkably cyclical in nature. These cycles typically last about 4 years and they are surprisingly consistent, including the timing from peak-to-trough bottoms, how long it takes to reach new all-time highs, and the extent of their subsequent price rallies before putting in new cycle peaks.
Using BTC as a benchmark, the typical anatomy of a crypto market cycle looks something like this:
- Excessive enthusiasm and speculation drive BTC to a new market cycle top.
- After BTC peaks, it usually suffers an ~80% drawdown before finding a bottom, roughly one year after its prior high.
- Once BTC bottoms, it typically takes roughly two years for price to fully recover to previous cycle highs.
- After BTC surpasses its previous cycle high, it tends to rally for about another year before it tops out at a new all-time high – with a period of 3-5 months where BTC goes parabolic.
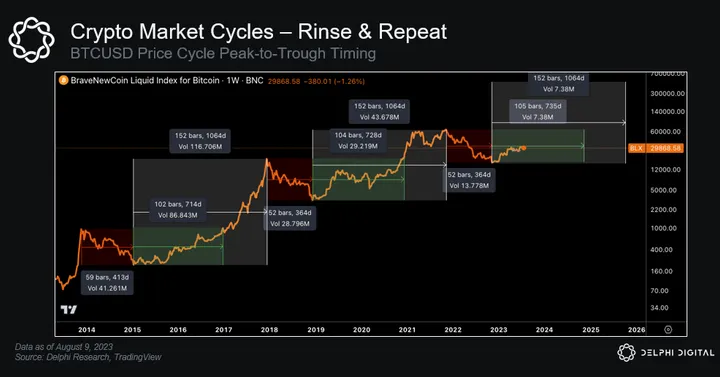 The last few crypto market cycles have followed this blueprint to a T.
- After price peaked in November 2013, BTC experienced an 85% drawdown before it found a bottom just over a year later.
- After price peaked in December 2017, BTC experienced an ~80% drawdown before bottoming almost exactly one year later.
- After price peaked in November 2021, BTC experienced another ~80% drawdown before bottoming almost exactly one year later.
The time between price bottoms and new cycle peaks has also been noticeably consistent. In each of the last two major price cycles, it took almost exactly two years for BTC’s price to fully recover to prior cycle highs and three years all in all for price to go from its cycle bottom to a new cycle top.
- After BTC’s price bottomed in January 2015, it took two years for it to reach its prior cycle all-time high – and nearly a year later, it topped out at a new cycle high (Dec. 2017).
- We saw the same thing play out after its December 2018 price bottom – it took roughly two years for BTC to recover to its late 2017 high, and its price continued to trend higher for another year before topping out in November 2021.
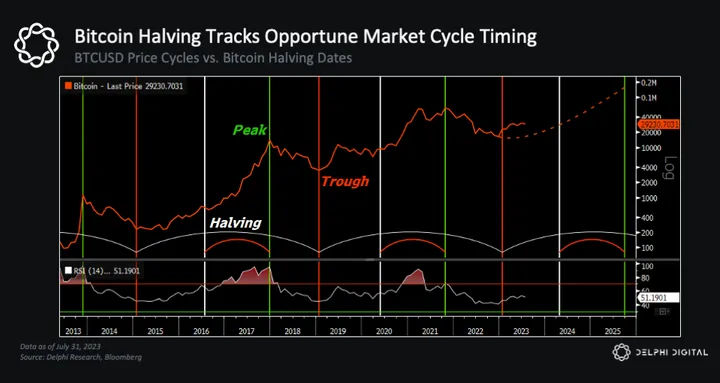 These cycles also match up nearly perfectly with Bitcoin Halvings, which, as we noted last month, just so happen to occur at the most opportune times.
- The July 2016 Halving occurred ~18 months after BTC bottomed (Jan. 2015) and ~7 months before BTC reached a new all-time high (Feb. 2017).
- The May 2020 Halving occurred ~18 months after BTC bottomed (Dec. 2018) and ~7 months before BTC reached a new all-time high (Dec. 2020).
- The April 2024 Halving will also occur ~18 months after BTC bottomed (Nov. 2022). Will history repeat once again?
Where Are We Now?
So, where exactly are we in this current cycle?
Well, we’ve already suffered through the period of pain with an ~80% price drawdown from prior cycle highs. We’re now ~9 months past the cycle bottom back in November, which would put us ~15 months out from a recovery to the previous cycle high (Q4 2024).
The April 2024 Halving is on schedule to occur ~18 months after BTC’s bottom – just like prior cycles – which also aligns with a new all-time high by Q4 2024 (and a new cycle peak by Q4 2025).
For reference, that would put us right around early Q4 2019 of last cycle – which is exactly what this chart is telling us.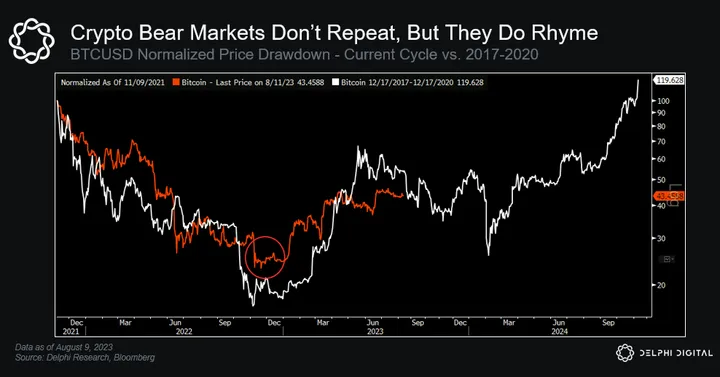 If history serves as a reliable guide, that would imply at least another 130% rise in BTC’s price from current levels over the next 14-16 months.
Recovering from a nearly 80% drawdown means BTC’s price would need to ~4x from its November low in order to reach a new all-time high. So far, it’s nearly doubled, having retraced just over 25% of its peak-to-trough drawdown.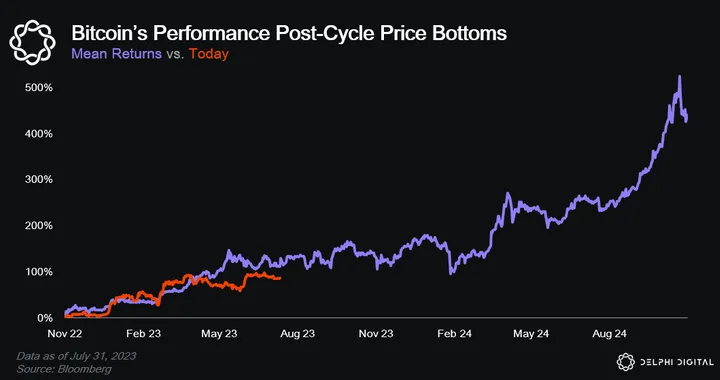
On the surface, crypto market cycles appear rather uniform. But we’d take it one step further and argue these cycles are more than that – they’re actually predictable.
We believe BTC and the broader crypto market will directionally follow a similar path as those of its prior cycles, not by coincidence, but because prices are influenced by an even bigger overarching cyclical trend: changes in the business cycle.
Each of the last three business cycles has lined up almost perfectly with the price peaks of the last three crypto market cycles.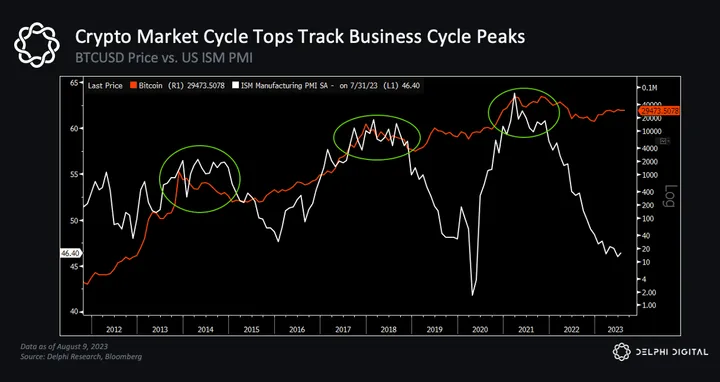 They also align with peaks in key adoption metrics like active addresses…
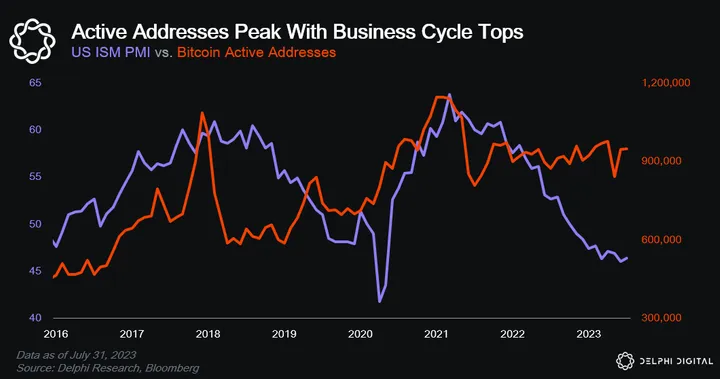 …and measures of on-chain activity like total transaction volume and total fees.
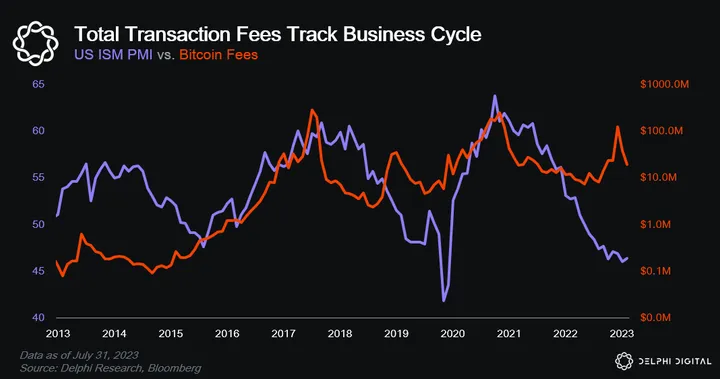 Logically, it makes sense. Crypto is a highly speculative market. As risk appetite returns, capital starts flowing towards riskier, high-growth opportunities. As prices rise, crypto markets attract more active participants – and thus even more capital – which fuels more transactions and on-chain activity.
So, as the business cycle shows signs of recovery, so too will crypto network activity.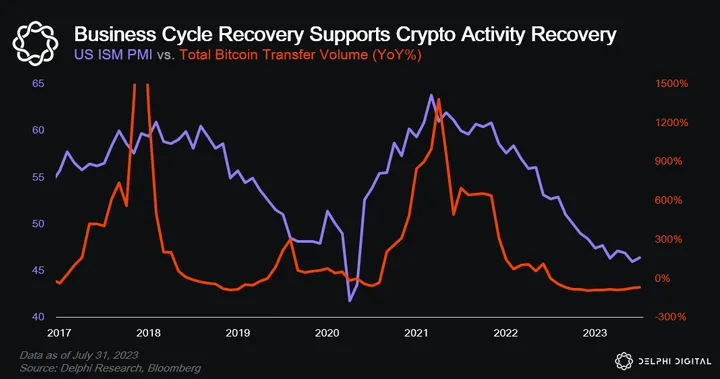 It’s important to remember that just because the outlook is looking up doesn’t mean we won’t suffer corrections. In fact, one could argue we’re likely overdue for consolidation after the run we’ve seen so far this year. We
Read the full report
This report is part of Delphi Pro.
- 800+ Pro reports across every major sector
- Talk directly with our analysts
- Private community of funds and builders
Already a Pro member? Log in
0 Comments