Monthly Chartbook - The Sellers Strike Back
MAY 19, 2022 • 27 Min Read







The Monthly Chartbook is a collection of interesting charts and trends we’re watching across crypto.
Crypto Market Recap
“Bitcoin is facing a key inflection point. After its impressive run up last year, Bitcoin is losing momentum; its price break below key support on a multi-month rising wedge pattern was an early sign of this.”
We wrote these words with April coming to a close and Bitcoin struggling to maintain its initial pop after the May FOMC meeting. The below chart accompanied these comments at the time…
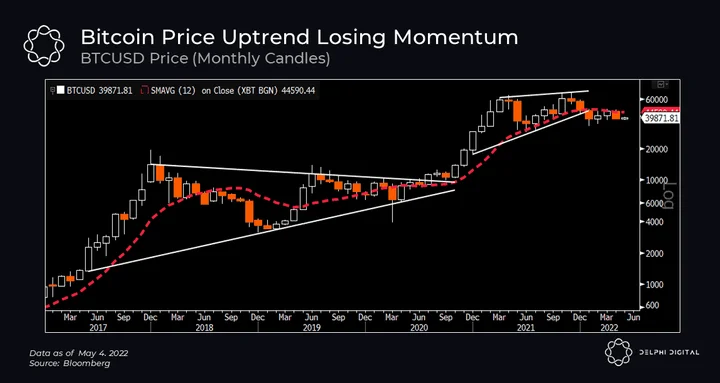
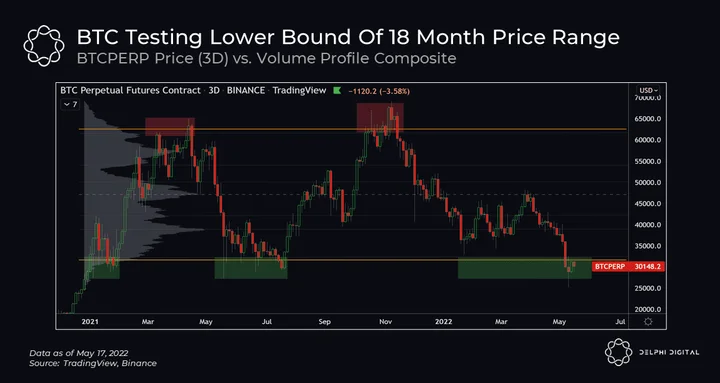
In just a few short days, Bitcoin’s price took another big leg lower and is now trading at its lowest level in almost 12 months. Bitcoin finds itself holding onto the weekly support structure found from $28.5K-$30K.
Two common concepts within market structure analysis (and one that we have spoken about ad nauseum) is ranging price action versus trending price action. In short, ranging price action occurs when price is more or less directionless, meandering sideways, and failing to breakout from either price range extremes. This behavior can be observed on various timeframes. Two notable examples of this are seen during the first five months of 2022, and more broadly speaking during the 18 month time period from the start of 2021 to the present day. Trending price action is the opposite of ranging price action. Trends are periods in which price moves from one price range (also known as a balanced area) towards another. A common adage within FX trading is that markets typically range 70%-80% of the time, and trend for only about 20% of the time. While not a direct 1:1 comparison to crypto, this heuristic can be helpful for market observers when developing a market view.
As mentioned in last week’s Market Insights post, there is a low volume void lurking below the weekly support structure that Bitcoin finds itself holding onto. “Should Bitcoin fail to attract enough buyers to stage a relief rally, price will likely be prone to ‘slip’ through these low volume areas before finding footing at the next structural support levels. In this case, we are likely looking at the 2017 ATH retest level.”
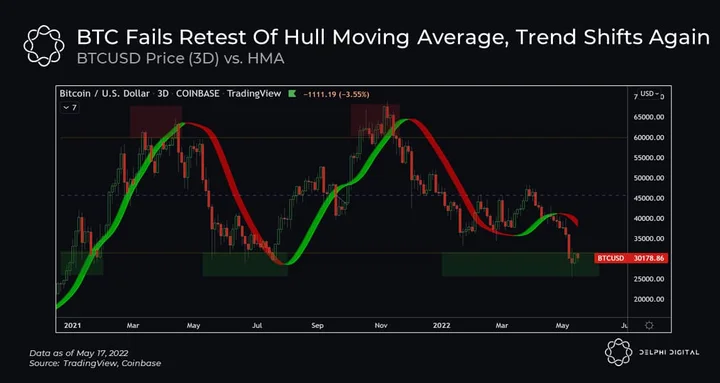
When looking at the Bitcoin’s momentum, it becomes obvious that it has dried up as well. The below chart shows the Hull Moving Average ribbon versus Bitcoin price over the same 18 month timeframe illustrated above. For a refresher on the HMA, please refer to this note.
After the rally staged in March, Bitcoin momentum has all but faded. The first retest of the HMA ribbon with price coming from above was met with failure of support. Price has since slipped back beneath the HMA ribbon indicating the shift in momentum described above. In addition to price slipping below the HMA ribbon, the HMA ribbon has shifted entirely with downside expansion signifying further weakness in Bitcoin momentum.
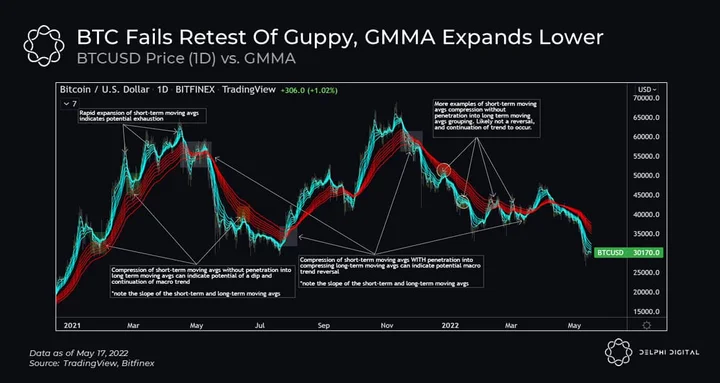
Similar to the Hull Moving Average, the Guppy Multiple Moving Average is another momentum indicator that helps investors filter out the noise when trying to discern the predominant market conditions. For a refresher on the GMMA, please refer to this note.
In much the same fashion as the HMA, the failed retest of the support provided by the longer term moving averages in the GMMA has seen Bitcoin price slide to the lowest levels seen in about 12 months. Unfortunately, we have seen downward expansion in the GMMA groupings. When the GMMA begins to expand, markets typically experience more of a trending price environment. Combining the GMMA and HMA along with the 2022 price range breakdown, we can clearly see that momentum has favored the sellers so far.
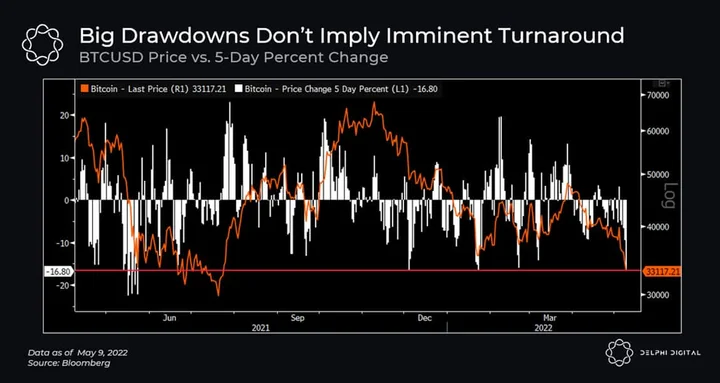
We can clearly see that momentum indicators have favored sellers and some of them are indeed screaming oversold but that doesn’t mean BTFD is the ideal strategy; short-term performance tends to disappoint after similar readings if you look at the last five years. Even large multi-day drawdowns don’t guarantee the worst is behind us yet.
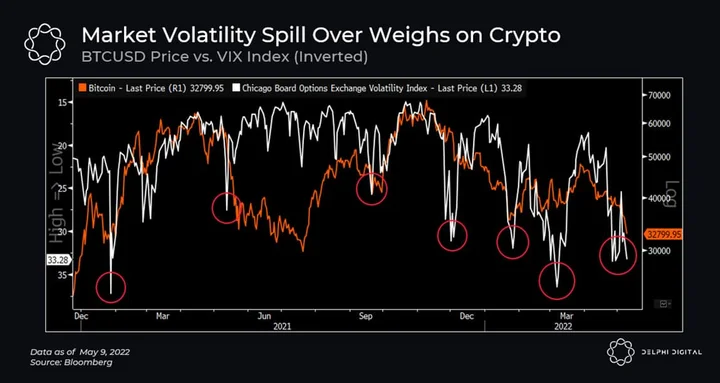
The latest bout of price volatility hasn’t been isolated to crypto either. As we’ve seen time and again, elevated volatility in the equity market tends to spill over to crypto markets, especially when both markets have similar near term headwinds dragging on them.
So what turns this trend around? Revived risk appetite (which leads to risk asset outperformance), a weaker USD, and a reversal in implied volatility, for starters. The influence of King Dollar on crypto asset prices has strengthened over the last two years as Bitcoin and other majors like ETH started attracting more institutional capital. We believe these relationships will remain strong as Bitcoin trades more like a macro asset, especially during risk-off periods.
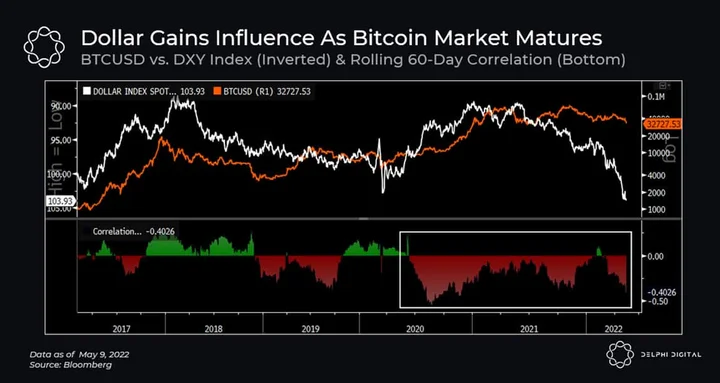
The big headwinds we’ve been citing for months still pre
Read the full report
This report is part of Delphi Pro.
- 800+ Pro reports across every major sector
- Talk directly with our analysts
- Private community of funds and builders
Already a Pro member? Log in
0 Comments