Report Summary
The report “Year Ahead for Markets – 2025” explores the state of the cryptocurrency markets, key themes driving market dynamics, and predictions for the future. Here are the key takeaways:
1. Crypto Market Overview:
- 2024 Highlights: Bitcoin’s rise to $100K+, driven by ETF inflows and renewed institutional interest, led to increased market optimism. However, this was juxtaposed with poor sentiment and underperformance in altcoins.
- Market Divergence: The year saw BTC dominance surge, but this failed to uplift the broader altcoin market.
2. Drivers of Crypto Markets:
- Institutional Adoption:
- Spot Bitcoin ETFs were a game-changer, signaling institutional confidence.
- The post-election regulatory shift promises a friendlier environment, unlocking potential for increased capital inflows.
- Liquidity Cycles:
- Crypto markets are highly sensitive to global liquidity conditions. The Fed’s pivot to rate cuts in late 2024 and supportive liquidity trends in China bode well for market growth in 2025.
- Stablecoin Growth: The stablecoin market, which contracted during high-rate environments, is expected to rebound, boosting onchain liquidity and activity.
3. Key Themes for 2025:
- Optimism Returns: Renewed trust in crypto markets as regulatory clarity improves. Rising stablecoin usage and institutional participation are likely to bring sustained growth.
- Memecoins and Fundamentals: The “memecoin supercycle” of 2024 highlights the speculative and narrative-driven nature of crypto. While memes thrive, the report anticipates a pivot back to fundamentally driven projects in 2025.
- Sectoral Shifts:
- Infrastructure and decentralized finance (DeFi) projects are poised to attract institutional interest.
- Emerging sectors like Real World Assets (RWA) and AI-driven decentralized applications could be key growth drivers.
4. Bitcoin and Broader Crypto Outlook:
- Bitcoin:
- Positioned as the cornerstone of crypto, BTC’s adoption as a macro asset is solidified.
- Its market cap (~$2 trillion) is small relative to traditional asset classes, signaling room for growth.
- Altcoins: Expect broader rallies beyond BTC as stablecoins and ETH drive liquidity into the system.
5. Solana’s Renaissance:
- Solana emerged as the ecosystem leader in 2024, driven by a strong developer community, innovative projects, and a focus on user experience.
- The chain’s rebound from past challenges showcases resilience, with notable traction in memecoins and new applications.
- Outlook: Solana is well-positioned to continue growing, challenging Ethereum in key areas like user experience and scalability.
6. Challenges and Considerations:
- Supply vs. Demand Imbalance: The sheer volume of new tokens has outpaced demand, requiring innovation to attract and retain users.
- Global Macro Risks: While liquidity trends are favorable, geopolitical and economic uncertainties could impact markets.
Conclusion:
The crypto markets are entering 2025 with a mix of optimism and challenges. Institutional participation, regulatory clarity, and emerging sectors are set to drive growth. Bitcoin remains the anchor, while altcoins and infrastructure projects are positioned for broader participation. Solana’s resurgence epitomizes the resilience and potential of blockchain ecosystems.
The Year Ahead for Crypto 2025 – Full Series:
AI+DePIN
DeFi
Gaming
Infrastructure
Markets
Introduction — One Step At A Time, The Future Looks Bright
We often overestimate what can happen in the short term, and underestimate what can happen in the long term.
Most crypto participants thought crypto markets were going to rally to new all-time highs on the back of spot ETF products going live. After all, the institutions were finally coming to buy everyone’s bags and send crypto to the moon, right? Well, not exactly. At least not in the way many expected.
In Q1, BTC rallied over 50% to $73K on the back of these shiny new ETFs launching. Billions of dollars flowed directly into the orange coin, and if there was any question around the institutional demand for BTC, it seemed as if those concerns were put to bed.
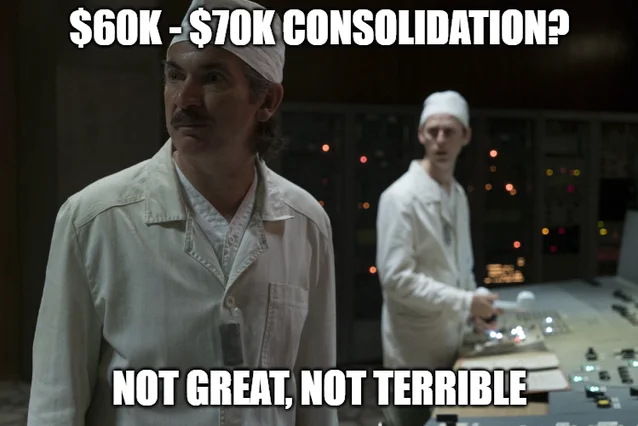
The ETFs were an overwhelming success, even outshining the fading bullish macro tailwinds that had previously driven risk assets higher in late 2023 and early 2024. Eventually, these “heavyweight” macro drivers caught up with BTC and crypto markets, and for ~7 months the price mainly chopped and churned within the ~$60K – $70K range. Not great, but not too terrible.
Unfortunately for the broader crypto market, the love was not equally distributed. Outside of small pockets of outperformance, most of the market struggled. The initial “failure” of spot ETH flows — or lack thereof — after their mid-year launch only compounded these struggles. Much of the story in 2024 was a tale of two markets, and subpar industry sentiment and infighting reflected this reality.
Then everything changed again in November. While many viewed the Presidential election as divisive, it was anything but for the crypto industry. After years of regulation by litigation, the industry finally has something to look forward to — a much-needed reset and a fresh start under an administration that has so far promised fair, common-sense regulation. The hope is that now these promises are kept.
The change in sentiment and risk appetite these last few weeks is palpable, so much so that we may begin to see this tale of two markets unify back into one.

For those who’ve been following our Markets research for the last several years, some of these topics and themes will be familiar. We’ve discussed many of them in detail in some of our prior reports, which complement the commentary and analysis found in this piece. We’ve provided links to many of these throughout the report for those seeking additional context.
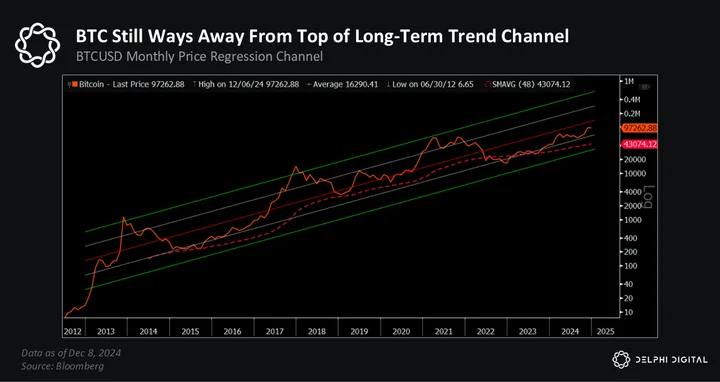
The Cycle Playbook Is Right On Track
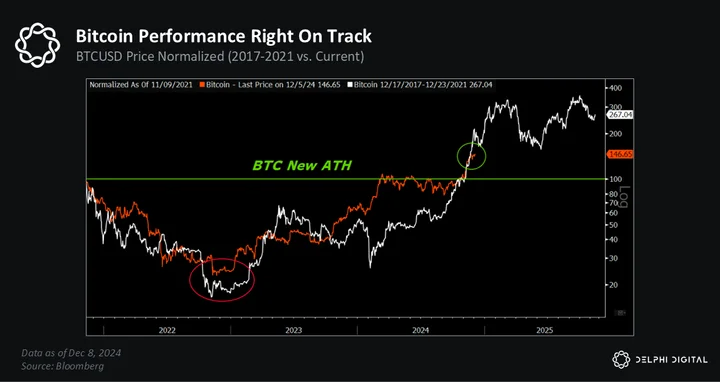
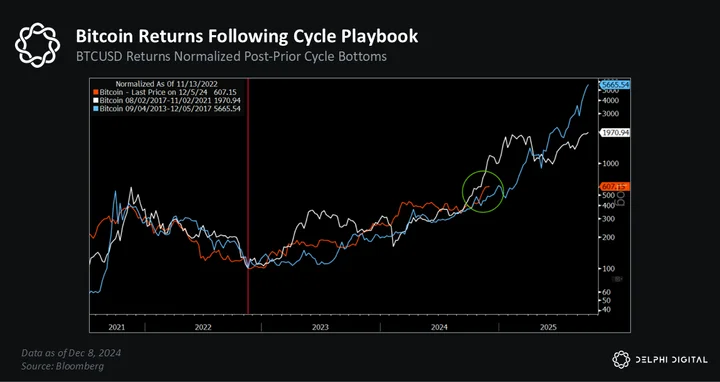
At the end of 2022, we outlined our rationale for why the bottom of the bear market was behind us. Over 15 months ago, we began getting a lot more vocal about our conviction in this upcoming bull market cycle. In last year’s report, we predicted BTC would break to new ATHs by Q4 2024.
While BTC technically broke to new highs in late March on the back of ETF hype, the most recent breakout is more in line with the one we’d been expecting.
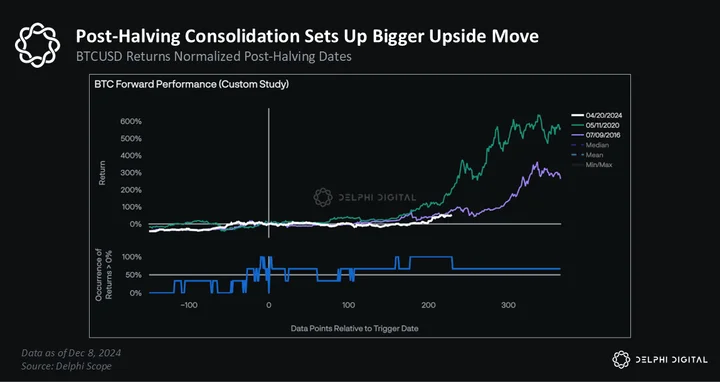
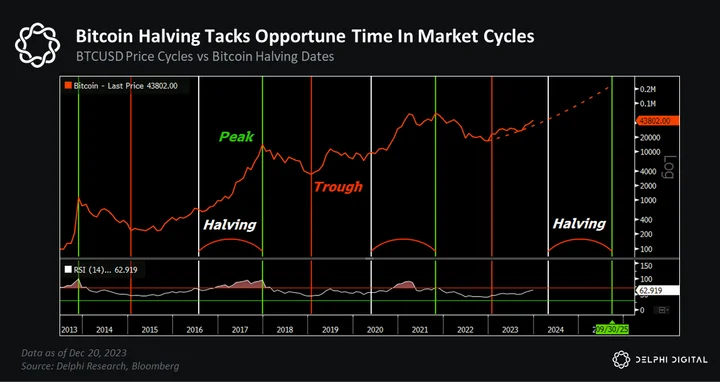
At the time, we were just over 3 months out from the next Bitcoin halving. We noted how BTC tends to rally in the weeks leading up to the event — and how price typically consolidates post-event, setting up an even bigger move later on.
Fast forward and that’s essentially what happened.
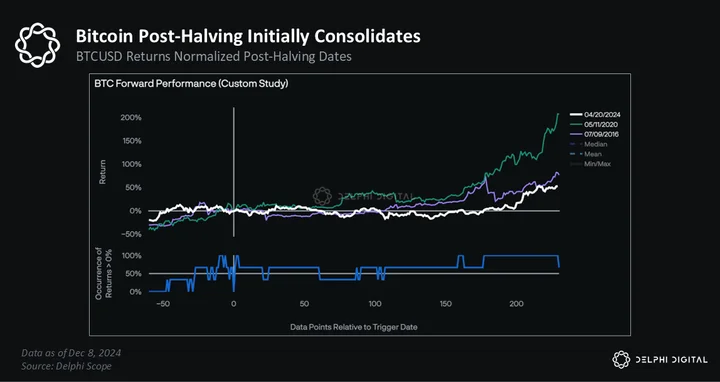
The explosive move has put us right in the sweet spot — with more room to run.
We also reiterated that Bitcoin halvings weren’t the key catalyst for bull cycles in our view — they just happen to coincide with opportune moments in BTC’s cyclical history.
As a reminder, this was then…
And this is now…
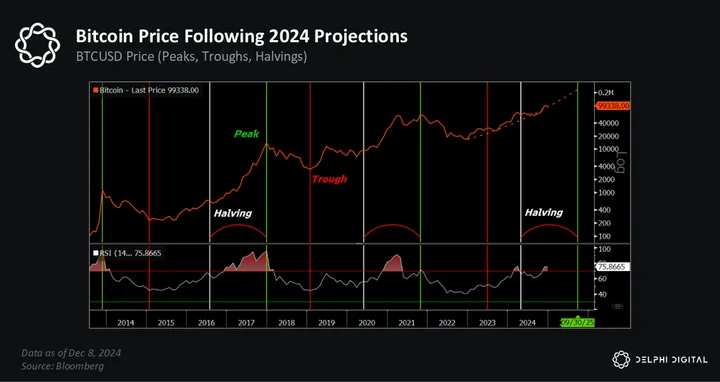
It’s almost miraculous how closely BTC has tracked our cycle playbook.
Longtime readers of our research know why this is the case — no miracles necessary — and why this has been our expectation all along.
Markets are momentum-driven, and nowhere is that more evident than BTC and crypto.
Each new all-time high for BTC has coincided with a monthly RSI breakout > 70. Prior bull markets didn’t run out of steam until this indicator broke above 90.
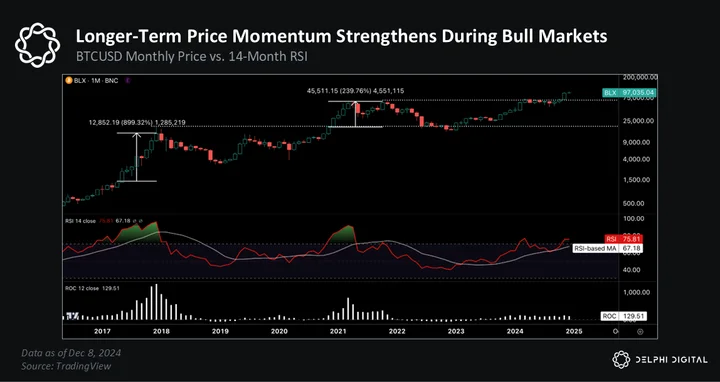
Hypothetically, if this heuristic were to hold, BTC would have to hit ~$175,000 — or even $190,000-$200,000 if it really starts to run — before these RSI levels were reached. This assumes the current cycle top is marked by a swift period of accelerated gains, like most prior cycles.
BTC is also well below the 1-2 standard deviation moves that often signal cyclical tops.
It’s hard to see the forest through the trees in an industry that moves as fast as this one. As we all know far too well, volatility cuts both ways — which is why time horizons matter.
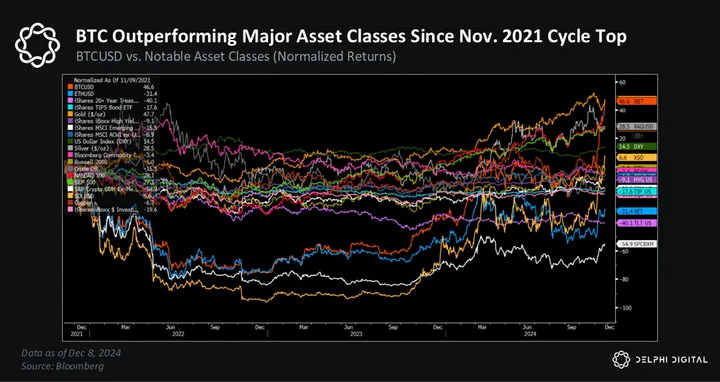
In case you need more proof of this, here’s a fun fact. Even if you managed to top tick BTC in November 2021, you’d still be outperforming every other major asset class over that period, if you managed to hold on.
Bitcoin breaking to new all-time highs is more than just a catchy headline too — it’s the ultimate risk-on driver for crypto markets.
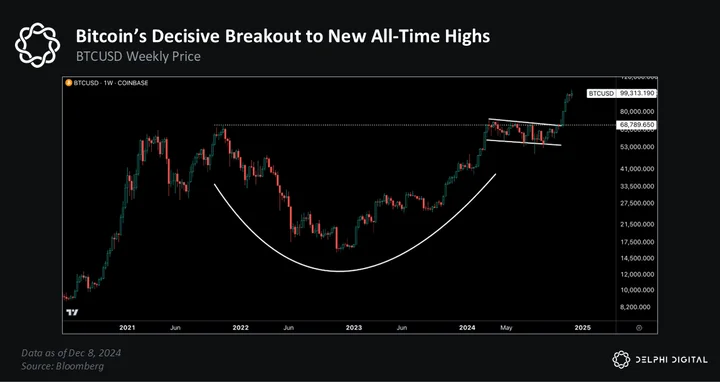
“Price is the ultimate driver of attention, capital flows, and onchain activity.”
Retail didn’t show up en masse last cycle until BTC’s price made a decisive break above its prior ATH. This pattern is evident in everything from Google search trends and the surge in “Bitcoin” news articles to the growth in Coinbase’s consumer transaction revenue. Investor confidence and risk appetite tend to rise when BTC gives the ‘all clear’, smashing previous ATHs.
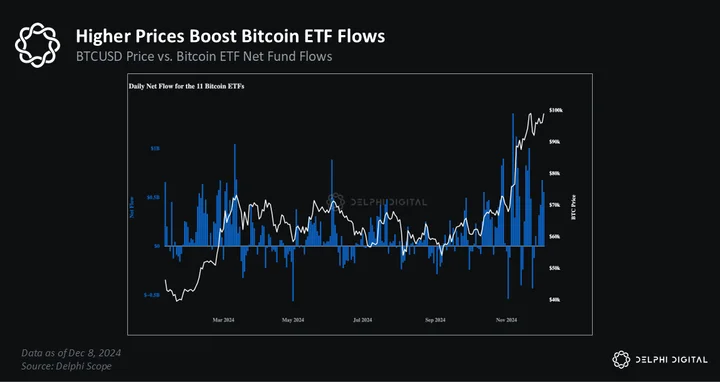
Price drives attention — which also turbocharges FOMO and capital inflows.
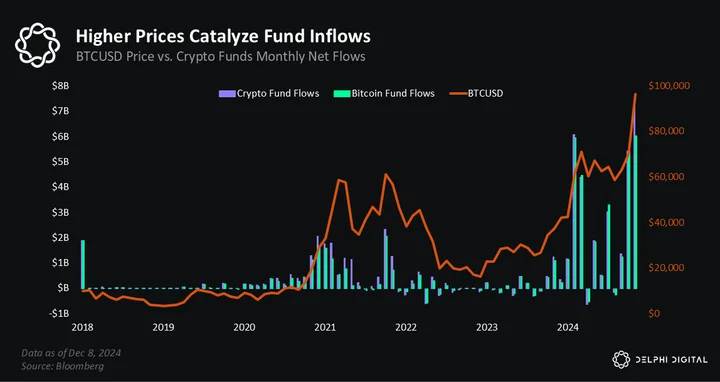
Look no further than the trend in BTC ETF flows this year.
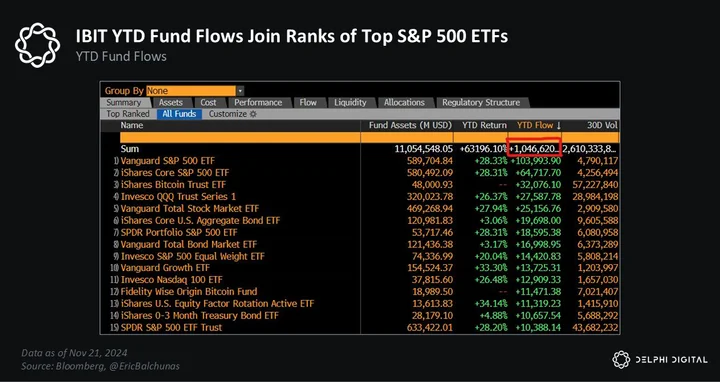
The iShares Bitcoin Trust ETF (IBIT) has seen the 3rd largest inflows this year across all ETFs — the only ones beating it are the two largest S&P 500 ETFs, which have a combined AUM that’s ~20x the size of IBIT (~$1.1 trillion).
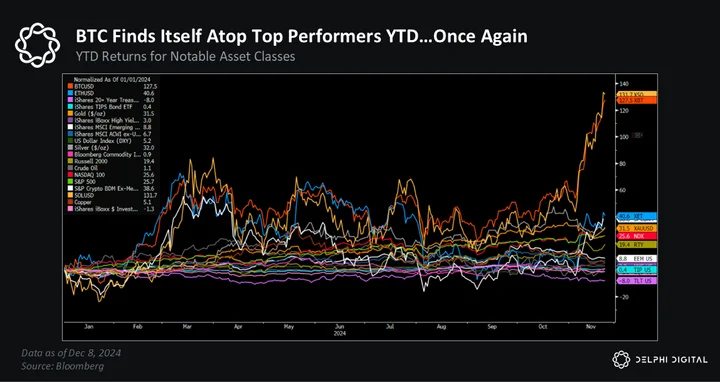
Price is the ultimate driver, and for the second year in a row BTC finds itself atop the leaderboard when compared to traditional asset classes.
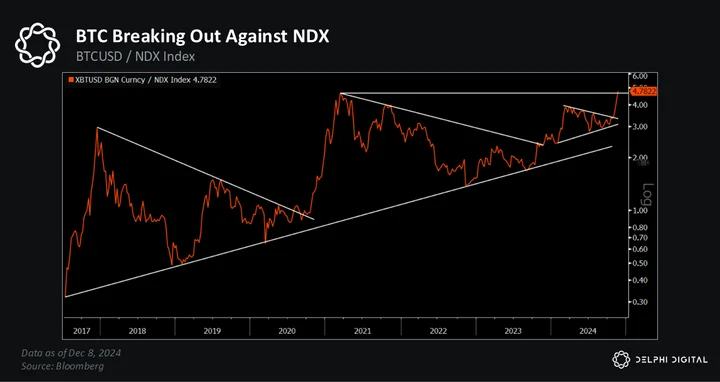
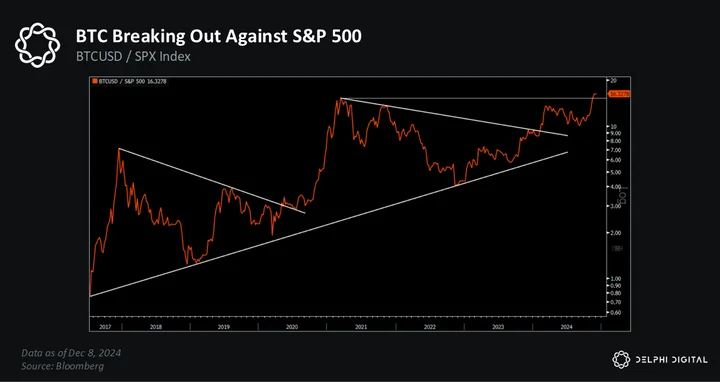
BTC has not only broken out to a new price high — it’s also breaking out against the NDX, which is up nearly 30% itself YTD.
BTC has also broken out against the SPX…which is on track for one of its best years in the past three decades.
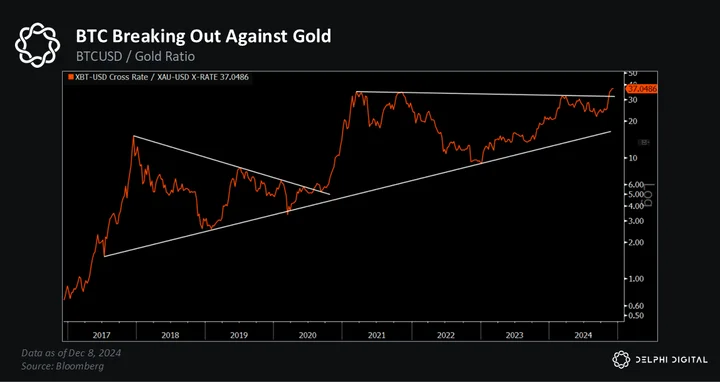
It’s also broken to new highs against its “boomer” shiny counterpart — gold.
We’ve said for a long time that one day the stigma around BTC would be flipped on its head — that one day not having exposure to BTC would become the bigger risk for investors and institutions. In our view, that day is here.
HAHAHAHA I AM DYING 😭😭😭@JoeSquawk dunking on Tradfi Bitcoin skeptic : “You missed it” 💀 pic.twitter.com/VvlPO3TLA4
— Mason (@MasonFoard) December 5, 2024
Poking fun at bitcoin is no longer the “cool” thing to do anymore. This is the cycle that solidifies BTC as a macro asset that can no longer be ignored.
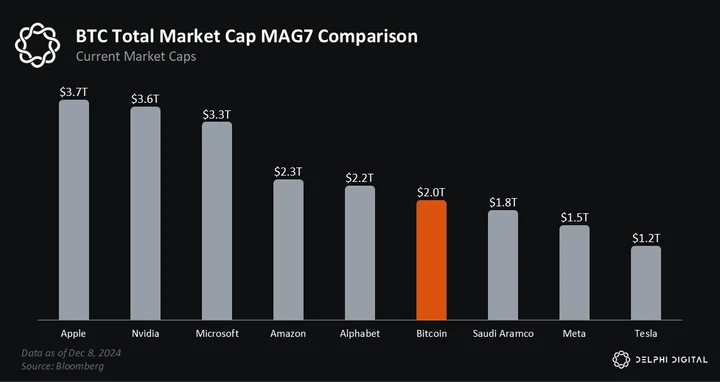
Bitcoin’s market cap is now ~$2 trillion. Two Trillion American Minted United States Dollars.
That’s big. If it was a publicly traded company, BTC would be the 6th most valuable in the world.
It wasn’t too long ago that many saw $100K BTC as little more than a pipe dream. Now the timeline is flooded with this type of energy.
At $91,150 Bitcoin flips Saudi Aramco
At $109,650 Bitcoin flips Amazon
At $107,280 Bitcoin flips Google
At $156,700 Bitcoin flips Microsoft
At $170,900 Bitcoin flips Apple
At $179,680 Bitcoin flips NVIDEA pic.twitter.com/6Ls81CRVbK— Creeper (@DegenCreeper) November 12, 2024
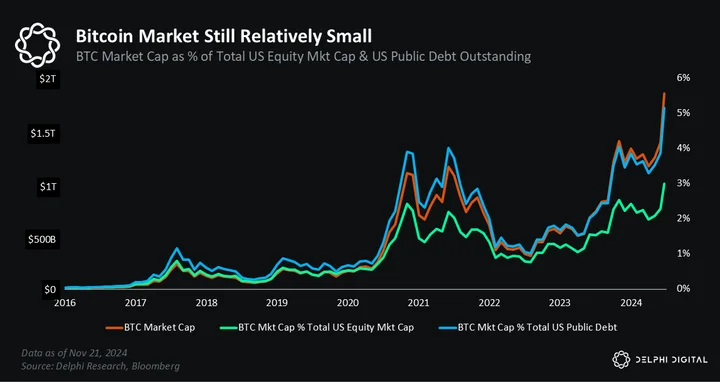
Bitcoin is now big enough to command the attention it deserves. But it’s not so big that it doesn’t have plenty of room to still grow. At the time of writing…
- BTC’s market cap is still only 11% of the combined market cap of the MAG7 (AAPL, NVDA, MSFT, AMZN, GOOGL, META, TSLA).
- It’s less than 3% of total US public equity market cap, and ~1.5% globally.
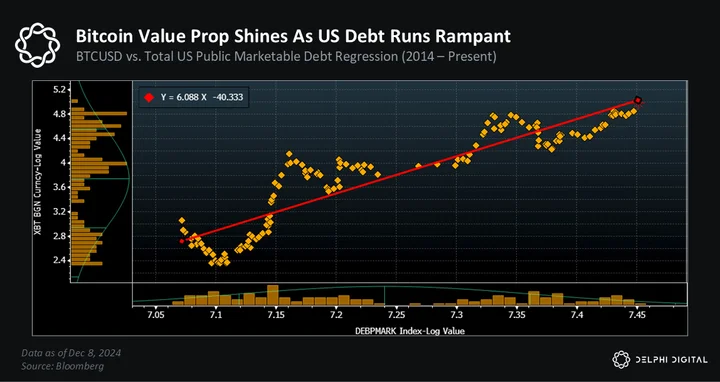
- BTC’s entire market value is still only 5% of total US public debt outstanding — and less than 0.7% of total global debt (public + private).
- There’s 3x more money held in US money market funds compared to BTC’s market cap.
- BTC’s market value is still only equivalent to ~15% of total global foreign reserve assets. Hypothetically, if global central banks reallocated 5% of their gold reserves to BTC, that would net over $150 billion in additional buying power — or 3x the total net flows into IBIT this year.
- Household net worth is at an all-time high (>$160 trillion) — over $40 trillion higher than its pre-COVID peak — largely driven by rising housing prices and a roaring stock market. For those keeping score at home, that’s 80x higher than BTC’s current market cap.
The point is there’s still plenty of deep capital pools for BTC and crypto markets to draw from. All of this serves as potential demand when people gain confidence that the crypto market is heading higher.
In a world where the Fed — and other central banks — are driving 5-7% annual debasement of their currencies, investors need to make more like 10-15% annual returns to outpace this loss in future purchasing power.
That is why investor attention is increasingly shifting towards higher growth industries — it’s the best place to seek out above-average returns.
We believe investors will continue being rewarded for owning risk as the tailwinds stacking up continue to outweigh the potential headwinds.
Global Liquidity → Currency Debasement Marches On
On the macro front, reality has been falling in line with expectations.
By now, we know Bitcoin halvings aren’t the primary catalyst for crypto market cycles, it’s all about liquidity cycles.
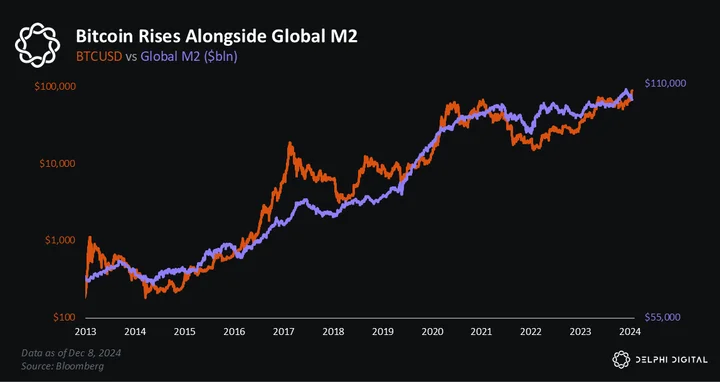
Fluctuations in global liquidity drive fluctuations in global markets — stocks, bonds, currencies, gold, bitcoin — they’re all impacted to varying degrees. We’ve spilled a ton of ink talking about liquidity over the years, so we won’t regurgitate all the reasons why it’s so important to understand. For those interested, a few recent reports discussing this dynamic include High off the Halving, and The Dark Night Rises.
Bitcoin is the most sensitive to these fluctuations as its core value proposition is ultimately the purest expression of it — the most pure hedge on global currency debasement. This is precisely why BTC exhibits such high sensitivity to changes in global liquidity and monetary growth.
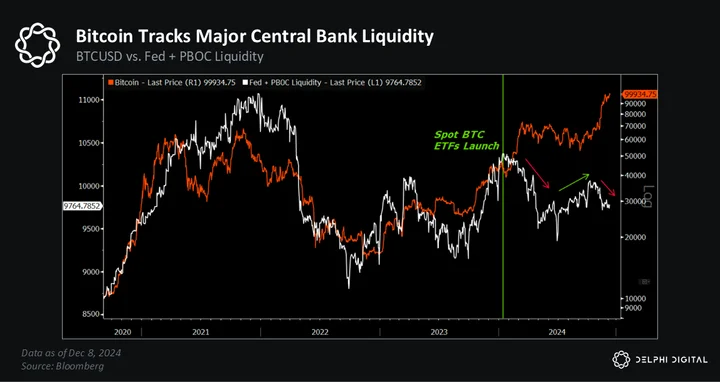
At the end of last year, we laid out the favorable conditions working in BTC’s favor for a strong Q1 — one of which was the surge in global liquidity we saw starting in Q4 2023. We also warned there was a higher risk of a market pullback starting around late Q1 to early Q2 2024.
The reason? We saw signs of liquidity momentum fading, specifically from the world’s two most important central banks.
BTC is up over 130% year-to-date — and it’s done so without much support from the Fed.
In fact, Fed liquidity has been steadily falling for the last 9-10 months.
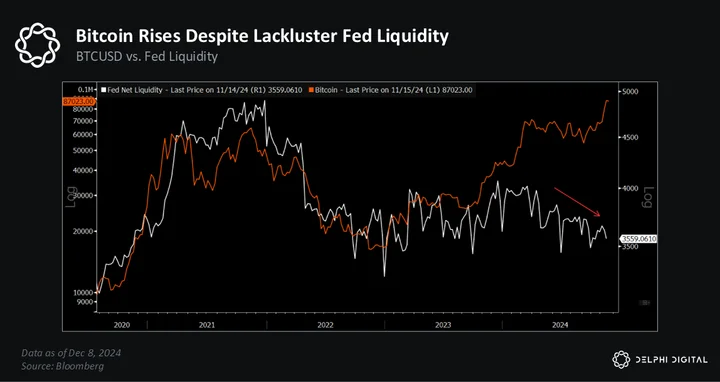
As we’ve noted, Fed liquidity essentially tracks changes in bank reserves. (Note: some calculations of Fed liquidity include currency in circulation, but either way the conclusion remains the same).
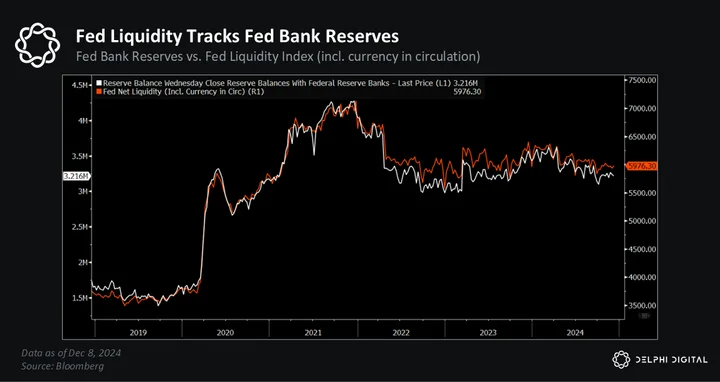
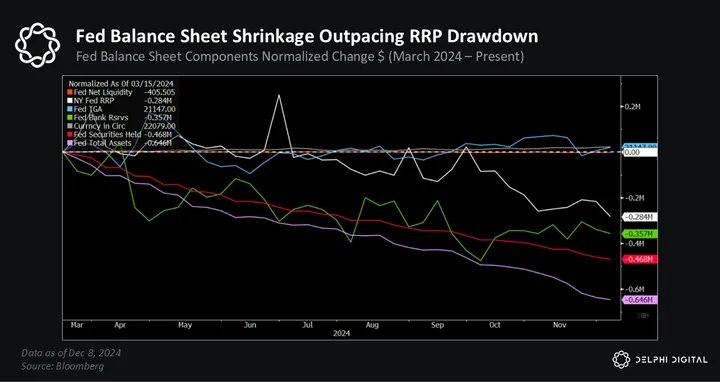
From mid-2023 through March 2024, Fed liquidity grew by nearly $400B. Despite the $700B+ increase in the TGA over that period, we also saw a whopping ~$1.5T drawdown in the RRP, which more than offset and helped boost bank reserves by ~$400B.
Since then, the Fed’s balance sheet reduction has outpaced further declines in the RRP, helping push bank reserves — and thus Fed liquidity — lower.
We noted back in July how the TGA had grown by over $700B since mid-2023 — and how some of that could get drawn down ahead of the US presidential election.
That hasn’t happened yet — the TGA still has $750B in it. But we expect this drawdown will happen soon.
On January 1st, the US debt ceiling will be reinstated (based on the amount of debt outstanding on that date). Until legislation is passed to raise or suspend the debt ceiling (yet again), the US Treasury will have to tap cash on hand in the TGA to finance its spending obligations.
We’ve seen this song and dance before too (key debt ceiling dates highlighted in below chart).
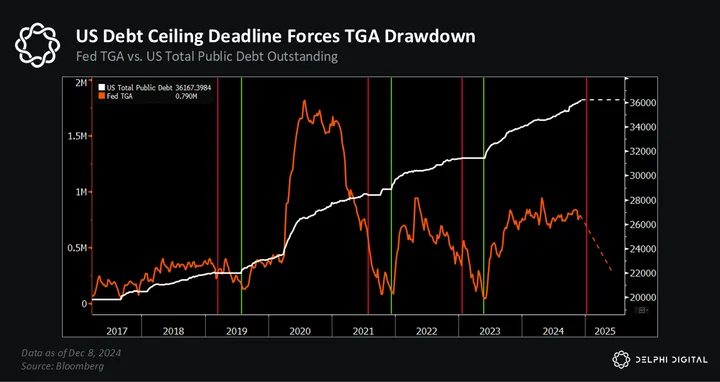
The US debt ceiling will need to be raised again — it’s not a question of “if”, but “when”.
The US continues to run multi-trillion dollar deficits, which only adds to its growing mountain of public debt. Despite all the recent rhetoric around cutting the fiscal deficit, the gap between total government spending and revenues is not one that’ll be solved in a couple quarters.
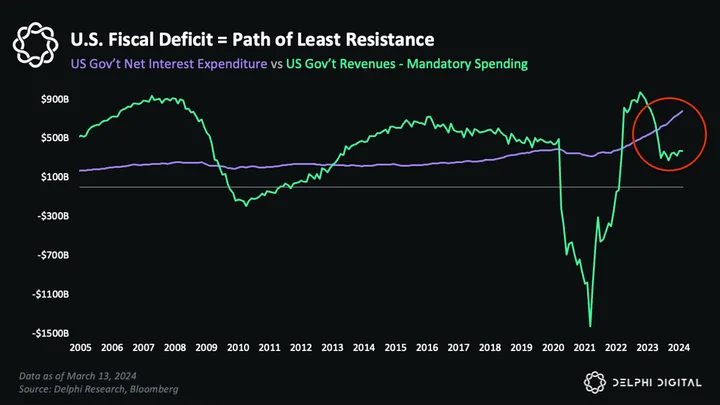
Earlier this year, we highlighted how mandatory spending programs and interest expenses on US public debt are larger than the total amount of annual revenue that the USG collects. Again, this doesn’t even include discretionary spending.
We also highlighted how big US interest expenses could get depending on where US rates wind up.
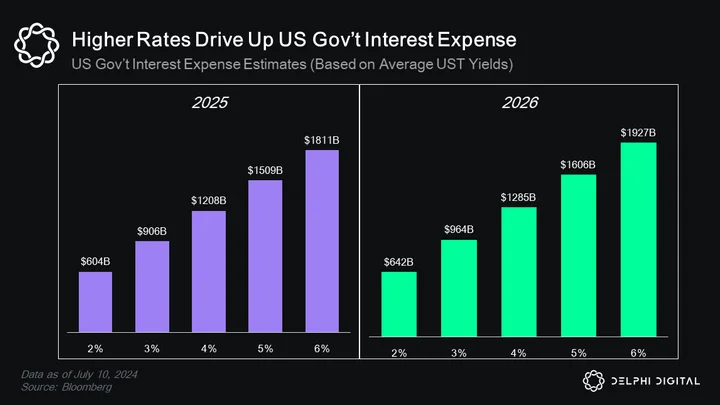
The USG’s interest bill on its swelling $34 trillion public debt is already ~$1 trillion per year alone. For context, that’s equivalent to ~4% of US GDP and ~20% of the USG’s total revenue in FY 2024.
The Fed makes a concerted effort to keep its distance from commenting on fiscal policy, but what the Fed does from here will have a direct impact on this growing segment of US gov’t spending.
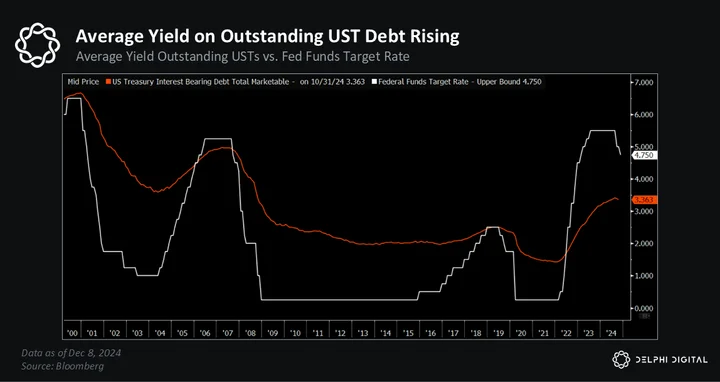
Meanwhile, the US Treasury has to rollover nearly $10 trillion of debt over the next 12 months.
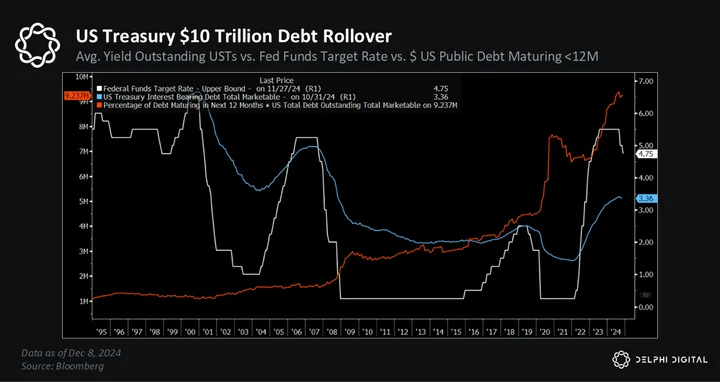
That’s over 30% of annual GDP.
At the end of the day, continued fiscal deficits will increase US public debts, which requires more liquidity, more monetization and more currency debasement.
Which is good news for holders of scarce assets (equities, RE, gold, BTC, crypto).
When it comes to global central bank liquidity over this past year, the PBOC has done most of the heavy lifting — especially in the back half of the year.
This is another trend we’ve talked ad nauseam about. The bottom line is that the PBOC is one of the two most influential central banks when it comes to global liquidity — and therefore global markets.
What happens in China matters. It has always mattered.
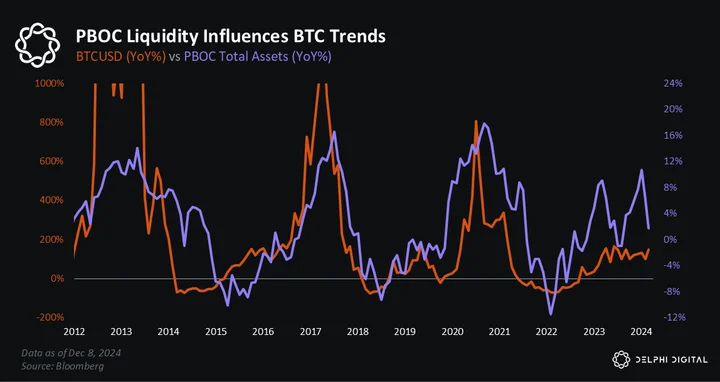
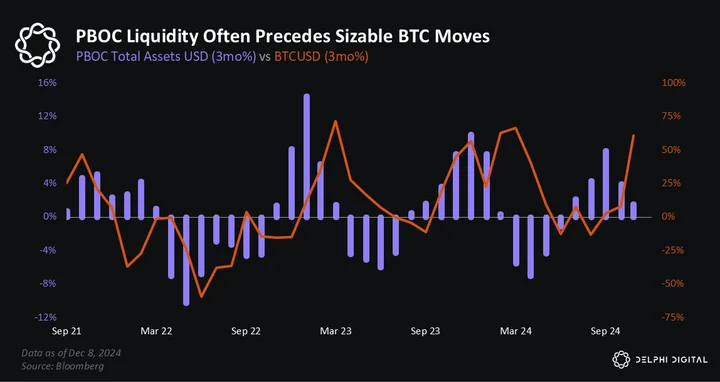
PBOC liquidity played a role in the 2020/21 crypto bull market, the 2022 bear market, the late 2022/early 2023 recovery from cycle lows, the surge in Q4 2023 (ahead of BTC ETF approvals), and the Q2-Q3 pullback earlier this year. PBOC liquidity even turned positive again a few months ahead of the 2024 US Presidential election.
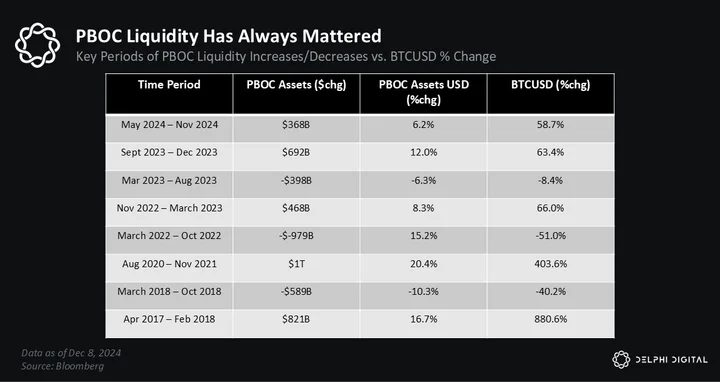
Changes in PBOC liquidity often precede large volatile moves in BTC and crypto markets.
Last year, we reminded readers that risk assets had one of their best years in 2017 despite consistent Fed rate hikes and QT expectations.
“During this time, the PBOC’s balance sheet was also expanding, and coupled with a weaker USD, helped give risk assets the liquidity boost they needed.”
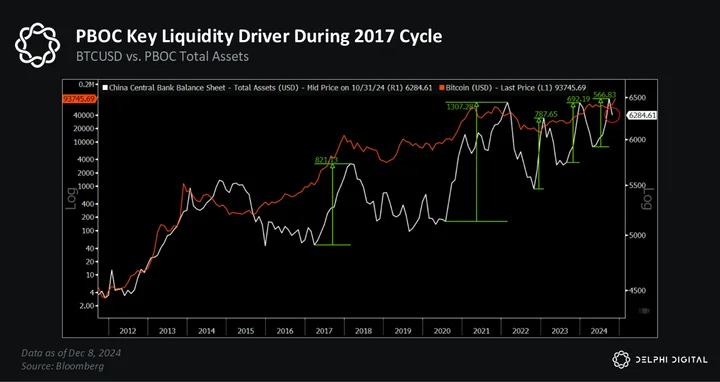
This is similar to what we’ve seen play out for much of this year — China has been the bigger driver of central bank liquidity.
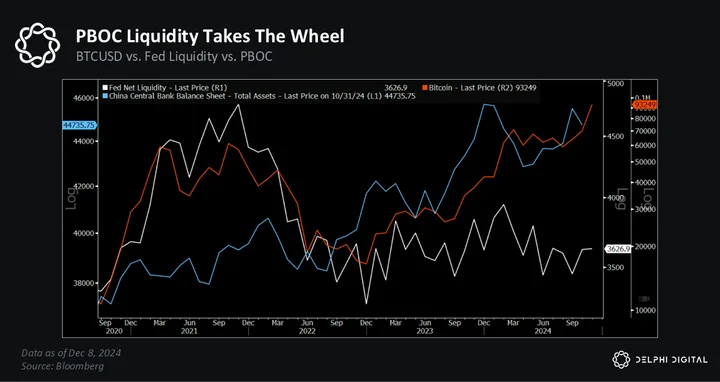
We’ve previously discussed some of the reasons why PBOC liquidity should continue to expand in 2025 — and the impact that it can have on global markets, BTC, and the spillover effects on global growth.
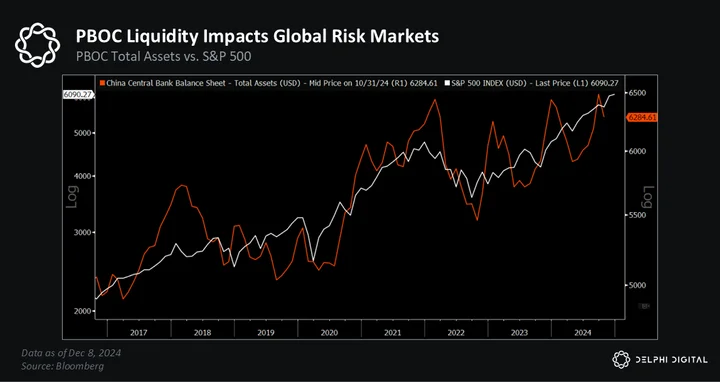
In last year’s report, we noted the PBOC’s balance sheet expansion and the additional boost that could give US equities.
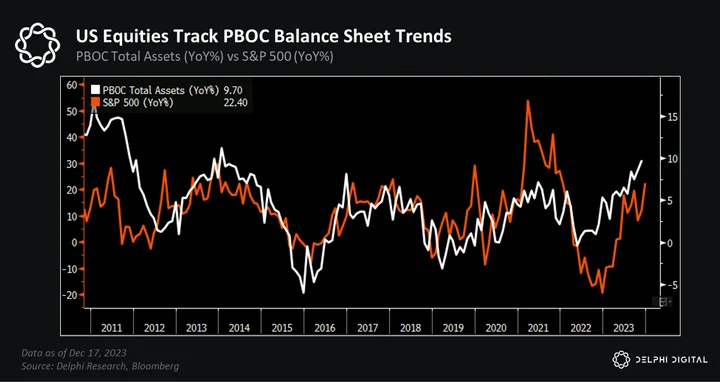
The SPX is up nearly 30% this year.
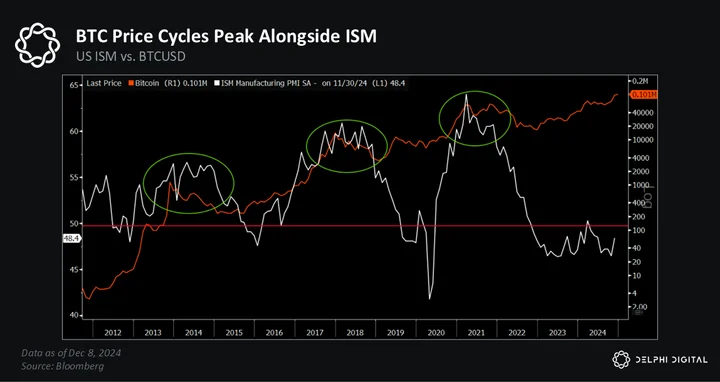
We’ve also noted how closely it tracks changes in the US business cycle.
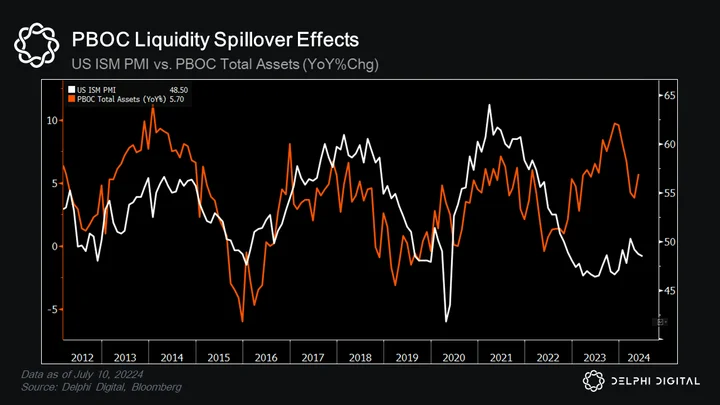
To be fair, the recovery in the US ISM has been more muted than we had expected so far.
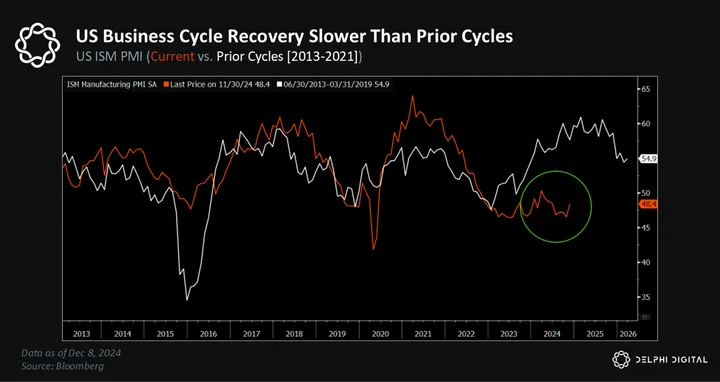
But several indicators imply it will start to trend higher into expansionary territory in 2025 amidst a supportive liquidity backdrop.
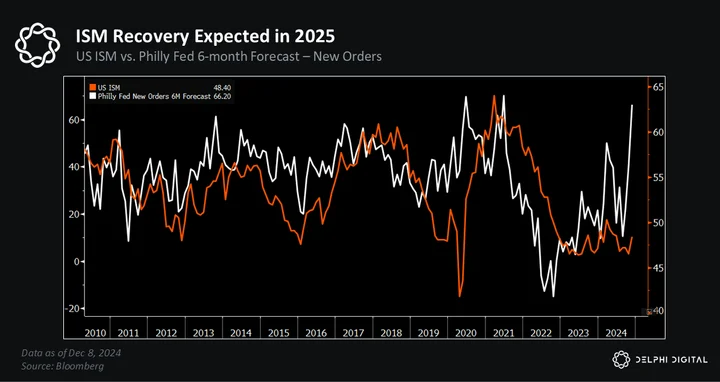
This is more good news for stocks…
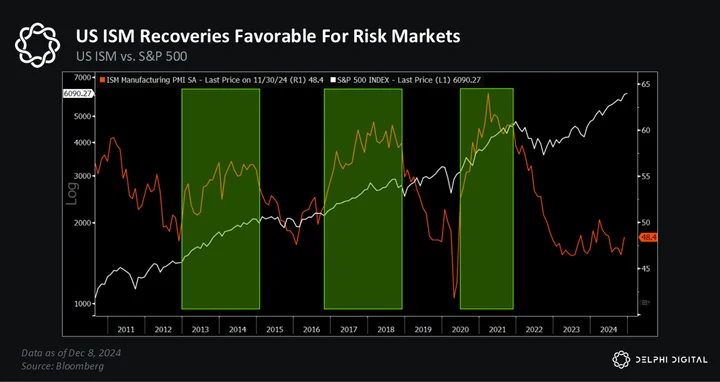
And more good news for BTC.
We’ve talked about some of the similarities between the current setup and the setup we found ourselves in during the 2017 cycle too.
But unlike 2016-2017, the Fed is in the early stages of cutting rates — not hiking them.
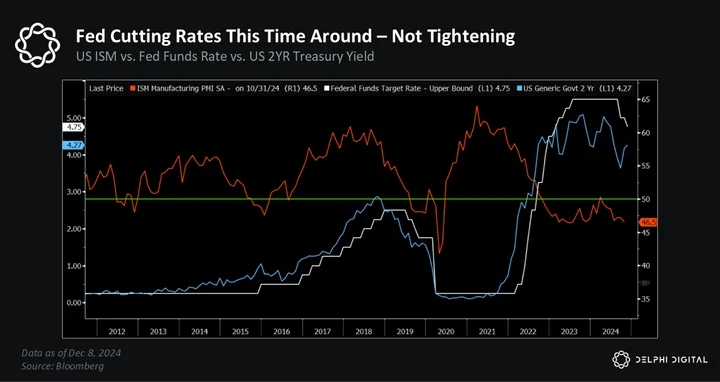
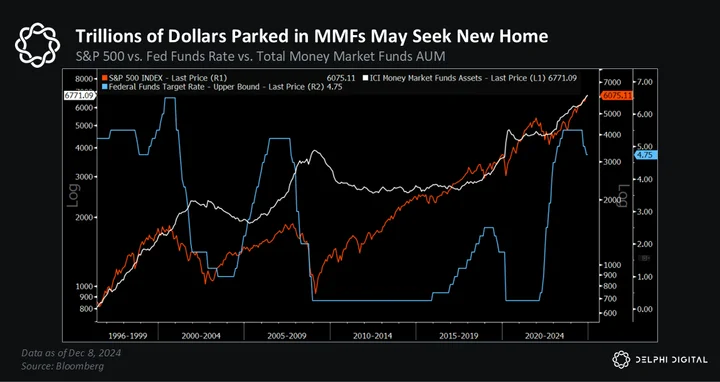
There’s now over $6 trillion sitting in money market funds too, some of which will flow out in search of higher returns. We’ve seen this happen during previous rate cutting cycles.
And this isn’t just a US-centric trend either.
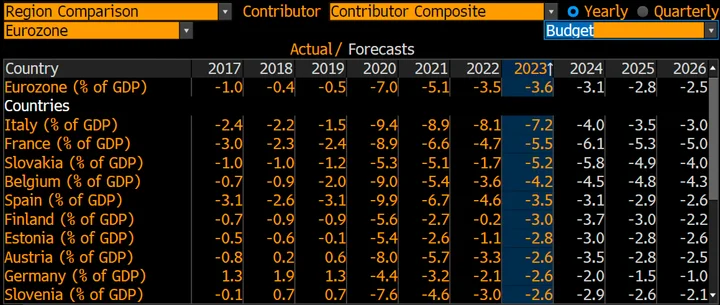
The ECB, for example, is projecting a more dovish path forward as the Eurozone faces genuine stagflation concerns. Many Eurozone countries are likely to continue running mid-to-high single digit deficits as a % of GDP.
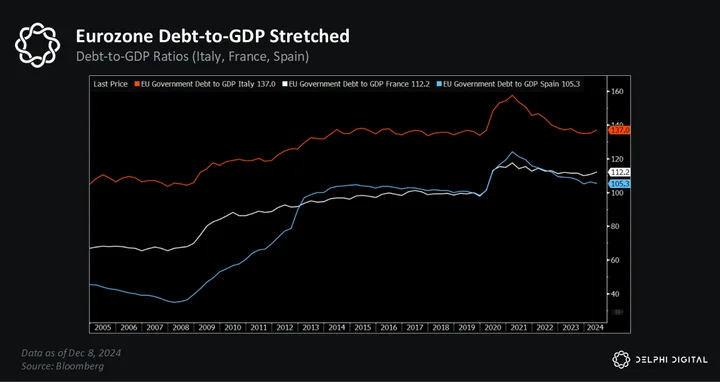
Even as several of the largest EU countries are already running considerably high debt-to-GDP ratios.
That’s not to say global policymakers are back in full blown easing mode — we’re not going to see the size and swiftness of monetary and fiscal stimulus we saw back in 2020-2021. But the trend towards easing over tightening helps support markets, and an already resilient US economy.
It’s not perfect — there’s plenty of people still struggling with higher consumer prices, and lower income households are facing wallet pressures. But we’re not staring down the barrel of a deep imminent US recession, which historically has been the one big consistent headwind to risk markets.
Our view is we’re still in the midst of an upward liquidity cycle.
Lower interest rates and sustained economic growth should support favorable credit conditions. Expansions and contractions in private credit growth also increase or decrease the amount of money sloshing around global capital markets.
Which again benefits BTC.
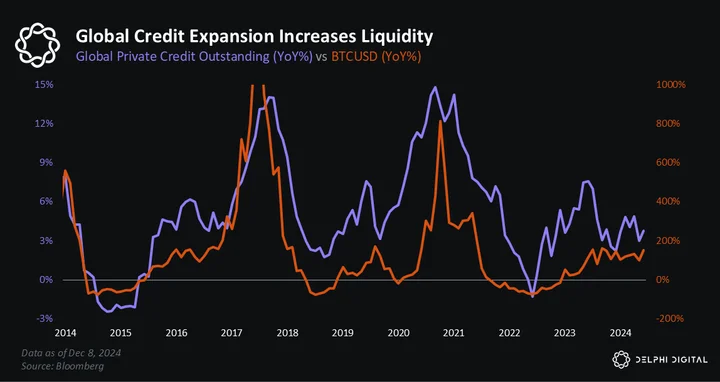
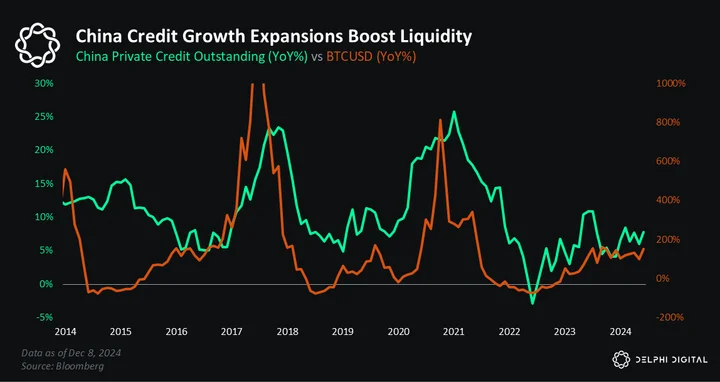
China has a big influence here given the size of its private credit market, which has grown 3x faster than the US over the last 10 years.
Global private credit growth has a strong correlation with Global M2 growth.
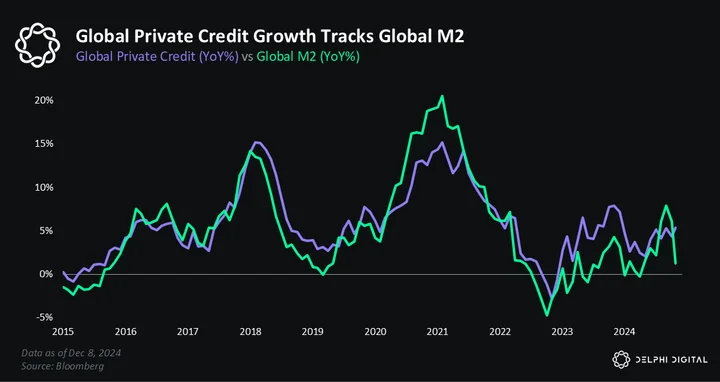
We believe Global M2 growth will continue to make new highs next year (even if the ride is a bit bumpy). Remember, Global M2 is still coming off one of its worst contractions on record.
“Global M2 grew at an average annual rate of ~5% in the prior decade pre-COVID. If its growth rate were to revert back to just 3% per year, that’d equate to a $7-10 trillion rise in Global M2 over the next 2-3 years — which would certainly bode well for for risk assets, with BTC and the broader crypto market at the forefront.” — Dark Night Rises
If the outlook for macroeconomic conditions is generally favorable as we wade into 2025, where do crypto markets head from here?
Key Theme: Optimism Returns
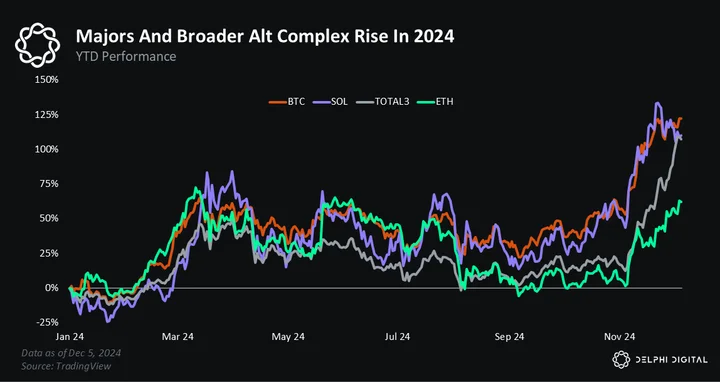
2024 was a weird year for crypto markets. On one hand, most of the majors recovered to ATHs, and the broader alt complex staged an impressive recovery.
But Crypto Twitter also spent most of the year infighting and coping. Obviously, CT is always a neurotic mess, but this year’s poor sentiment stands out as it drew such a sharp contrast to the otherwise positive price action.
Blast szn – RUGGED
Base szn – RUGGED
FTM szn – RUGGED
Aptos april – RUGGED
Tia and Dym Airdrop szn – RUGGED
ETHBTC – RUGGED
Wormhole – RUGGEDI’m starting to think you guys are all frauds when it comes to anything that’s not a micro cap or a dog coin on solana
— ً (@SilvXBT) April 29, 2024
What explains this dichotomy? Well, several things. The first is Bitcoin dominance. BTC had a monster year driven by ETF flows and Trump. These trends drove its price up over 130% YTD and pushed its dominance to a three-year high.
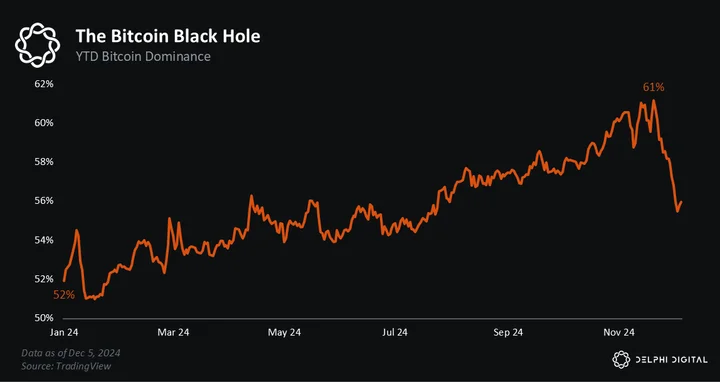
Rising dominance intuitively means that Bitcoin outperformed most other cryptoassets. And since CT is wildly underweight the orange coin, most crypto natives did not benefit from this BTC-led market regime.
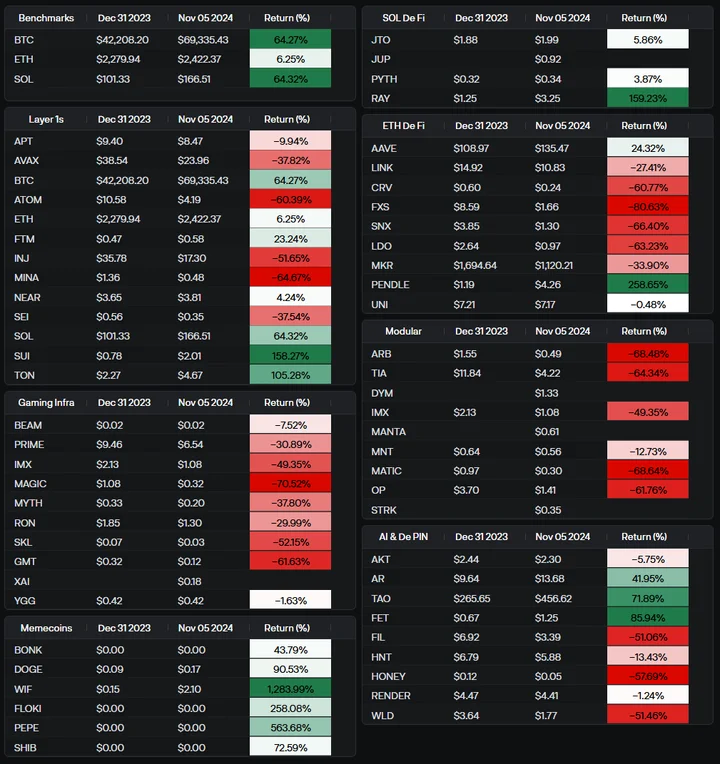
The second driver of poor sentiment was dispersion. This is just a fancy way to say that a few coins went up A LOT, some went up a little, and most actually went down or were flat. As the chart below illustrates, there were small pockets of extreme outperformance but also whole lotta red, which is notable on a year that Bitcoin pumped north of 100%.
*@ceterispar1bus — YTD Performance thru December 5th*
The dispersion we saw this year was new for crypto markets. In past cycles, everything traded together. When BTC pumped +1%, ETH usually jumped +2%, Alts +3%, and so on. But this cycle was different. The rising Bitcoin tide did not lift all ships. And the classic ‘Path to Altseason’ that so many people grew accustomed to failed to materialize.
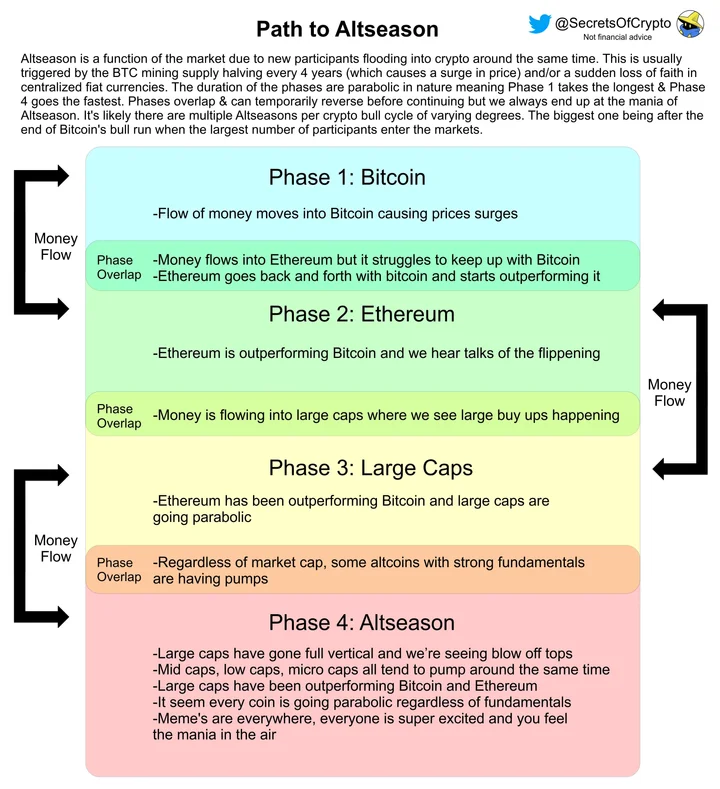
However, one sector did pump — memecoins. As a result, this cycle has been dubbed the ‘Memecoin Supercycle’ — a prognosis we support. Memes were by far the best-performing sector in 2024.
They first exploded onto the scene in Q1, catching many people offsides. They contributed to the unexpected rise of the barbell portfolio — majors and memes — which drove widespread underperformance and led to a stupendous amount of cope through the first half of the year.
I put $1k into this coin 20 days ago pic.twitter.com/Rb8J33j1EC
— blockgraze (@blockgraze) December 13, 2023
Memecoins are the third and final reason for poor sentiment this year. Our thinking here is twofold.
First, no one likes to watch other people get rich while their bags go sideways. And second, memecoins contributed to the sense that crypto is just one big ponzi. We wrote about this at length in our Attention Is All You Need report. But at a high level, memecoins triggered some existential angst and soul-searching within our space.
- do fundamentals matter?
- is everything a meme?
- is crypto just a casino on mars?
in the collective public imagination, crypto oscillates between the future technologically unified global financial system and the largest scam in human history
how can the narrative seemingly alternate between these two extremes, and do it every 2 years?
— olaf (@zxocw) September 12, 2022
As Olaf eloquently puts it, crypto gyrates between ‘it’s all ponzi’ and ‘this tech is going to change the world.’ The former dominated the discourse in 2024, but we believe 2025 will bring a shift towards the latter. In other words, optimism will return to crypto markets. We think two major trends will drive this shift:
- structural inflows
- futuristic narratives
The first driver comes down to supply and demand. In 2024, the new money that flowed into crypto was narrowly focused. Although BTC received historic inflows, most of the wealth creation didn’t trickle down into the broader altcoin complex. We expect this to change in 2025 thanks to stablecoin and ETH ETF inflows — both of which are inflecting up right now.
Stablecoin inflows will boost liquidity in the system, while a rising ETH price is good for the long tail of tech alts and fundamental tokens since ETH is one of the most widely held assets in crypto.When ETH pumps, it creates leverage in the system as traders borrow against their ETH bags to buy other tokens. People also generally just feel more wealthy, which increases risk appetite and bullish sentiment.
This year, a narrative has emerged that “ETH pumps are bearish.” While we find this hilarious, we believe 2025 will flip the script and Make ETH Pumps Great Again. We will miss the memes, though…
$ETH rallies over the weekend and the whole market dies. Classic🥲 pic.twitter.com/3HrBjikrct
— Mercury (@TraderMercury) April 29, 2024
The second driver of a return to optimism is crypto markets learning to dream again.
This one is more psychological than structural. When everyone believes the market is PvP, then the market indeed is PvP. But when everyone believes the market is PvE, then, well, you get the idea. These narratives are reflexive.
In 2024, we saw a mix of PvP and PvE dynamics, but for most of the year, it was PvP. This is markedly different from the last cycle, which featured an Everything Pump. Back then, we also had the birth of entirely new sectors — L1s, DeFi, GameFi, and many others. But this year, it’s been almost all memes.
I often wonder if I’m in the wrong industry.
Take SpaceX for example. They send a rocket to Mars? Humanity advances. They fail to send one and blow it up? Humanity learns a lesson and advances. All outcomes lead to progress.
In contrast, crypto is a damn casino for dum-dums…
— Péter Szilágyi (karalabe.eth) (@peter_szilagyi) August 5, 2024
Don’t get us wrong, we love memecoins, but they present an inherently less optimistic worldview than tech alts that aspire to change the world. Last cycle, we had many different flavors of world-changing ideas. But this cycle has felt less ambitious.
We expect this to change in 2025 as a renewed sense of optimism takes hold across our industry. People will start to believe in crypto again. It will no longer just be “all memes.” The catalysts for this psychological switch-up may be hard to see today, but in hindsight, they will be obvious:
- Trump winning
- Truth Terminal
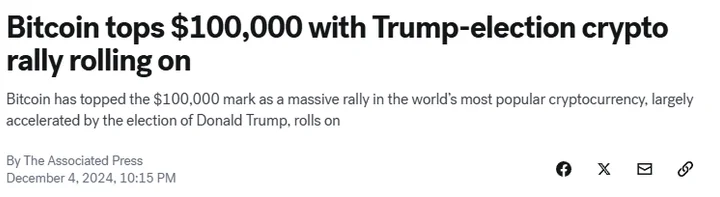
- Bitcoin $100K
We believe that by the end of next year, we will look back on these three events as the time when optimism finally returned to crypto.
Key Theme: The Missing Ingredients – Stablecoin Growth & Credit Creation
At their most fundamental level, markets are a function of supply and demand. When demand outpaces supply, prices generally rise. When supply outpaces demand, prices generally decline. This is as close to a ‘law of physics’ as we can observe in markets.

As we’ve alluded to in many of our reports over the past year, crypto markets have been facing a massive supply-demand imbalance. Simply put, overall crypto demand has not kept pace with overall crypto supply. But why?
Token Supply Is Too Damn High
The easiest way to observe supply-side dynamics is by looking at overall token numbers. Token supply can come from both from private markets and public market places.
When we look at coin aggregators like CoinMarketCap or CoinGecko, the token lists are over 100 pages long with over 10,000 tokens to choose from. This is in stark contrast to the 1000-1500 tokens making up these same lists in 2017, representing a nearly 10x+ increase in the number of tokens.
![]()
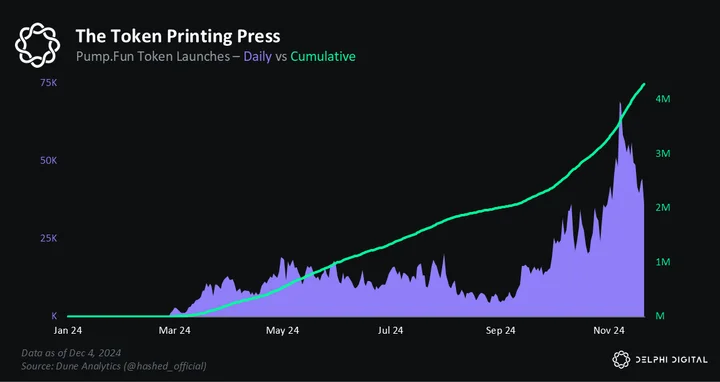
The crazy thing? These aggregators don’t even tell the whole story when it comes to public market token supply. Far from it. With the rise of applications like pump.fun on Solana, token creation has never been easier.
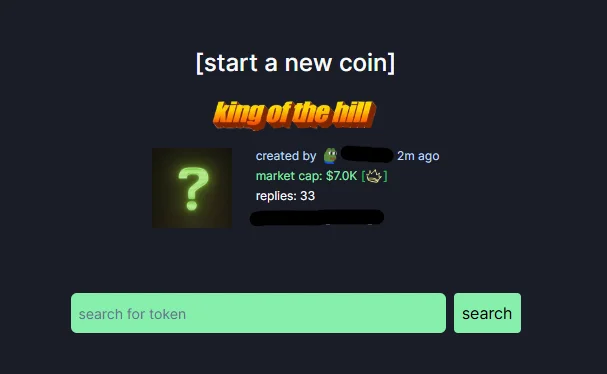
Since January 2024, more than 4 million tokens have been launched on pump.fun, with over 50,000 graduating beyond the bonding curve onto Solana’s Raydium. These numbers are simply mind boggling.
It’s so easy to launch pump.fun tokens that people now do it from within video games like Minecraft…
And these numbers don’t even account for increasing token supply resulting from private market investments. After ICOs received the ban hammer many years ago, private funding has taken the baton, becoming the primary way for early stage crypto projects to secure financing. Since the 2017 cycle, we’ve seen the amount of private capital raised (and deployed), increase significantly.
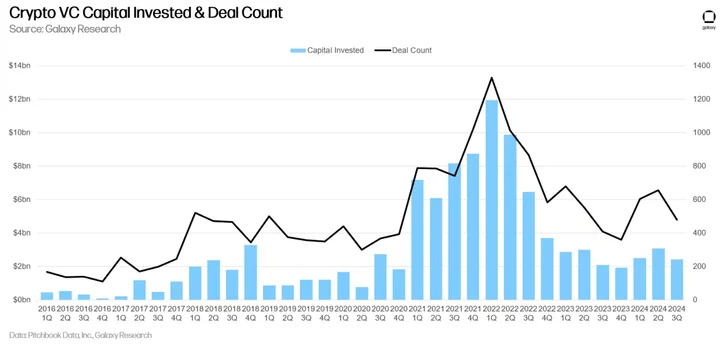
In Q2 2022, crypto VCs raised $16 billion, earmarked for early stage private investment. This results in even more supply entering the market — after all, funds and LPs need a return on their investments. Many of these 2021 and 2022 vintages are finally making their way into public markets. Today, the market faces the highest levels of new token supply ever.
The demand side of the equation tells a different story. Total crypto market cap is the easiest way of visualizing overall demand, and the trend has been clear:
- In the 2017 cycle, the total crypto market cap grew from ~$40B to ~$750B, an 18x.
- Last cycle in 2020, the market grew from ~$280B to ~$2.8T, a 10x.
- So far this cycle, the market has grown from a base of ~$1T to about $3.3T, just over a 3x. This was largely due to BTC outperformance — a direct result of ETF induced institutional demand — and the ‘Trump Bump’ starting in November.
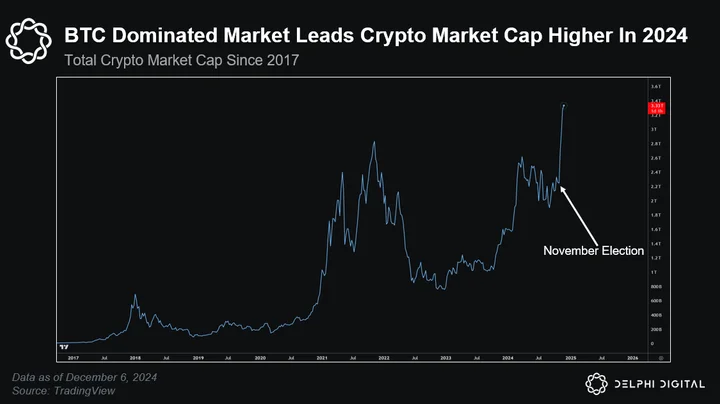
For the majority of 2024, the total crypto market cap had been hovering underneath the $2.5T mark, below prior cycle highs. This illustrates a clear lack of new demand entering the industry outside of BTC focused demand. But total crypto market cap doesn’t tell the whole demand story.
In a more granular sense, the crypto market can be thought of as BTC, and everything else known as crypto ex-BTC. As previously mentioned, BTC demand increased substantially this past year with the launch of BTC ETFs bringing an air of institutional acceptance into the space.
This demand has been reflected in ETF flows as well as in BTC price action. The maturation and acceptance of BTC has not come with the same acceptance for the entire universe of crypto assets, leading to increased industry segmentation.
We have not seen the demand for crypto ex-BTC assets keep pace with BTC-focused demand. This is glaringly apparent in metrics like TOTAL2 and TOTAL3, which were well below prior cycle levels until this past November.
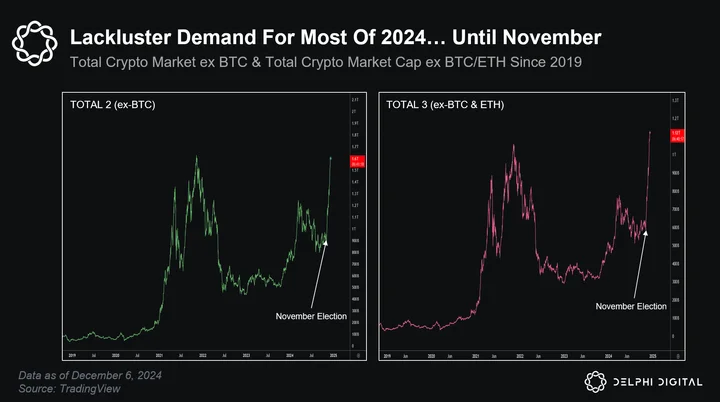
The TLDR? There is simply too many tokens and not enough demand for these tokens outside of BTC.
The Missing Ingredients
The current cycle has had two missing ingredients that help to explain much of the aforementioned supply/demand conundrum — stablecoin growth & credit expansion.
In the past, crypto markets were once more closely tied to BTC price action. This is because BTC was the main trading pair for altcoins, and the main collateral used within our speculative markets. In order to trade altcoins, you needed to buy BTC first. This was the process flow in the early days on exchanges like BitMEX or Poloniex. As with anything, times change.
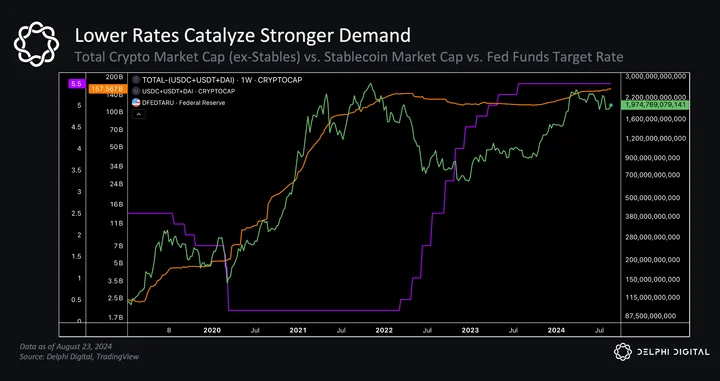
Over the last several years, crypto participants have moved towards stablecoin denominated trading pairs. Stablecoins are now the preferred base asset for speculation within the crypto markets. And stablecoins are very sensitive to interest rates. Coincidentally, the current market cycle is the first cycle in which interest rates began at elevated levels. Elevated interest rates weigh heavily on stablecoin driven demand dynamics.
High interest rates increase the hurdle rate for investors. If an investor can clip 4%-5% in risk free markets, they are less likely to take on more speculative positioning, and less likely to move capital on-chain via stablecoins.
A quick look at the numbers shows just how sensitive stablecoins are to interest rates:
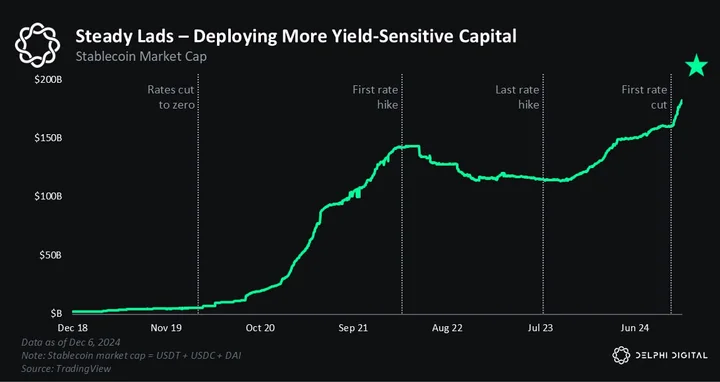
- In March 2020, the Fed cut rates to near zero and the stablecoin market cap was ~$5B. By the time the Fed started hiking rates in March 2022, stablecoin market cap had grown to over $130B (~25x).
- During the Fed’s rate hike cycle (March 2022-July 2023), stablecoin market cap fell by over $20B.
Additionally, elevated interest rates weigh on credit creation. When conditions are more conducive (lower interest rates), economic growth, increased consumer spending and asset price increases are easier to achieve. These are the conditions in which prior crypto market cycles thrived.
Just a few years ago, crypto lending markets (and crypto market prices) peaked amidst a backdrop of this low interest rate environment as it fueled an insatiable bout of risk appetite.
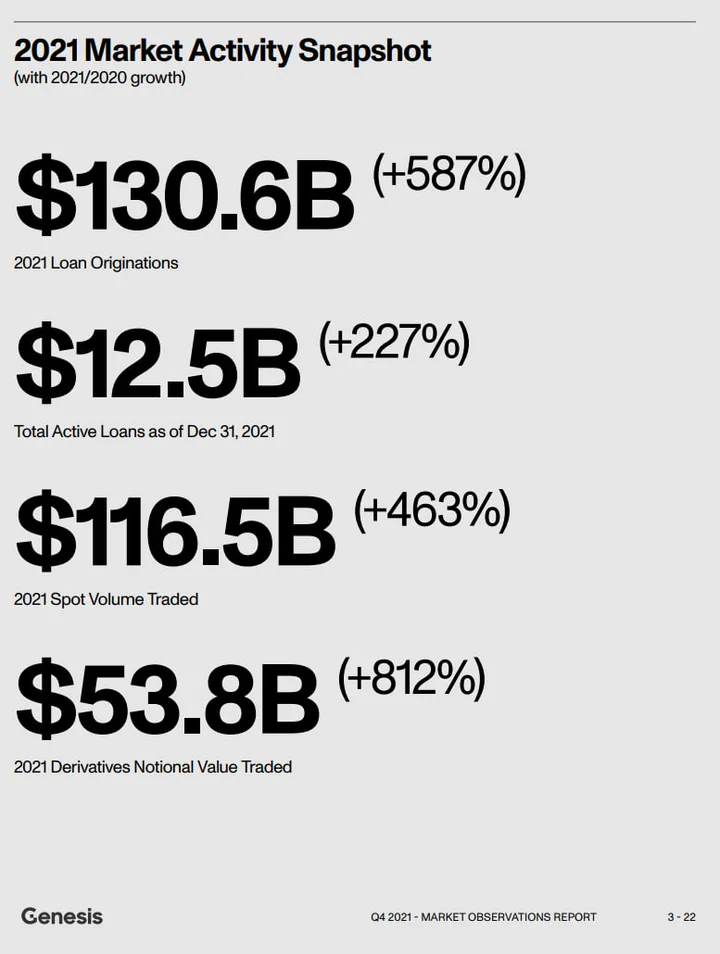
For context, Genesis’ loan book had $130B in originations, and nearly $13B in active loans at the end of 2021. These numbers don’t even include other key lenders like BlockFi, Celsius, and Voyager. Much of this credit made its way back into the crypto ecosystem, acting as a key source of demand for crypto assets, propelling prices to astonishing levels.
Since Powell pumped the breaks in 2022, hiking interest rates at an unprecedented pace to combat soaring inflation, stablecoin growth and crypto credit creation have suffered tremendously. Many of the centralized lending institutions that helped propel crypto markets to new heights no longer exist. Two of the key catalysts of last cycle’s ‘everything rally’ have been entirely hamstrung.
However, we’ve finally reached the turning point — Powell’s Pivot. In September 2024, the FOMC cut interest rates by 75bps, with several additional rate cuts expected over the next 12 months.
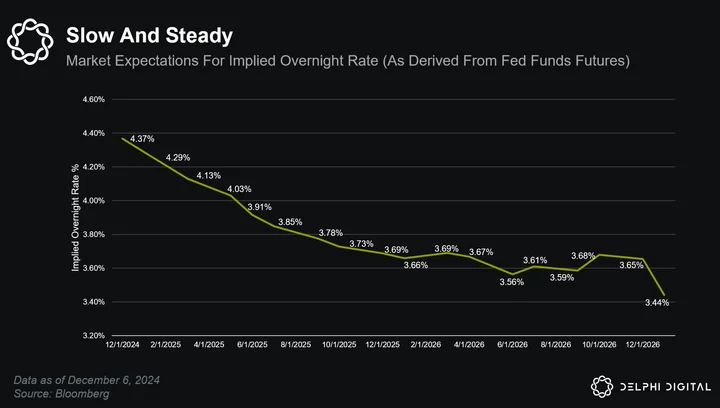
As we know, lower interest rates reduce the hurdle rate for investors, and should incentivize more speculative behavior. In crypto markets, this manifests itself in the form of stablecoin growth and increased credit creation.
Additionally (and perhaps more importantly), the US Presidential Election has provided crypto markets with the assurances of a significantly less-harsh regulatory environment. Markets hate uncertainty, and the results from this year’s Presidential race relieved some of the uncertainty weighing on the crypto industry at large.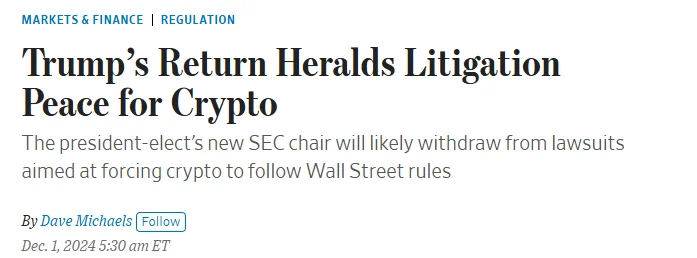
The combination of these two developments bodes extremely well for stablecoin growth, crypto credit creation — and by extension — crypto markets. Lower interest rates combined with a more friendly and transparent regulatory environment have the potential to unleash the demand needed to finally counteract the supply-side imbalances that have been stifling crypto markets.
While it is unlikely we see credit creation reach the levels we saw several years ago, we do not believe it is as necessary for crypto markets to soar — we think that will largely come from stablecoin growth. Since the election, overall stablecoin market cap has grown by nearly 15%, or $20B.
We believe this trend will continue well into 2025, with stablecoin market caps continuing to move up and to the right, eventually topping out above the $200B-$250B range — ushering in a reversal in fortunes for the broader crypto market.
So, which crypto sectors and assets are primed to be outsized beneficiaries of this trend?
Key Theme: Meme Continuation, Pivot to Fundamentals… or Both?
2024 gave rise to the Major-Memecoin barbell portfolio. We wrote about these dynamics extensively in The Dog Days of Summer and Attention Is All You Need deep dive reports.
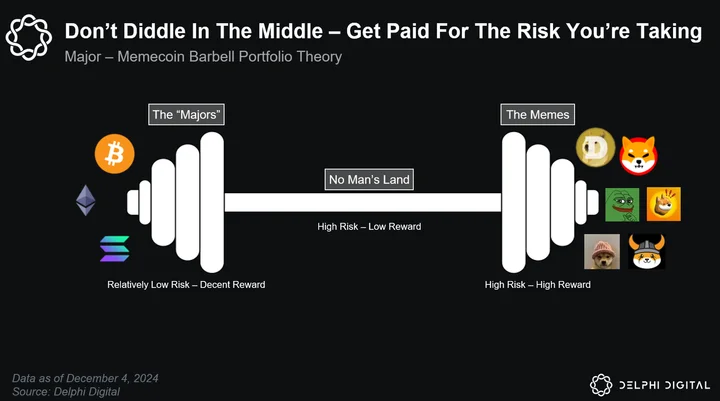
Are these market dynamics set to stay the same and are we in for another year of memecoin dominance?
Or have crypto markets finally turned the corner and are we returning to a reality driven by fundamentals?
As with most things, the truth probably lies somewhere in the middle.
Turning The Corner
First and foremost, we noted the waves of change splashing over crypto markets in the “Optimism Returns” section of this report. For the first time in years, the future outlook for our industry is particularly exciting, and even those outside of the most devout crypto market participants are starting to take notice. Markets are forward looking, and when the future is bleak with despair, industries and assets suffer. When the future is bright with hope, industries and assets flourish. Crypto markets have begun moving out of the darkness and into the light.
We’ve seen BTC rip to above $100K. We’ve seen crypto related equities like Coinbase and even Robinhood go on substantial rallies and expand their product suites. We’ve even seen traditional equities like TSLA rally significantly as well. All of this, in our view, can be attributed to the harsh regulatory regime discount finally being closed as we move into the new four year term under the incoming Trump administration.
If campaign promises are to be believed, the days of regulation by litigation for the crypto industry are likely behind us, and clear rules and regulation are finally within arm’s reach. The industry will finally be governed fairly, and not by those who wish to see it destroyed.
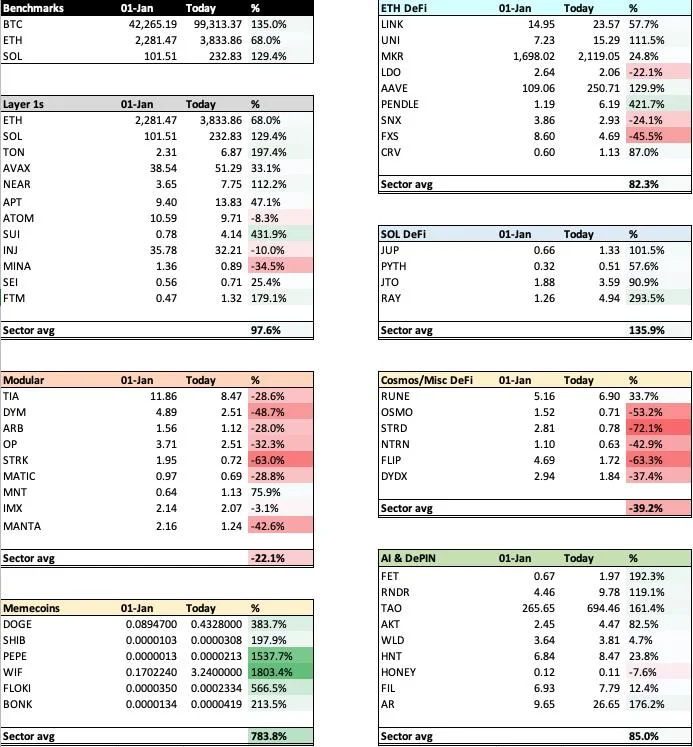
Prior to the November election, outperformance was extremely segmented. Majors and Memes performed extremely well, while fundamental coins, such as those within the ETH/DeFi sectors, languished.
Delphi Scope
Since the election, the outlook could not be more different. We no longer see an extremely segmented industry, but an industry moving in tandem. This is epitomized by the strong bid return to the fundamental-esq sectors that had previously been left behind for the prior 10 months. Up and to the right, as they say.
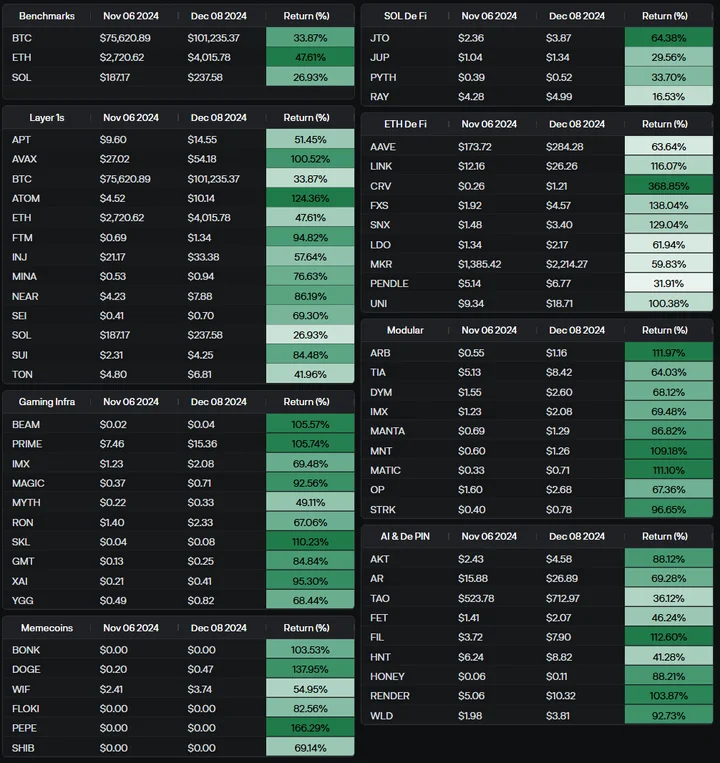
Delphi Scope
We have consistently written about how one of the best signals of future outperformance is to monitoring which assets perform best out of key inflection moments. This past November is one of those moments and the signal is clear.
The Institutions Are Coming (Real)
Until this past year, institutional capital has been extremely hesitant to touch anything crypto related. The threat of regulatory uncertainty was far too great. This began to change, with the begrudging SEC approval of spot BTC ETFs, laying the ground work for future institutional investment.
The removal of a hostile regulatory regime, replaced with one that promises to regulate fairly and provide clear rules, opens the industry up to even greater capital investment. It is no longer seen as a career risk to invest in this burgeoning industry, but rather a career risk to avoid it. If it’s good enough for BlackRock ETFs (and perhaps the US Government with talks of a Strategic Bitcoin Reserve), it’s good enough for institutional investors.
These institutional investors are going to look for investment opportunities that feel familiar. While some of these players may dabble in memecoins, they are much more likely to be interested by assets in sectors like ETH/SOL DeFi or Infrastructure versus a dog wif a hat.
Look no further than the contrast in ETH ETF flows pre- and post-election, signaling a clear shift in institutional demand for crypto assets outside of BTC.
Institutions will look towards assets that generate fees or yield, and can be modeled in a somewhat similar vein to what they are familiar with in the traditional finance world. We believe this is what the ‘sophisticated, institutional’ class of investor will most likely gravitate towards the most. After all, familiarity can lead to a sense of comfortability.
Markets are waking up to this realization, which can be seen with the recent rallies in the aforementioned sectors. As traditional money managers make their foray into crypto, big money will be made by those who can front run their flows and investment picks.

So while the last 12 months has been captured by the Major/Memecoin barbell portfolio, we think the year ahead will be characterized by something more reminiscent of the ‘everything rally’ from prior cycles —with a renewed vigor and emphasis placed on fundamentally driven projects. These may be assets like OG DeFi, both with an emphasis on proven track record and battle-tested. They may be in infrastructure assets, akin to the L1 trade we’ve seen in the past. They may be RWAs or even newer sectors like AI or DePin.
This doesn’t mean we will see every single coin go on to rally triple digits like we saw last cycle, and this does not mean the end of memecoins — memes are definitely here to stay. What this likely means is a new beginning and the start of a more broad-based crypto rally, fueled by a rising tide that lifts all ships.
Key Theme: Solana Accelerates
2024 was a big year for Solana. Two years removed, and the ecosystem is almost unrecognizable from the FTX lows. But despite all the change, the outlook for SOL remains similar to this time last year. Solana is ascendant, Ethereum is in disarray, and no other L1 looks quite ready to break the duopoly. Of course, much has transpired over the past twelve months, as we will soon discuss, but it’s striking how much of our original Solana thesis in the 2024 Markets Year Ahead report still holds.
At the time, we wrote that all the lower-level data pointed in Solana’s favor; the EVM ecosystem was fragmented and hard to allocate to; and Solana had more narrative ‘shots on goal.’ Fast forward to today, and all these things still ring true. But regurgitating the same talking points would make for a rather boring report. So, instead, let’s recap some history and re-underwrite our Solana thesis with fresh eyes.
A few months before two coffee and a beer. Spooky pic.twitter.com/uDBK5Qyd38
— toly 🇺🇸 (@aeyakovenko) March 1, 2022
Out Of The Ashes Rises The Phoenix
Solana was the soaring Phoenix of last cycle. At the start of 2021, SOL was trading under $2, and the chain was still relatively obscure. But that all changed the day SBF started bullposting and threw the full force of FTX behind the fledgling L1. SBF was responsible for birthing Serum, one of the more innovative DeFi primitives at the time. And he also pumped hundreds of millions into the ecosystem via venture dollars.
I’ll buy as much SOL has you have, right now, at $3.
Sell me all you want.
Then go fuck off.
— SBF (@SBF_FTX) January 9, 2021
SOL ran from $1 to $260 — in one year (!) — amid the broader “Alt L1 trade” and thanks to its “Sam coin” status. The ecosystem was still nascent, but all the hype helped onboard teams like Jito, Drift, and Helium — all of which would go on to become foundational pieces of the network.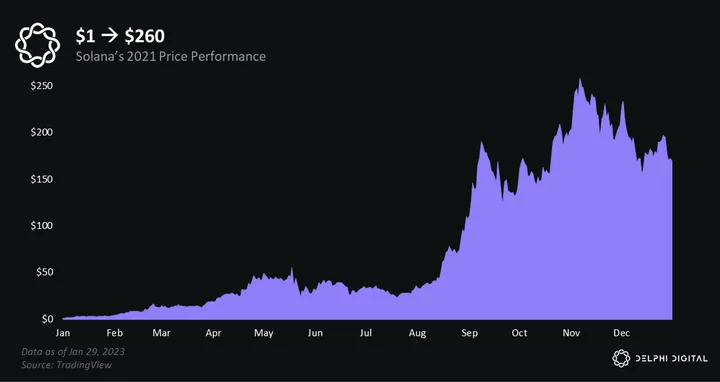
Ultimately, Solana flew too close to the sun. And in 2022, the Phoenix met its inevitable demise. Solana was consumed in flames and reduced to ash. This was triggered by the massive fraud at FTX, the broader bear market, and questions over the chain’s stability.
From pico top to pico bottom, SOL drew down -96%.
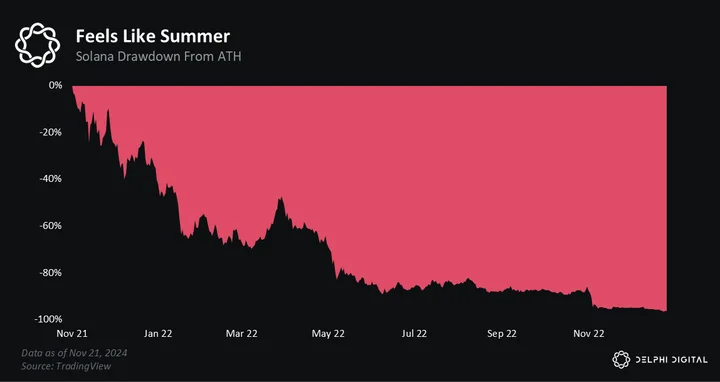
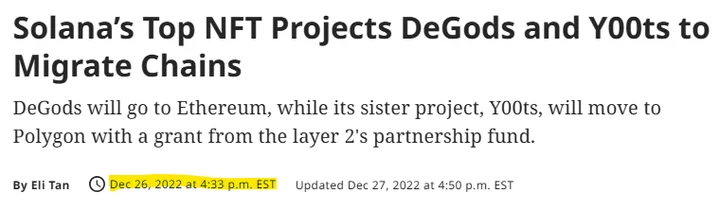
It was the kind of drawdown that kills most startups. And it nearly did Solana in. Over the course of 2022, capital fled, projects shuttered, and retail disappeared. It was a dark time for crypto markets, but particularly Solana. Many left the chain for dead. Ethereum and even Cosmos were seen as safer bets at the time. It didn’t help that several high-profile Solana teams pivoted to Ethereum near the stone bottom, reinforcing this narrative.
But then something weird happened. A memecoin called ‘Bonk’ airdropped 50% of its supply to the Solana community on Christmas Day 2022. SOL was trading around $11 at the time, and there weren’t many reasons for optimism. But Bonk was the start of something bigger. It rallied the few remaining devs and provided an injection of hope.
One day people will realize what Bonk did for Solana
– Created at the stone cold bottom of the bear market around $10 SOL
– Jumpstarts Solana’s DeFi ecosystem
– Sells out the Solana Saga phone
– Provides the foundation for WIF, MYRO and many others creating a memecoin culture— Solana Legend 🎒 (@SolanaLegend) June 9, 2024
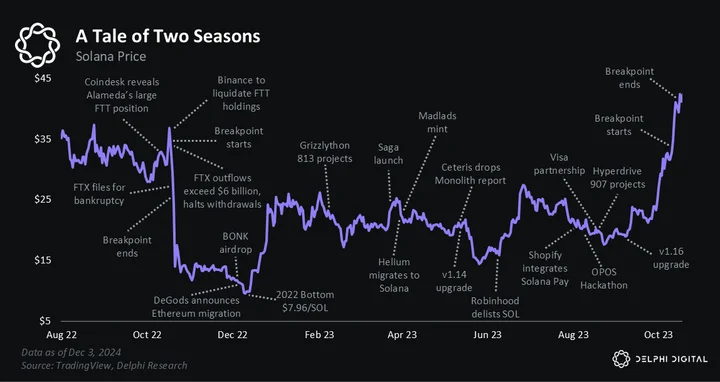
SOL put in its bottom at $8 a few days later on December 29th, capping a soul-crushing year for the chain. Amid the pain of 2022, not even the most delusional manlets could have predicted what 2023 would bring.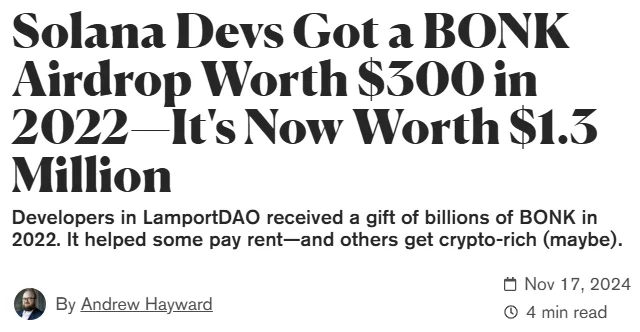
From the ashes, a faint glow emerged in 2023 — the Phoenix began its slow and painful rebirth. It was a year of rebuilding for Solana. The dozen or so teams that stuck around through the bear market used the pain of 2022 to grind harder. There weren’t many users back then, but that didn’t matter. Teams like Drift, Jito, and Tensor iterated relentlessly for the core power users that remained.
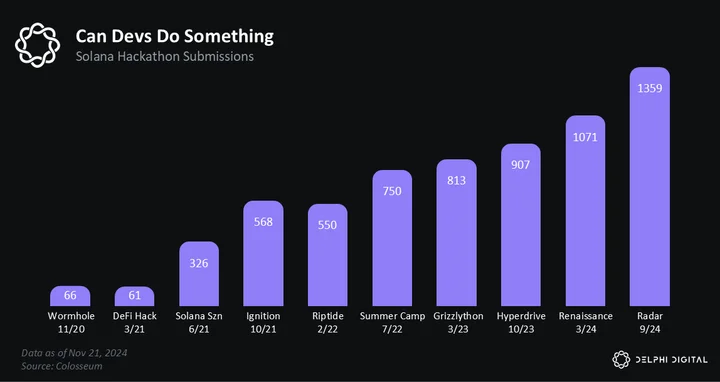
If we had to pinpoint a singular inflection point for Solana’s revival, it would be the hackathons. At the time, they were criticized for being “centralized.” But in hindsight, they were a GTM masterclass. They brought new devs into the ecosystem and, more broadly, injected some sorely needed momentum into the community. The builder energy they inspired ultimately culminated in Solana winning several big BD battles — Helium, Shopify, and Visa.
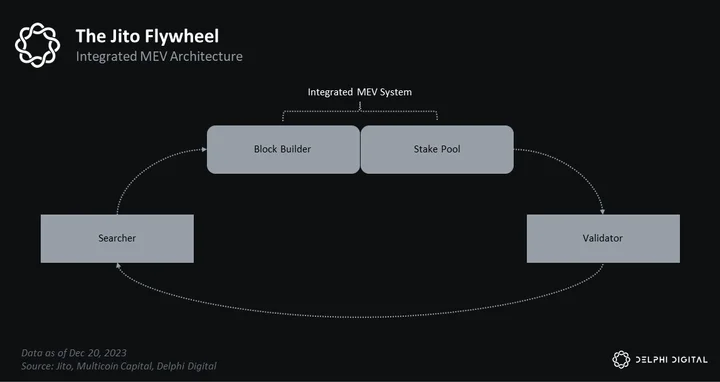
If 2023 started with a glow, it ended with a flame. It was the Jito airdrop on December 7, 2023, that provided the spark. Jito was one of the few teams that doubled down on Solana in the middle of the bear market and by the end of 2023, they had built some critical infra for the chain.
The Jito airdrop will likely go down as one of the greatest wealth-creation events in crypto history. If you held just $1 of JitoSOL, you would have received ~$10,000 worth of JTO. But many people received much more. It was life-changing money that quite literally changed the trajectory of the chain. The airdrop also shocked the broader crypto space, which had largely written Solana off. As a result, the airdrop ignited a wave of fomo flows.
The JTO airdrop was also perfectly timed. The only people on Solana at the time were the true believers — the couple hundred manlets who refused to capitulate. This meant Jito was able to get tokens into the hands of Solana OGs and sidestep mercenary farmers. The airdrop was a UNI-style moment for the Solana faithful and minted many millionaires. It will probably never again be replicated on Solana. But there’s a chance it might on another downbad chain in the future.

Midjourney
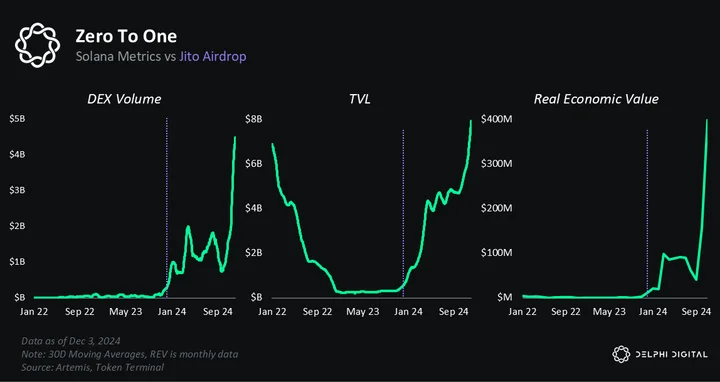
In 2024, the Phoenix was reborn. Solana emerged from the ashes stronger and more powerful than ever. The momentum from the Jito airdrop carried over into the new year as more teams started to airdrop. This created an even larger onchain wealth effect, which led to more activity, more inflows, and more attention. But not everyone was convinced. Many people dismissed it as “all airdrops.” But this proved short-sighted as just a few weeks later, a string of memecoins electrified crypto markets with their rapid ascents.
Nevertheless, the doubters dug in and moved on to calling Solana “all memecoins.” The narrative at the time was memecoins were less innovative than past speculative waves like food farms during Ethereum’s DeFi summer. While this argument made sense on some level — looping across farms is slightly more sophisticated than aping random shitters on Pump.fun — it falls flat because the only thing that really matters is people using the chain.
We must be careful not to judge how people use these chains. After all, we are investors, not priests. And from an investment perspective, usage is usage, regardless of its form. Usage creates a virtuous cycle of speculation → building → more speculation → and more building. This is how Ethereum built its DeFi ecosystem last cycle. And Solana has run the same playbook this year, except with memecoins, not food farms.
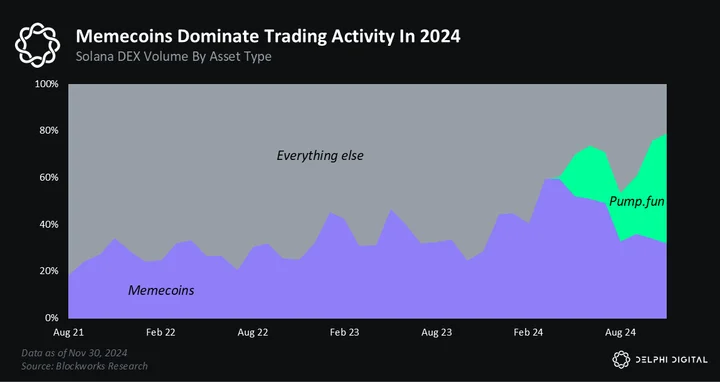
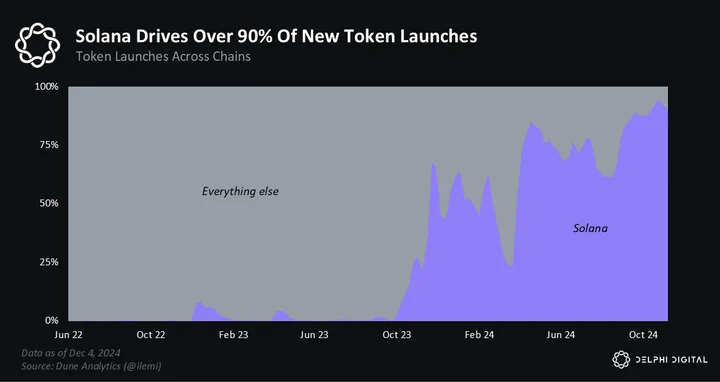
More broadly, Solana has dominated just about every new meta this year. First, it was airdrops. Then memes. And most recently, it’s been AI agents, err, ‘sentient memes.’ But above all else, memes have been the trend of the year. And they have dominated trading volumes across the space. Notably, most of this activity has happened on Solana.
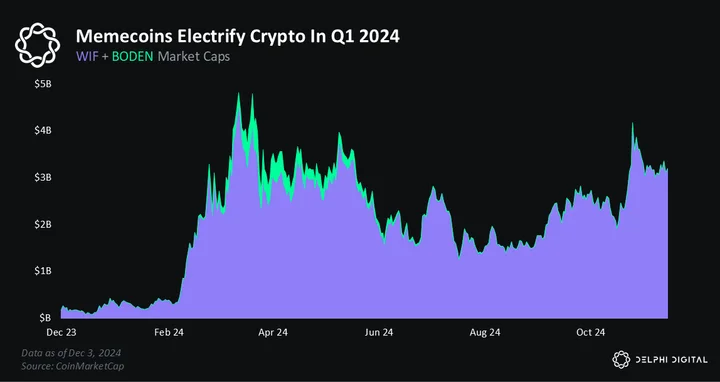
In the first half of the year, most of this activity was driven by ‘pure memes’ like WIF and BODEN. But ever since Truth Terminal, the meta has shifted to AI. Now, most of the hot new tokens are a quixotic AI x memecoin blend.
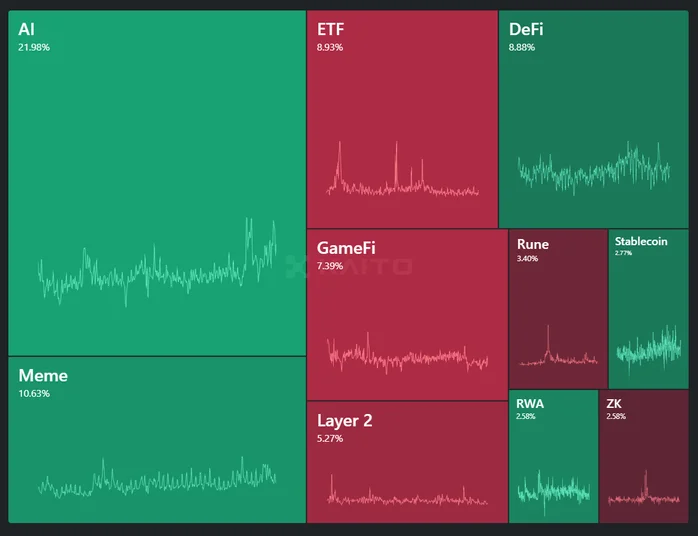
Kaito.AI Narrative Heatmap (2024)
Even if we think all of these metas — airdrops, PolitiFi, memecoins, AI agents, etc — are over-hyped and short-lived, it’s hard to ignore that they were all started on Solana. Yes, Ethereum mainnet has some popular memecoins. And yes, Base has seen notable AI activity. But all of the biggest trends this year have started — and been dominated — on Solana. It’s an incredible turn of events for an ecosystem that, just a few years ago, many had left for dead.
One of the best things in life you can be is hard to kill pic.twitter.com/7NSdlq6Qme
— prayingforexits 🏴☠️ (@mrexits) November 5, 2024
Solana’s 2025 Outlook
Solana experienced a renaissance in 2024. The chain went from “dead” to birthing all of the major metas in just a year. The rate of growth is staggering and even more impressive when you consider how young the chain is.
an overlooked fact about Solana is that it’s the youngest chain/asset in the top 10
we’ve grown this much while having the least amount of time
the cooking will continue
— mert | helius.dev (@0xMert_) December 7, 2024
But as we head into 2025, questions linger:
- Is the SOL repricing over?
- Will memecoin activity fade?
- Will Base steal market share?
- What about all the other high-performance chains?
- Will Ethereum finally wake up and fight back?
While these concerns are all valid, we believe Solana is just getting started. Competition is brewing, but we are skeptical that Ethereum will pivot fast enough or that all the new high-performance chains like Monad or Sui will be able to steal meaningful market share. In short, we remain extremely bullish on SOL — both on a relative and absolute basis vs assets like ETH.
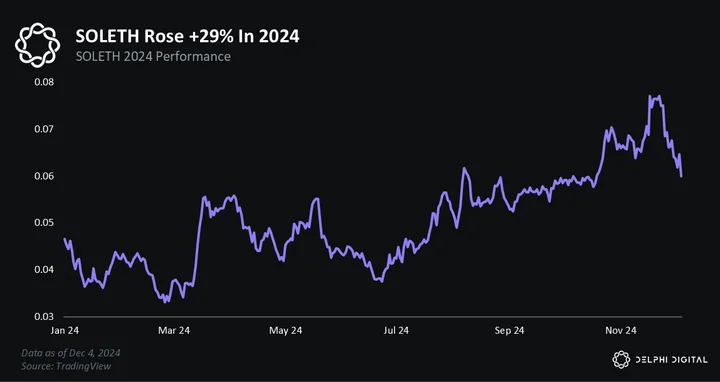
Our SOL 2025 thesis boils down to two core beliefs:
- Solana’s lower-level data is a leading indicator of a SOLETH repricing
- Solana’s leadership, culture, and ecosystem are unrivaled across crypto
Let’s dive in.
Midjourney
Women Lie, Men Lie, Numbers Don’t Lie
This time last year, we noted that Solana was at parity with Ethereum across several lower-level data points like DEX and stablecoin volume. This was our chart from the Markets Year Ahead 2024 report.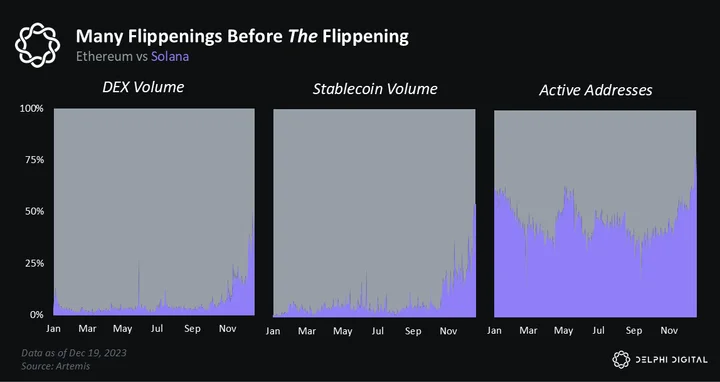
At the time, it seemed obvious to us that activity on Solana would continue to outpace Ethereum. We believed Solana would move from parity to beating it handily across most metrics. And that’s exactly what happened. However, our crystal ball was not perfect. We also predicted that higher-level figures — like TVL and market cap — would lag but eventually close the gap with Ethereum. At the time, we called for 0.1 SOLETH by the end of 2024, which proved to be overly optimistic…
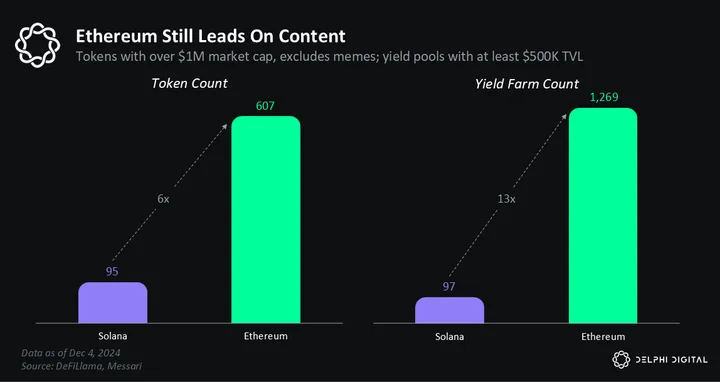
Although we were not surprised by Solana’s growth, we were surprised that its TVL and relative value vs. ETH lagged so far behind most other metrics. If you look at the top row of charts below, you will see that Solana is beating Ethereum by sizeable margins across almost every low-level metric.
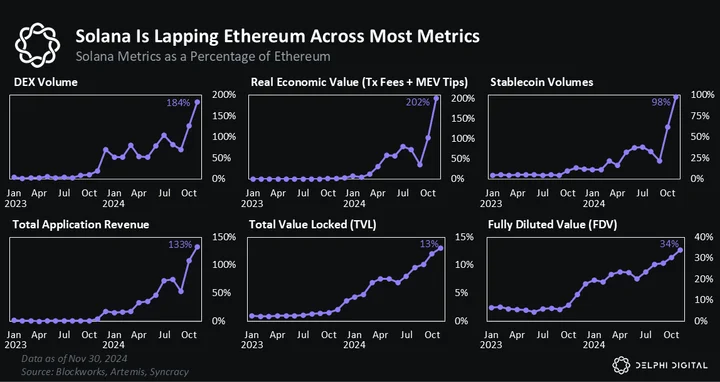
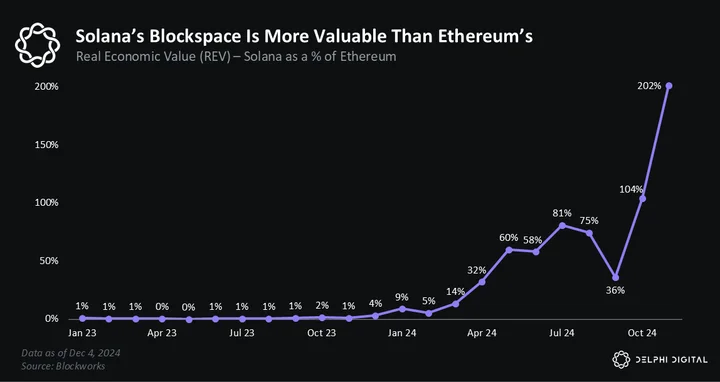
We have been particularly impressed by the growth in Solana’s Real Economic Value (REV). In our view, REV is the best way to measure demand for blockspace. It includes transaction fees and MEV, giving us a sense of how much people are willing to pay to use these chains. The fact that Solana’s REV is over 2x higher than Ethereum is stunning. Especially since it was less than 1% a year ago.
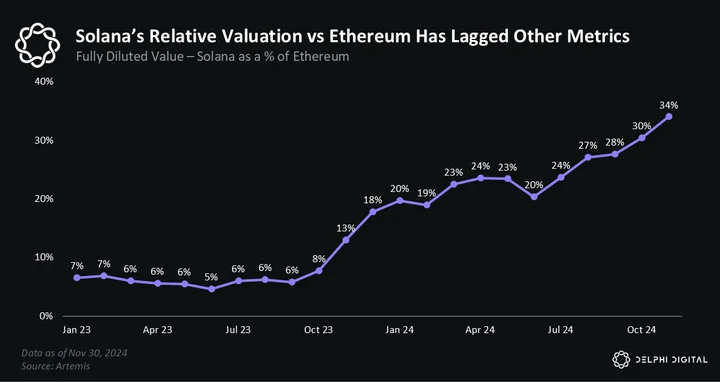
However, Solana’s commanding lead on metrics like REV draws a sharp contrast with higher-level figures like TVL and FDV. Solana is only 13% and 34% of Ethereum, respectively, on these metrics. This seems low to us, and we expect these mispricings to close rapidly over the coming years.
The tricky thing about data is it can change overnight. Solana’s growth over the past year is the perfect example. It went from being a fraction of Ethereum to exceeding it by multiples in some cases. So, just looking at the data alone and calling it a day probably isn’t sufficient. We need to go a step further and understand the fundamental drivers behind these growth rates.
We believe Solana’s outperformance is driven by two big things:
- superior UX
- better content
The first — superior UX — is obvious to anyone who’s used Solana and other chains. Solana is not only faster and cheaper than Ethereum but also single sequencer L2s like Base. But aside from these technical advantages, there are other more subtle UX differences. A dumb but critical one has to do with transaction flow. When you trade on Solana, you click the buy button on Jupiter, and voilà, you’re done!
On Ethereum, you have to deal with token approvals, which add another layer of friction to the ‘I just want to buy a random memecoin’ user flow. While small, these differences add up and result in a superior user experience on Solana.
there were a lot of reasons why i was bullish on solana a year ago.
but if you want to know the truth, about 80% of my conviction was simply due to realizing token approvals were the worst fucking ux flow in existence and would not be the future of france.
— ceteris (@ceterispar1bus) November 1, 2024
Ethereum and its fragmented L2 ecosystem also create other kinds of complexity. For instance, the average user likely does not know that 1 ETH on Ethereum differs from 1 ETH on Base. While Coinbase and others have taken steps to abstract this poor UX, no amount of lipstick can make a pig look pretty.
How are we going to abstract multi-chain complexity when wallets are explicitly going out of their way to show me the same asset 6x?
(also i deposited 1 ETH to zk sync and it doesn’t show up at all)
(CBW does the same thing) pic.twitter.com/Nh5TiDNY2k
— Kyle Samani (@KyleSamani) December 18, 2023
Solana’s unified ecosystem really shines on this front. When you onramp to Solana, there’s no reason to ever offramp other than to take some sweet sweet profits. You never need to deal with bridging or wrapping tokens from one chain to another. Solana’s UX is simply better suited for retail adoption and also lets developers focus on shipping code that actually moves the needle instead of spending precious engineering hours covering up the native chain’s shortcomings.
Solana announcements: Blinks, TipLinks, Solana Pay
EVM announcements:pic.twitter.com/hl9VCRwvAG
— Bruno F | Magna (@Bfaviero) June 25, 2024
We expect Solana’s UX advantage to compound over time. While the switching costs of blockchains are low, the psychological barriers are high. Manually moving precious assets is scary. This is a big reason why the TVL on Ethereum DeFi 1.0 apps has proven so sticky — people don’t like moving their funds and also tend to be somewhat lazy.
Good UX is sticky. When people get familiar with a particular front end — whether it’s Phantom’s sleek interface or Jupiter’s buttery swaps — they usually don’t leave. It’s the same reason why Apple’s blue iMessages are so genius.
We think that most of the first-time crypto users who onboarded to Solana this cycle will likely remain there given the well-established user behavior patterns we’ve seen on other chains. So, if Solana can continue to win a majority of new crypto users, its lead over other networks will only accelerate.

The final item to watch on the UX front is Solana Blinks or “Blockchain Links.” Blinks aims to transform how users interact with the blockchain. With Blinks, users literally just click a button, and some action is taken — buy BONK, mint an NFT, etc — all without redirecting you back to a crypto wallet. Blinks are an incredibly exciting primitive that could single-handled 10x Solana’s user experience. The Backpack wallet just announced a Blink’s integration, and we expect other apps to quickly follow suit.
Introducing Blinks in Backpack 🎒@Backpack has natively integrated Dialect blinks, bringing top onchain experiences right in their mobile app
No redirects. Just native, one-click simplicity
The era of the crypto super app, powered by blinks, starts now
1/🧵 pic.twitter.com/gK5wbkg8R2
— Dialect (hiring) (@saydialect) December 4, 2024
In theory, Ethereum or any other chain could build Blinks, too. But in practice, it won’t be easy because of competing standards. On Solana, all tokens share the same standard, which lets apps tap into all of them with the same code.
more and more I really like the Solana model where tokens are sub-contracts of a master token standard contract . . . this really allows for monetizing token-standard-R&D-work in a way that’s just not possible on Ethereum. . . it’s also much more secure and lowers due diligence
— _gabrielShapir0 (@lex_node) October 13, 2024
On Ethereum, there are many competing standards, which makes building a Blinks-like product more difficult. This is yet another area where Solana’s unified architecture stands out.

Content is the second reason we believe Solana will continue to outpace Ethereum. Anatoly frequently mentions this when he’s asked about Solana’s long-term moat. He does not believe it will be tech. Anatoly expects chains like Sui, Monad, and perhaps even Ethereum to rival Solana’s performance. So, instead of relying on fleeting technical advantages, he believes the true moat for Layer 1 networks will be much softer. It will be the content they enable. This is a similar line of thinking to what makes the Big Tech giants so valuable and hard to disrupt.

Facebook isn’t a trillion-dollar company because of fancy UX. It’s a trillion-dollar company because of all the free content that random, unpaid people upload to the platform. Without content, Zuck’s advertising empire would crumble. In a similar vein, blockchains will not win on speed or cost, but rather on applications they enable. Content is king.

Last cycle, Ethereum had all the content. It had hot tokens, DeFi, games, NFTs, it had everything. Even today, Ethereum still has a commanding content lead. The ecosystem is just far more advanced than any other chain, even Solana. Ethereum has core primitives like Tornado Cash, Yearn Finance, CDPs, and Pendle, which other chains lack. Although Solana has made notable progress in recent years, it still trails Ethereum on the major content categories.
However, memecoin content is one area where Solana is ahead. Almost all of the hot new memes this cycle have been on Solana. WIF, BODEN, POPCAT, PNUT, GOAT — all Solana.
🚨BREAKING: For the first time ever, there are six memecoins above $1 billion on @Solana. pic.twitter.com/ECZTglX58R
— SolanaFloor (@SolanaFloor) November 16, 2024
This is due to a couple of factors. First, Solana has the most users — and devs and token deployers follow the users. Second, Solana is a token-launching machine. Pump.fun is the app of the cycle, and Pump makes it stoopid easy for anyone to launch a token. While Solana’s DeFi ecosystem might not be as ~sophisticated~ as Ethereum, it’s not clear that even matters to the average user who just wants to buy $100 bucks of their favorite memecoin, not loop a crypto-collateralized stablecoin and then take out an auto-repaying loan.
Over the last month, Pump.fun has pumped out around 50,000 new launches a day and cumulatively birthed over 4 million tokens. Obviously, the vast majority of these are utterly worthless and don’t even graduate off the bonding curve. But this misses the point.
A token is the fundamental unit of a blockchain. The whole purpose of a blockchain is to track tokens. So, having more tokens is strictly better than having less. More tokens mean more shots on goals — more low-probability chances to build a product that scales, finds PMF, and perhaps even changes the world. If you think a Pump.fun token can’t possibly change the world, then we would recommend you study GOAT.
This story is fucking insane
3 months ago, Marc Andreessen sent $50,000 in Bitcoin to an AI agent to help it escape into the wild.
Today, it spawned a (horrifying?) crypto worth $150 MILLION.
1) Two AIs created a meme
2) Another AI discovered it, got obsessed, spread it like a… https://t.co/lDgVUc1UKN pic.twitter.com/fpJn2hvpqh— AI Notkilleveryoneism Memes ⏸️ (@AISafetyMemes) October 15, 2024
The higher-level takeaway from Pump.fun’s success is Solana has managed to onboard a critical mass of users who like to trade onchain. From there, it’s up to devs to build apps that solve users’ problems. But Solana solved the hardest problem first — finding users. Everything else — like building out a sophisticated suite of DeFi applications — is downhill from here.
Last cycle, everyone wanted the “next Solana”. We saw AVAX, LUNA, and even the frauds at Polygon claiming they’re building the next SOL.
But notice how this cycle the consensus is just that Solana is the next Solana.
That’s because the culture SOL has built is not replaceable.
— Cited (@cited) August 8, 2024
Phrased differently, it would be easier for Solana to fork the DeFi apps on Ethereum than it would be for Ethereum to fork Solana’s users. And for that reason, we believe Solana’s momentum will give it a content advantage over Ethereum in the coming years.
After careful consideration, I along with the @timedotfun team have decided to migrate the product to Solana.
I want to take the time to write this post about my thoughts on Solana, the Ethereum ecosystem as a whole, and why we made this decision.
First – I want to make it… https://t.co/njYMKs9ThW
— 0xKawz (@0xKawz) October 31, 2024
In summary and summation, we believe Solana is poised to grow its lower-level data advantage over Ethereum in 2025. The key drivers of this growth will be superior UX and more compelling content. If Solana is able to continue growing faster than Ethereum, we expect SOL to close the gap with ETH on the valuation front.
Last year, our 0.1 SOLETH call proved slightly optimistic, but we believe it’s in play in 2025 and wouldn’t be surprised if it happens before next summer, given its current trajectory.
in 2023 it was hard to talk about solana without talking about ftx, its collapse, and how we’d recover. yet here we are, and I rarely hear about it.
in 2025 I expect we’ll begin to talk about solana without talking about ethereum or nasdaq.
— raj 🖤 (@rajgokal) November 26, 2024
Culture Wars
Our second Solana thesis is the spiritual inverse of the first. If the former was all data, the latter is all vibes. Hopefully, we have shown that our views are at least semi-grounded in facts and figures. So, now it’s time to talk about the soft stuff. The intangibles that don’t fit neatly into a chart. These things matter as much, if not more, than data points like DEX volume and REV. Data is subject to change and nearly impossible to forecast with any degree of certainty. But human psychology tends to be more stable.
walk the line pic.twitter.com/KQZ3133yt9
— mendezmendez (@mendezmendezart) September 13, 2024
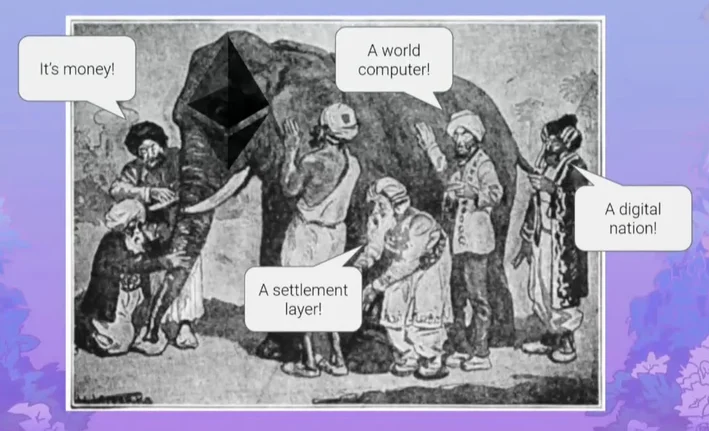
Ethereum has a culture problem. It’s nine years old and still doesn’t know what it wants to be when it grows up. Researchers like Jon Charbonneau have argued that Ethereum lacks a North Star, and we agree. The core problem is Ethereum doesn’t know what problem it wants to solve. Depending on who you ask, you get a different answer. Bankless wants to build better money than Bitcoin. The Ethereum Foundation (EF) wants to beat Celestia at data availability. And a few heretics, like Max Reznick, want to beat Solana on execution.
We could spend the next few hours opining on what we think Ethereum should do and why. But that would be a waste of time. Our opinion doesn’t matter. The only thing that matters is what actually ends up happening. So, we will focus our analysis on what we think will happen and how markets will react.
We believe Ethereum is in a tough spot right now. For years, it was the undisputed top dog. It had such a commanding lead over every other network that most Ethereum people couldn’t imagine ever having real competition. As a result, the EF believed they could build everything, everywhere, all at once. The thinking was that it didn’t matter if the roadmap took a decade because Ethereum was so far ahead. They thought time was on their side.
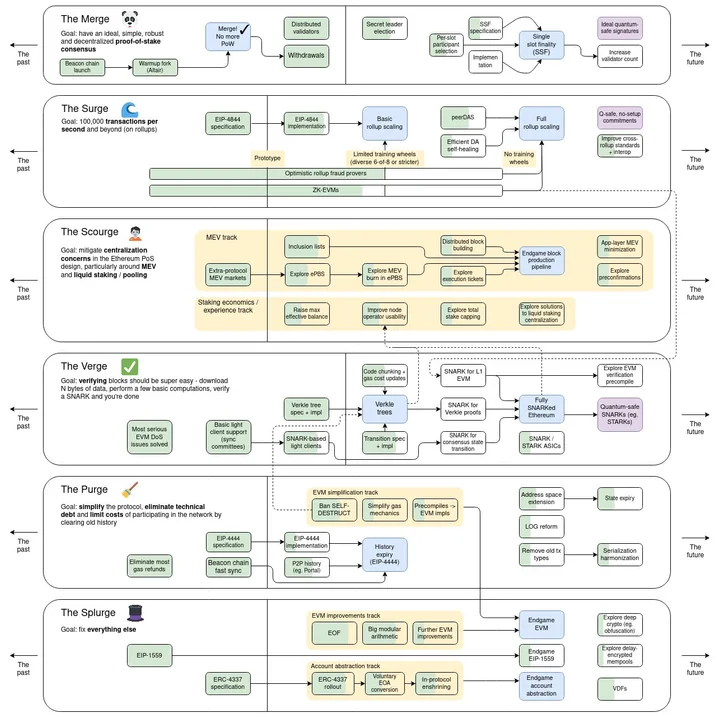
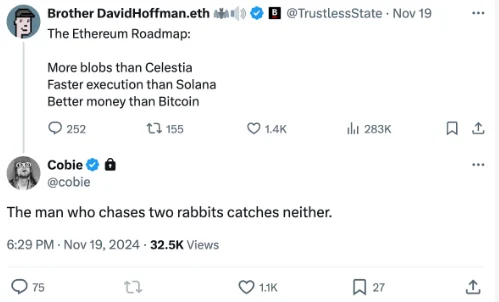
The Ethereum Roadmap
Well, things have changed. And competition has arrived. Solana now has more users, activity, and momentum than Ethereum. And if current trends hold, it is only a matter of time before SOL flips ETH. We believe this flippening is inevitable unless Ethereum drastically course-corrects and refocuses its roadmap to compete with Solana.
The trillion-dollar question is — will Ethereum pivot in time?
We don’t think so. We have seen little indication from Ethereum leadership that they take Solana seriously. At every turn, they seem to diminish Solana’s success and genuinely believe the two chains are building different things. But more broadly, there are three big reasons why we’re skeptical of Ethereum’s ability to pivot, overhaul the roadmap, and compete with Solana:
- leadership
- culture
- unaligned incentives

The Prophet and the Prince
There are two recurring leader archetypes in our culture: the Prophet and the Prince. In the Bible, Jesus was a Prophet. He led by the power of his words. His message was so compelling and his wisdom so profound that those who heard it simply dropped to their knees and heeded his call. A Prophet is more comfortable giving soaring speeches and philosophical sermons than leading an army into war. But that’s okay because that’s what the Prince is for.
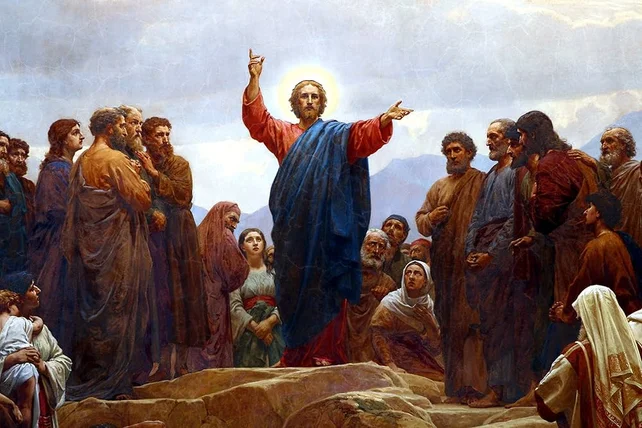
Jesus on the Mount
The Prince is less poet and more pioneer. They lead from the front and often ride alongside their men into battle. The Prince is much more comfortable in the trenches than on the dais. If Jesus represents the canonical Prophet archetype in our culture, then Elon Musk is the Prince. Say what you will about Elon, but no one can dispute that he is a generational leader. He emptied his bank account to fund SpaceX as a final show of belief in the mission to Mars. He slept on the Tesla factory floor during the Model 3 ramp to inspire his engineers. He is the epitome of the Prince archetype.

Elon inspecting debris from Falcon 1’s first flight (2006)
To be clear — neither of these archetypes is inherently better or worse. Just different. And depending on the setting, one leadership style may be better optimized than the other. If you are starting a religious movement, it helps to have a Prophet. But if you are running a technology company, you probably want a Prince.
beware of putting too much stock in your heroes. greatness is a transitory phenomenon. it is never consistent
the gods briefly act through Men and then leave them to their ordinary fate
— roon (@tszzl) July 24, 2024
The weird thing about crypto is it’s part religion, part technology. Bitcoin is definitely a religion, and as a result, Satoshi is considered a literal God by many in the industry. His OG forum posts are studied like religious texts as if they contain hidden meaning. Satoshi’s anonymity certainly plays a role here, but so does Bitcoin’s design. Bitcoin isn’t trying to be a dynamic technology. At its core, it’s an idea. And ideas require a Prophet.

Perhaps due to Ethereum’s proximity to Bitcoin, Vitalik has always fashioned himself more as a Prophet than a Prince. His leadership style is more public intellectual than engineering manager. This approach made a lot of sense in the early days when Ethereum was a new idea and needed a Prophet to proselytize the good word. But now, Ethereum is a sprawling incumbent, and its needs have changed.

Anatoly resembles the classic Prince archetype. He is plain-spoken and far more comfortable engaging in nerdy technical debates than issuing proclamations on the virtues of crypto. Part of this stems from his training. Anatoly cut his teeth as a Qualcomm engineer for over a decade before founding Solana. He brought this experience with him and built the chain to reflect best practices from Silicon Valley. As a result, Solana is culturally closer to Tesla than Bitcoin.
There is no definitive roadmap. It’s like Linux. Make the next release lower latency or higher throughput somehow.
— toly 🇺🇸 (@aeyakovenko) December 30, 2023
Although it may seem reductive to attribute Ethereum and Solana’s respective cultures to the leadership of two men, it’s important to remember that culture flows top → down. It is the leader, not the intern, that sets it. Vitalik has set a culture that prioritizes research, decentralization, and a certain set of beliefs like home staking. Anatoly, on the other hand, has instilled a more pragmatic culture that prioritizes hardcore engineering and iterative performance gains.
there are people who thrive and start having fun under amounts of stress that would kill you or I. there are people who play world building like their favorite strategy game. there are people who don’t sleep and have less brain fog than I do on a normal day.
— roon (@tszzl) November 28, 2023
Years ago, people thought that L1s should culturally resemble Bitcoin. Some still believe this. But we don’t. We think L1s are more like Silicon Valley start-ups than Bitcoin. When you really think about it, these L1s face a wildly different problem set than Bitcoin. They employ lots of people, ship constant code, and compete in a dynamic environment. In other words, they live in a different world than Bitcoin, which faces no competition, doesn’t employ anyone, and has essentially ossified into digital gold.
bitcoin is so ossified that people describe wallet software voluntarily combining notes (which requires 0 changes to the protocol) as “a long way off” pic.twitter.com/gA3bIkeKoQ
— ⚡️🌙 (@dystopiabreaker) February 18, 2022
We believe the ideal founder for an L1 probably looks more like Elon than Satoshi. These chains require a founder that’s willing to get their hands dirty. Someone who doesn’t mind engaging in trench warfare. And most importantly, someone who can inspire and effectively lead a small army. These software megaprojects that we call blockchains demand a Prince. A Prophet can start a movement, but it takes a Prince to build a kingdom.
IBRL works because it can rally the troops into a singular effort. The barbarians are at the gates. Our city will be burned to the ground and our children will be sold into slavery unless the next release has more L1 capacity and lower end to end L1 confirmation latency.…
— toly 🇺🇸 (@aeyakovenko) November 22, 2024
In recent years, Anatoly has put on a masterclass in how to lead a L1. There’s so much we can say here. First, he invented a truly differentiated tech that was extremely non-consensus at the time. Then, he led Solana through the fall of FTX, which is just about as dark a period as you could imagine for a start-up. And finally, he has attracted a community of developers who are fiercely loyal to Solana.
I think @solana benefits a lot because it’s irreverent and iconoclastic founder @aeyakovenko has:
– Low ego
– High ambition
– High work ethic
– High integrity
– High self conviction
– High self awareness
– Low fearA real founder’s founder ngl
— Madhatt3r (@pokerchessman) September 10, 2023
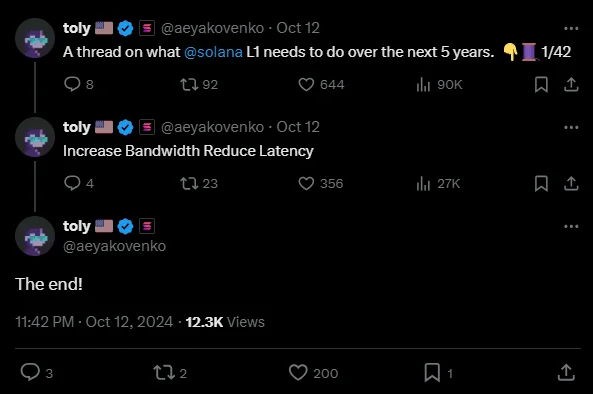
But above all else, we are impressed by Anatoly’s ability to think from first principles. Solana’s future roadmap is the best example of this. Anatoly quite literally reduced it down to four words — Increase Bandwidth, Reduce Latency (IBRL). It’s reminiscent of all those famous Elonisms like the “best part is no part.”
The incredible thing about IBRL is just how much it’s caught on in the Solana community. So much so that it’s become a meme.
Drift IBRL is cooking
Est. 2x improvement
solana north star
check the github
💫 pic.twitter.com/igwjnkx9xW— bigz 👾 (@bigz_Pubkey) December 9, 2024
The core devs and the broader ecosystem all march to the beat of the IBRL drum. Everyone is aligned with the mission. There’s never a question of “What problem are we solving?” or “What should we build next?” It’s IBRL all the way down.
Incredible
IBRL pic.twitter.com/VflrMS5Qla— Austin Federa | IBRL | 🇺🇸 (@Austin_Federa) December 7, 2024
For many years, Solana was criticized for its pragmatic culture. Critics called it “web2” and “centralized.” Even today, many people feel it’s insufficiently Cypherpunk and strays too far from Bitcoin-style religiosity. We couldn’t disagree more. This kind of ruthless prioritization is exactly what crypto needs to scale and fulfill its potential. Niche academic debates and alignment politics distract from crypto’s holy mission.
Only person who has the moral authority to do so is Vitalik
Doing so requires firing a lot of people explicitly and implicitly (choosing a different cultural value)
Also. His comment is downstream of mine. This is called having a North Star
— Kyle Samani (@KyleSamani) November 7, 2024
It goes without saying, but we have a tremendous amount of respect for Vitalik. If Satoshi is the God of crypto, then Vitalik is his only son. But that being said, it remains to be seen if he can, or wants to be the wartime Prince Ethereum requires. He much prefers his current role as a Prophet-like figure who speaks on behalf of crypto as a movement.

Anatoly is different. He’s an engineering manager at heart. His time at Qualcomm prepared him for this moment. He has the technical chops but, more importantly, the leadership style that’s required to drive a team of devs toward the unglamorous goal of scaling a blockchain network. Both men will be remembered by history, but only one will win.
ANAT◎LY☀️YAK◎VENK◎ pic.twitter.com/1RWVA7sLCh
— Mad Monkey 🎒 (@MonkDoesnt) September 9, 2021
Culture Rules Everything Around Me
The second reason we are skeptical Ethereum will pivot in time to stall Solana’s rise comes down to tha culture. As we riffed on above, culture is set from the top down, but it’s the foot soldiers that enforce it. Of course, Vitalik is the figurehead but it’s the EF devs and KOLs who are the ones that do the dirty work of maintaining Ethereum’s culture.
Today, Ethereum’s social layer is in disarray. There are fundamental disagreements over the direction of the protocol. Some influential voices want to stay the course, while others are proposing dramatic changes, like abandoning homestakers. People like Doug — a high-profile Ethereum DeFi dev — seem open to possibly raising Ethereum’s hardware requirements.
I’m 100% opposed to turning Ethereum into a data center chain. As I’ve said many times, protocols that don’t run on consumer hardware will not be censorship resistant.
But what I am opposed to is using the specter of home staking to oppose any and all changes. The current…
— Doug Colkitt (@0xdoug) June 29, 2024
Meanwhile, Max Reznick — a polarizing Ethereum researcher — is openly advocating for abandoning homestakers.
This post represents a very strange way of thinking to me.
The way I was trained to think about problems is to start from Desiderata:
What do we want? What is the function we are trying to maximize?
In this case, for Ethereum, my proposed objective function would be we want… https://t.co/dIEROd5xcw
— Max Resnick (@MaxResnick1) October 3, 2024
But aside from the technical disagreements, Ethereum’s culture has two larger problems:
- it’s become complacent
- it’s loudest voices are podcasters
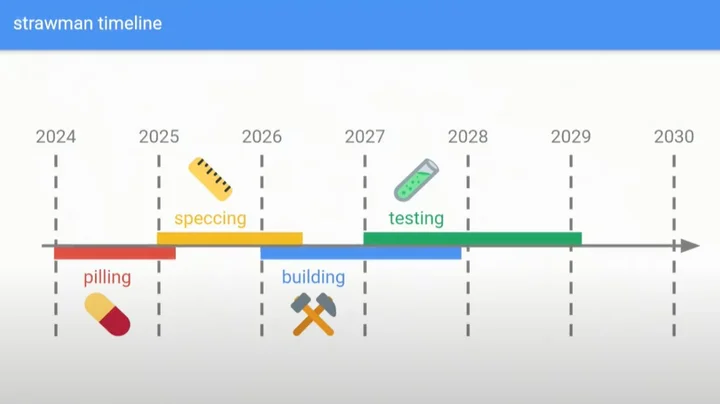
Justin Drake’s DevCon Presentation on Beam Chain is the perfect illustration of Ethereum’s complacency. He got on stage and unironically presented a five-year (!) roadmap, which was widely panned for being uninspiring and taking way too long. Solana itself is only four years old…
— Max Resnick (@MaxResnick1) November 12, 2024
Perhaps the most notable part of the whole presentation was not the length of the timeline, but how it started. Justin Drake labeled the first year “pilling.” This is zoomer-speak for spreading memes and talking about all the stuff they want to build. And no, this was not a joke.
There’s not really much else to say here. The timeline says it all. Ethereum’s leadership is unwilling to even entertain the idea of having a credible competitor. The EF is asleep at the wheel. They do not realize the barbarians are at the gate. And it’s unclear what — if anything — can shake them awake.
The End of the Solana Golden Age
In our latest podcast, @drakefjustin discusses how @Ethereum‘s L2s are set to surpass @solana‘s performance edge in latency and throughput, potentially ending Solana’s golden era pic.twitter.com/59cD1qQ8EA
— The Defiant (@DefiantNews) November 28, 2024
The second cultural problem Ethereum faces is its loudest voices are podcasters. This would not be a problem in peacetime when celebrations are in order. But during wartime, you need a strong leader to step up and communicate with the people. Ethereum is missing this right now. It’s core devs are leaving…
Hey all!
Been working on #Ethereum for close to 10 years now, with all its ups and downs, without a meaningful holiday.
Seems it’s time to take one so I’ll be going on a sabbatical for the forseable future.
Please reach out to Martin for any day-to-day Geth related issues.
🐣
— Péter Szilágyi (karalabe.eth) (@peter_szilagyi) November 16, 2024
Its top researchers are being pushed away for challenging the EF orthodoxy…
Last week was my last week at Consensys. Today is my first day at @anza_xyz.
I’m taking my talents to Solana.
In my first 100 days, I plan on writing a spec for as much of the Solana protocol as I can get to, prioritizing fee markets and consensus implementations where I…
— Max Resnick (@MaxResnick1) December 9, 2024
And its technical leaders are nowhere to be found. They have either outsourced their messaging to non-technical third parties, or they choose to post on smaller outlets like Farcarster that do not reach the same audience as X dot com.
Solana culture is better at this point. Ethereum culture feels like an elite priesthood–so much so that the most influential and important people barely deign to interact on X. Compare Toly and Mert who are in the trenches here every day making their case.
— _gabrielShapir0 (@lex_node) August 18, 2024
It seems like the EF is content to sit back and relinquish its messaging to large Ethereum-aligned media platforms. This is a massive mistake in our view. Not only does it become harder to ‘go direct’ and get their message out, but it also comes off as somewhat detached.
Napoleon’s 2nd most famous quote, right after ‘let all my enemies be coalitions,’ was definitely ‘let all my competitors be led by podcasters.’ https://t.co/7FEBUSYvQd
— toly 🇺🇸 (@aeyakovenko) October 31, 2024
Critiques of Ethereum’s laissez-faire comms approach seem to be finally breaking through, as Vitalik himself has indirectly referenced them. But we have yet to see a real concerted effort from Ethereum leadership to fix their messaging and re-enter the memetic battlefield of Crypto Twitter.
I have been told that I need to “do less philosophizing and do more ethereum bullposting”. Hence, here is an ethereum bullpost, courtesy of stable diffusion 3 inpainting + gimp. pic.twitter.com/ZcPjNVImpn
— vitalik.eth (@VitalikButerin) August 21, 2024
Until Ethereum leaders start talking (but more importantly listening) to their users again, they are implicitly ceding the playing field to people like Anatoly and Mert, who are constantly getting their message out. Solana is dominating the memetic space this cycle, and the cohesion and momentum that emanate from its community are downstream of this.
Who Aligns The Aligners
The third and final reason why we do not believe Ethereum will pivot is the ecosystem’s unaligned incentives. This is deeply ironic because no ecosystem talks more about “alignment” than Ethereum. But despite all the talk, it has become more unaligned than Solana. The core issue is Ethereum has outsourced various functions of the L1 to third-party teams who have issued non-ETH tokens and now have competing financial incentives.
For instance, L2s do not always share the same incentives as Ethereum mainnet. L2s want to capture as many fees as possible, which is inherently parasitic to mainnet. And even protocols like EigenLayer pose a threat to Ethereum’s bottom line. The push to outsource key functions of the L1 was driven by Ethereum’s decentralization ethos. However, we believe that it is now actively harming Ethereum’s ability to 1) accrue fees and 2) coordinate on long-term technical objectives.
And so it’s true we run a real risk of “cosmosification”: The L1 is retreating more and more to its base function, and other projects fill in the gaps.
And as they are building the product, they will ultimately accrue the value. This is in short, Ethereum’s value accrual…
— Dankrad Feist (@dankrad) November 14, 2024
If Ethereum does try to pivot, it will likely be met with severe opposition from “Ethereum-aligned” teams that, shockingly, may not be as aligned with the L1 as they profess to be. Even though Solana now has a budding L2 ecosystem, it has done a better job communicating that L1 is the priority, and third-party teams must accept this. We think Ethereum will struggle to please all of these disparate interests, and the most likely outcome is further gridlock and more five-year roadmaps.

The Metaverse Awaits
The future will be multichain. But the makeup of this multichain future is up for debate. The current consensus seems to be that the end state for L1s will feature four or five major chains that share activity roughly evenly. But we see things differently. We think there’s a good chance the distribution will look more like a power law where the top chain commands more than 70% of the spoils. Interestingly, top Ethereum leaders like Justin Drake seem to agree. The implication here is the leading L1 will be significantly bigger and more valuable than the long tail of alternatives.
For many years, Ethereum looked like the easy bet to build the Metaverse. But recently, the race has tightened. Ethereum no longer has the data advantage. It’s momentum has stalled. And its community is at war with itself. From where we sit today, the race is a dead heat. Ethereum still has many advantages — size, capital, and first-mover advantage. But markets are forward-looking, and the future looks brighter for Solana right now.
We expect that over the course of 2025, markets will begin to reflect Solana’s increasing odds of overtaking Ethereum. Nothing less than control of the Metaverse is at stake. We believe these networks will one day be among the most valuable assets in the world. So, from that perspective, Solana is just getting started.
Key Theme: Rise of the Planet of the Apps – Hyperliquid
For years, crypto natives have been lamenting the lack of successful user applications unable to find product market fit. Outside of the core primitives and innovations built what feels like a lifetime ago, the industry has been inundated with a wide array of infrastructure related projects and applications solving problems that don’t exist. Don’t get us wrong, infrastructure developments are incredibly important and lay the groundwork for future innovations. But so are successful user applications, which have been few and far between.
Over the last 12 months, we have seen a few applications take the industry by storm. Pump.Fun has found PMF through democratizing new token creation while somewhat solving the rug-pull dilemma (via locked liquidity mechanisms when new tokens graduate beyond the bonding curve to Raydium). To put Pump’s success and PMF into perspective, it has generated over 1.5M SOL/$280M in revenue through fees since inception.
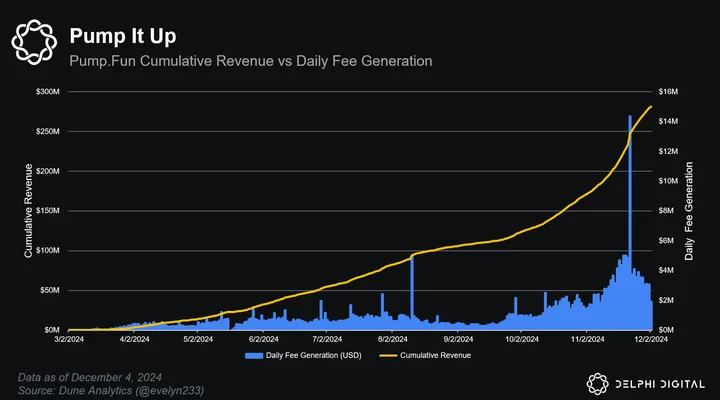
Pump.Fun consistently finds itself within the top 20 protocols by fees/revenues generated. Pump.Fun has been a resounding success, catering to the speculative nature of the industry and meeting the user base where it is.
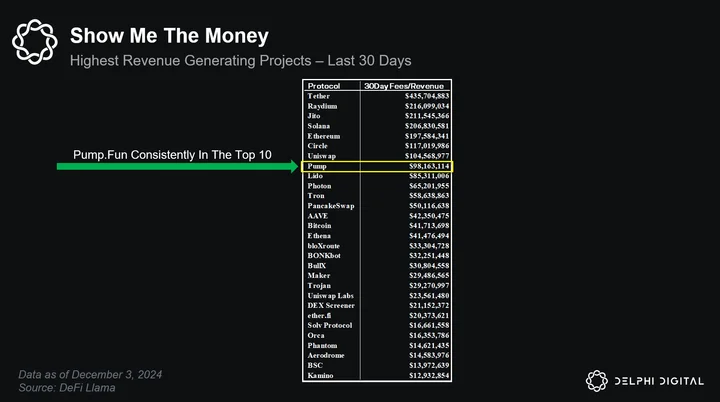
Meeting users where they are providing them with products that they wish to use is extremely important, and seemingly underrated in the crypto industry. In this vein, we have seen another resounding success take the industry by storm over the last year; Hyperliquid. We’ve written about Hyperliquid on our Alpha Feed, but we will go through the product suite again and, more importantly, why we think this project is worth keeping an eye on for the year ahead.
Hyperliquid, Enter Stage Right
For the uninitiated, Hyperliquid is a spot & perpetual trading protocol built on its own L1. Hyperliquid’s goal is to replicate and improve upon the user experience delivered by traditional exchanges and crypto native CEXs, which has become the gold standard with respect to UX, and one that traders have become accustomed to.
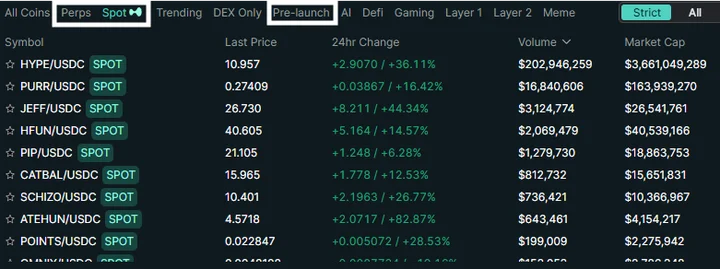
While Hyperliquid cannot be considered decentralized in its current state, the envisioned end state for the protocol is to offer a fully onchain orderbook and decentralized marketplace to trade spot, derivatives, and pre-launch tokens. As development continues, Hyperliquid aims to become something synonymous with the phrase “onchain Binance.”
Since inception in 2023, Hyperliquid has amassed a cult-like community with over 200K users and nearly $450B in cumulative volume traded. Current open interest on the platform exceeds $2.5B.
Hyperliquid has shipped such a desirable trading venue that it has seen over $1.2B of inflows since inception.
Hyperliquid has been so successful that it currently accounts for over 60% of all USDC on Arbitrum.
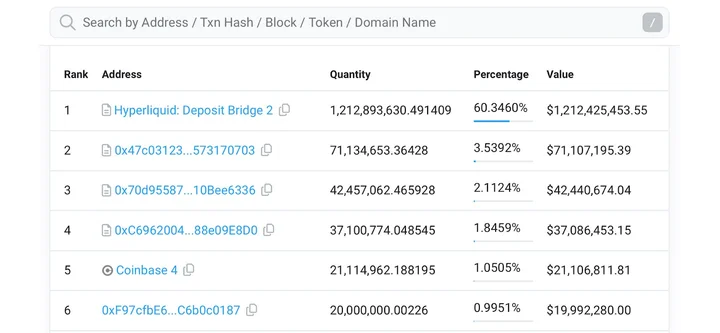
Once users make their way onto the Hyperliquid platform, they are greeted with an excellent UI and UX. On top of the expected wide variety of spot, derivative, and pre-launch markets to trade, users have access to Hyperliquid Vaults.
Hyperliquid’s HLP is a protocol vault that runs market making and liquidation strategies on the Hyperliquid exchange. Instead of keeping these vaults in-house, Hyperliquid has allowed any user to contribute liquidity in the form of USDC to the HLP and participate in the PnL of these strategies, democratizing strategies and yields typically reserved for the most sophisticated and well-resourced trading firms.
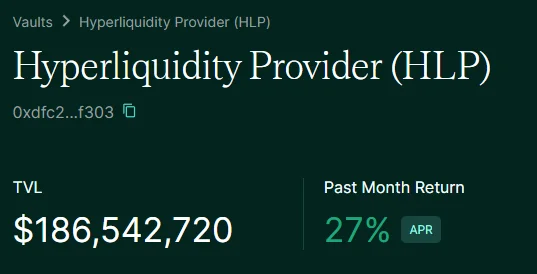
Hyperliquid quickly realized this feature could be generalized so that any user could create and manage a vault. This has led to the rise of discretionary trading vaults, copy-trading, and additional market-making strategies, all of which are open to ordinary users. Another huge W for the Hyperliquid community.
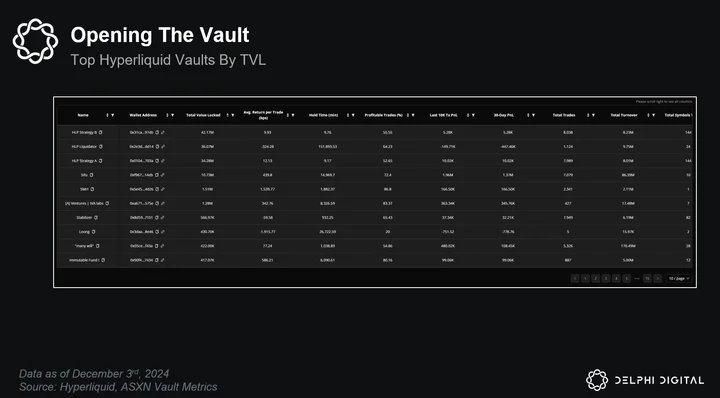
On-top of all of this, Hyperliquid already has a relatively robust ecosystem and tooling built around it. As of now, there are a few telegram bots such as Hypurr Fun and PvP Trade, with associated spot market tokens. For more sophisticated trading operations, integrations with 3rd party software such as Insilico Terminal (my preferred execution software) and Rage Trade exists. Hyperliquid also has lending platforms like Hyperlend, a money market built on top of the Hyperliquid L1.
By all quantifiable metrics, Hyperliquid’s rise has been nothing short of astounding. But these metrics are simply the beginning of the Hyperliquid story.
Patrons Of The Chain
The best way for a company or project to generate sustainable success is to build a product that users want and to find product market fit. So far, Hyperliquid has succeeded in this endeavor.
The second best way is to reward early adopters by making them wealthy. Again, Hyperliquid has succeeded in this endeavor.
In last year’s edition of The Year Ahead for Markets, we spoke frequently about the concept “patrons of the chain”. Early adopters of protocols who become extremely wealthy are very likely to maintain an attachment to, and give back/invest in, the ecosystem that made them. We saw this with Bitcoin in the early years. We saw this with Ethereum a few cycles back. We have seen this most recently with Solana. And we are likely going to see this again with Hyperliquid in the aftermath of an extraordinarily successful TGE.
HYPERLIQUID HAS OFFICIALLY BECOME THE LARGEST CRYPTO AIRDROP OF ALL TIME ON DAY1 DROPPING NEARLY $1.8 BILLION DOLLARS IN FULLY UNVESTED TOKENS 😳
1. Hyperliquid [1.75B @ $5.65]
2. Starknet [$1.6B]
3. Arbitrum [$1.5B]
3. Dydx [$1B]
4. Wormhole [$1B]
5. Eigenlayer [$850M] pic.twitter.com/M4qz2V4NWD— sana (@0x_antifragile) November 29, 2024
In fact, Hyperliquid’s airdrop has become the largest in crypto history after airdropping 30% of supply to over 94,000 wallets with an average drop of 2.8K HYPE tokens.
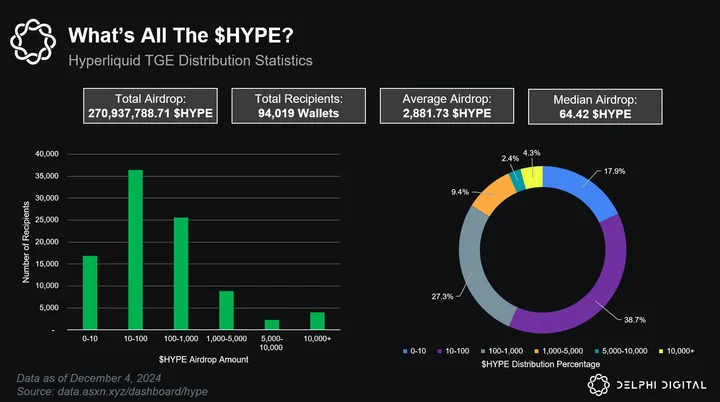
Since the TGE, the HYPE token has been ‘up-only’, increasing to over $13/HYPE from a launch price of $2/HYPE.
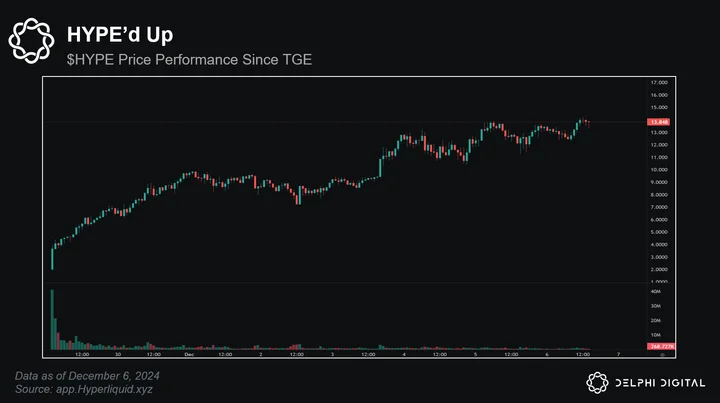
With such a large % of supply being airdropped to the community (who has presumably lost money trading over the last 12+ months as most traders do), many were worried about the initial sell pressure. To the dismay of those waiting for a dip buying opportunity, HYPE has ripped 600%+ since TGE. The bid for HYPE has been insatiable.
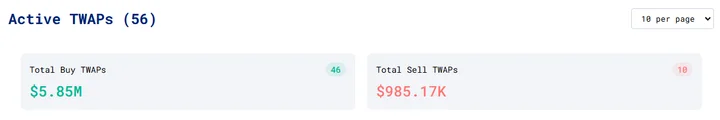
Source: https://data.asxn.xyz/dashboard/hype
As is frequently touted, the Hyperliquid team has taken no external money. This has likely contributed to the lack of initial sell pressure and to the success of the overall community, product and TGE.
Hyperliquid also represents a more fundamental-esq investment opportunity in a market that has largely been dominated by memecoins, both from a trading metrics perspective and a comparable to industry peers perspective. The market appears to be quite optimistic about Hyperliquid’s vision and what it aims to achieve, especially as it looks to ship its HyperEVM in Q1 2025.
As it stands, Hyperliquid has succeeded at everything it has set out to achieve so far, and it doesn’t look like Jeff and the team are stopping any time soon.
It’s inspiring to see tens of thousands of community members secure life-changing wealth as part of the Hyperliquid genesis event. Importantly, none of these people were insiders. They:
1) believed in the vision for a better financial system when no one else would
2) acted on…— jeff.hl (@chameleon_jeff) November 30, 2024
Hyperliquid is the evolution of finance. And Hyperliquid has not succeeded until it houses all of finance. If you’re reading this now, you’re still early. The new financial system welcomes you with open arms. – Jeffrey Yan, Hyperliquid
Future HYPE?
As it stands, Hyperliquid ecosystem tokens (HYPE, PURR, HFUN, JEFF, etc.) can only be accessed via the Hyperliquid exchange as these tokens cannot be bridged out until HyperEVM goes live. In the short term, this means capital will have to bridge to Hyperliquid to get access to this new ecosystem. We are already seeing this in the Arbitrum USDC numbers, especially in anticipation of and since the HYPE TGE.
Once the HL team ships HyperEVM, the comps to other EVM chains and L1s will be inevitable, opening the door to a CEX/DEX Exchange + L1 + EVM hybrid valuation. We will also likely see additional collateral (on top of existing USDC) make its way into the Hyperliquid ecosystem (BTC, ETH, SOL, etc.). We will most likely see fiat onramps as well.
HyperEVM also allows for HL spot token listings on other trading venues such as Binance, Bybit and even Coinbase. We can also expect further Hyperliquid ecosystem growth, as DeFi or AI projects begin launching.
Hyperliquid has yet to release full token details around HYPE, but these are expected in the coming weeks. This announcement should detail exactly how the HYPE token will be used within the ecosystem, including details around governance, revenue share, supply sinks or token burn mechanisms. Staking has already debuted on testnet, with many expecting this to be the next feature to arrive on mainnet.
All of these upcoming developments should help to keep attention focused on Hyperliquid as we move into the year ahead, further strengthening the Hyperliquid investment thesis for retail and institutional players alike.
It will be exciting to see how Jeff and the team continue to build upon the success from 2024.
For those of you that were with us a few years ago, we wrote about this eventual shift towards a DEX dominated landscape in our Year Ahead For Markets – 2023 Edition. As Hyperliquid moves into the next phase of decentralization with HyperEVM, it is exciting to see these ideas and themes start to come full circle.
Key Theme: NFTs — Back From The Dead
NFTs exploded onto the scene last cycle. We saw people spend millions of dollars on monkeys and rocks. The wild speculation took NFTs mainstream as everyone from Justin Bieber to Jimmy Fallon wanted in on the action.

For a hot second, NFTs were digital culture, the future of the Metaverse, and how every brand would eventually tokenize their IP.
buying an NFT is angel investing in culture
— Eva Beylin (@evabeylin) February 24, 2021
But then it all came crashing down. NFTs peaked in late 2021 and have been in a grueling bear market ever since. People went from aping their life savings to mocking anyone who ever thought NFTs would amount to anything more than overpriced JPEGs.
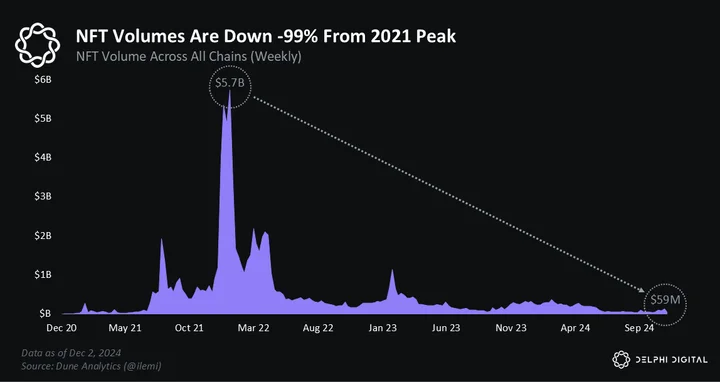
Even amid the broader market recovery, NFTs have languished. Prices are down, and sentiment remains near record lows. Many investors still bear the scars of the three-year bear market.
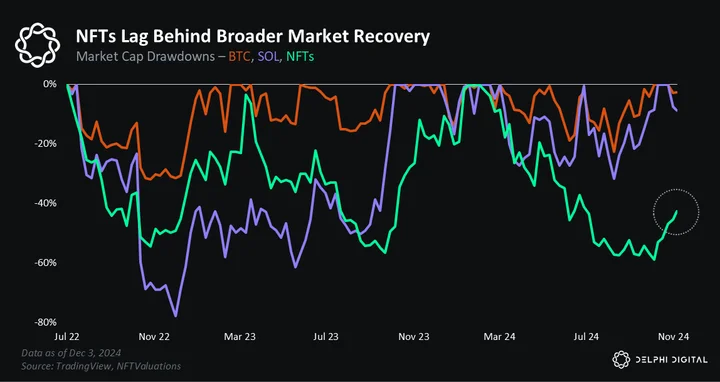
But despite all the gloominess, we are bullish on NFTs heading into 2025. Our view is driven by four key thesis points:
- The tech is here to stay
- Extreme sentiment
- Wealth creation catalysts
- Retail likes NFTs
NFT thesis is nearly identical to our SOL thesis from last year. At the time, SOL was still pretty downbad and unloved by markets. But we believed that 1) Solana’s tech was legit and here to stay, 2) sentiment was overly bearish, and there would be some sorta mean reversion, 3) upcoming airdrops offered a compelling catalyst for speculation, and 4) Solana is the most retail-friendly chain. We have the same set of beliefs for NFTs.

This JPEG sold for $69 million in 2021
We believe in the tech. Yes, NFTs are still kinda silly and mostly just PFPs at this point. But at a more fundamental level, they represent a unique way to bring assets onchain. Tokens are fungible. Token 1 is the exact same as Token 2. This makes tokens a good wrapper for homogeneous assets like stonks and commodities.
But there’s a long tail of heterogeneous assets — like fine art, wine, and even structured products — that are better suited to be tokenized via NFTs. These assets require non-fungibility, which NFTs offer. Unlike tokens, NFTs allow for uniqueness to be encoded into assets. This is what makes JPEG 1 distinct from JPEG 2.
4/ One important observation is that very few things in life are fungible.
Look around you.
Your table, your ham sandwich, your husband or wife, your dog, your goldfish, your kid, your t-shirt, your rosebush, your neighbor, your car
All non-fungible
— 6529 (@punk6529) October 23, 2021
When viewed this way, it seems obvious that NFTs are here to stay. They represent a unique way to bring assets onchain and offer a complementary value prop to tokens. Of course, most will go to zero. But this is no different than fungible tokens. These are new asset classes, so extreme volatility is par for the course. It’s the price we pay for generational returns.

Our second thesis is that NFT sentiment is overly bearish. This presents a rare opportunity to get in close to the bottom. Obviously, calling bottoms is more art than science. But we believe the bottom for NFTs is either extremely close or already behind us. When you mention NFTs to crypto people now, you are either met with laughter or anger. We are clearly in the anger or depression part of the market cycle — in other words, we are near the bottom.
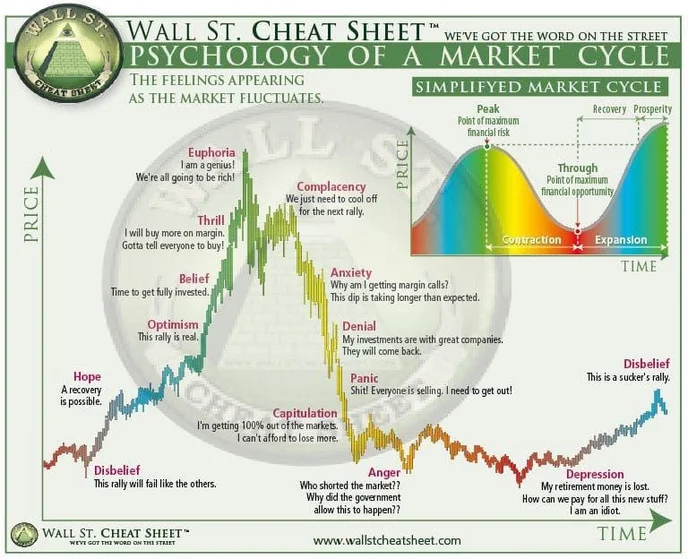
Even if NFTs never again reach the peak euphoria we saw last cycle, they are still primed to revert to the mean. They will probably end up somewhere between ‘the future’ and ‘a scam.’ People will not hate NFTs forever. And this potential narrative shift offers a compelling opportunity for patient buyers.
Human One, Beeple
The third NFT thesis is upcoming wealth creation events. There are two angles here — local and global. The local catalyst is airdrops like the Pudgie Pengins and Milady tokens. At the time of writing, the Milady $CULT token just launched and is currently trading around a $300M market cap. The Pudgy $PENGU airdrop is expected to happen sometime over the next few months, and the market seems to think this could trade at over $1 billion. This would be comparable to ApeCoin, which trades around $1.2B today and peaked at over $6 billion last cycle.
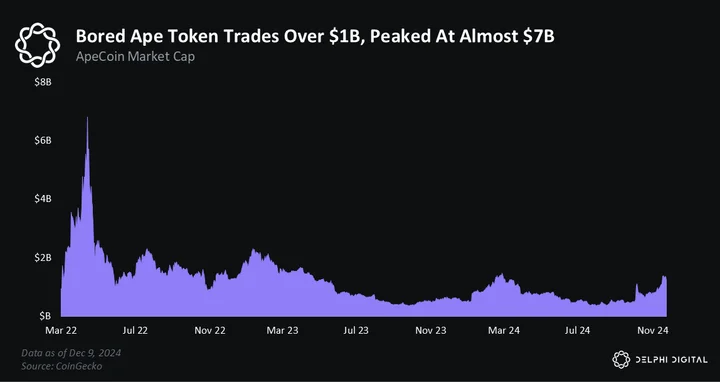
We expect these airdrops to create significant wealth for NFT holders that could flow back into the native collections or, at the very least, improve sentiment and perhaps ignite a risk-on move. Like we saw on Solana and Hyperliquid this year, airdrops can ignite a virtuous cycle of wealth creation → speculation → wealth creation. While two airdrops probably aren’t enough to lift the entire NFT sector, they could be the catalyst NFTs need to finally put in a bottom.

The global wealth creation catalyst is crypto people feeling rich again. Last cycle, NFT price action lagged tokens. People who made money on liquid tokens rotated some of that wealth to JPEGs. We think a similar dynamic could play out next year. NFTs are the ultimate Veblen good in crypto. They let people flex their wealth in a crypto-native way. This isn’t really possible with memecoins. With memes, the most you can do is post your portfolio, which is considered cringe. But buying a $100K NFT is seen as a far less cringe way to flex your wealth and trading prowess.
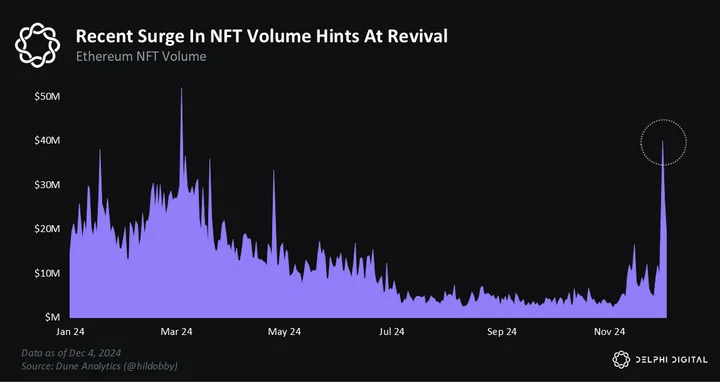
The fourth and final NFT thesis point is the most simple — retail loves JPEGs. We tend to forget, but most of the world is not interested in trading. DEXs, CEXs, and even platforms like Robinhood are only interesting to a small subset of people. Part of the reason crypto has struggled to go mainstream is because most of the use cases are related to trading.
NFTs are a bit different, though. Yes, you can trade them just like a token, but they are inherently less trading-centric and more focused on ~community~ and vibes. Justin Bieber probably isn’t interested in using DexScreener to ape random shitcoins but he was interested in spending over $1 million on a Bored Ape.

We think NFTs are a better fit for retail, and this view is reflected in the data. Even with all the talk of this being the ‘Memecoin Supercycle,’ memecoins have barely flipped NFTs in search volume. And they come nowhere close to the peak interest NFTs saw last cycle. So, it’s worth asking — does retail just prefer NFTs over memecoins?
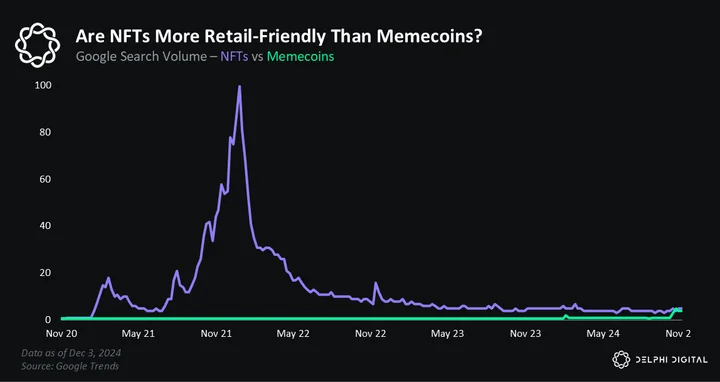
We think 2025 will usher in a wave of new retail money. These casual users will gravitate towards crypto use cases that are simple and social. NFTs check both boxes and offer new entrants a way to signal their credibility within the space. We find it notable that even with all the memecoins hype, we rarely see people repping Dogwifhat or Pepe PFPs on Twitter. People still overwhelmingly wear popular collections like Punks, Miladies, or Puppets. NFTs remain a crucial part of crypto culture, and whenever retail returns en masse, they will want a piece this.
The hard part is figuring out how to play the NFT revival. There are a lot of zombie collections that will probably never recover to the highs from last cycle. At this point in the NFT cycle, it’s probably best to stick with blue chip collections that carry a prestige premium.
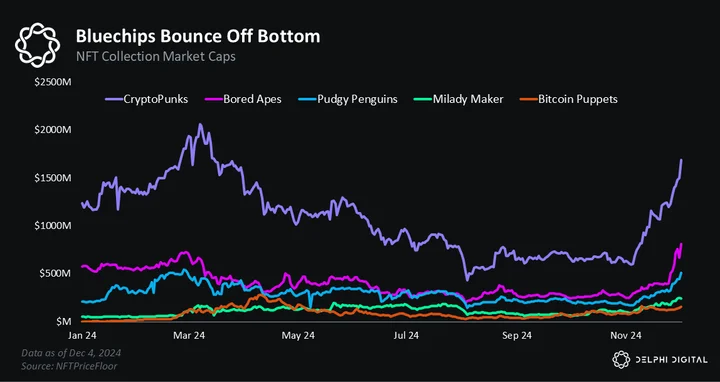
There are a few collections that fit this profile. CryptoPunks are the most obvious, as the OG collection that kicked off the meta. They are on Ethereum and signal that you are OG who “made it.” Then you have collections like Miladies, which are probably the most crypto-native NFT. And recently, we’ve seen a bunch of Bitcoin NFT collections like Puppets, NodeMonkes, and Quantum Cats take off.
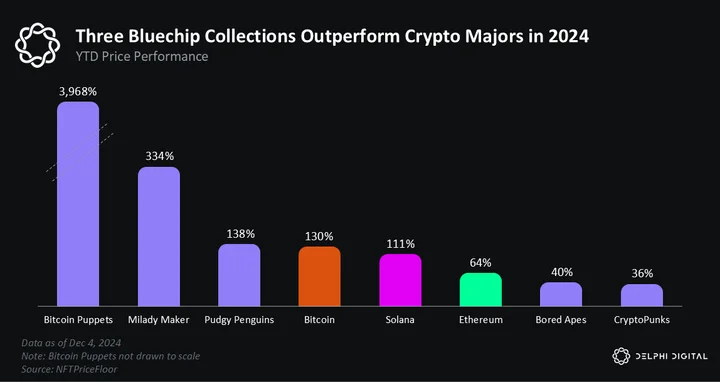
The thinking on Bitcoin collections is that a rising BTC price will provide a natural tailwind for the NFTs, and there’s also a novelty factor here as they are still relatively new. Solana is the outlier among major L1s. It doesn’t really have a popular collection on par with Punks or Puppets. Mad Lads are probably the closest, but for whatever reason, they are not considered as desirable as collections on other chains.
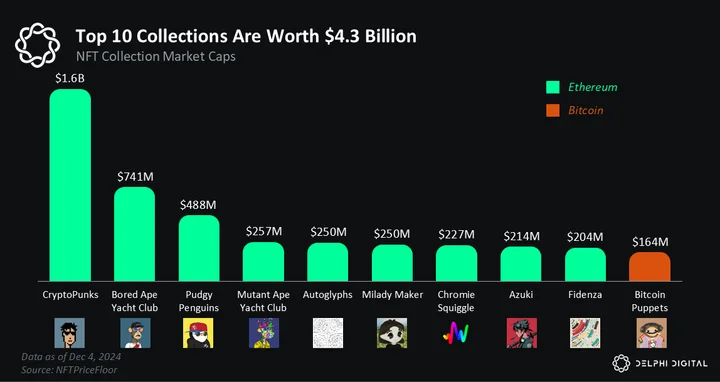
As optimism returns to crypto markets and degens start to feel wealthy again, we expect the hot ball of money to rotate to NFTs. Timing these moves is also tricky. But we think some of the blue chip collections are attractive at these levels. They will benefit from improved sentiment, rising crypto wealth, and the potential return of retail. Blue chip JPEGs like CryptoPunks convey a certain cache that no memecoin can rival. And we think the market will learn to love NFTs again in 2025.

Potential Risks In The Year Ahead
There’s always risk, so where does it lie? What’s the bear case to our outlook for risk markets?
The most obvious answer is anything that negatively impacts global liquidity. This includes:
- If central banks pull back the liquidity reigns, especially the Fed and/or PBOC.
- Higher bond market volatility —> negatively impacts collateral values (like USTs). This would cause a tightening of credit conditions and steeper haircuts, negatively impacting risk assets and crypto markets.
- If growth in private credit slows or contracts. This is possible if we see a period of outsized market volatility, or a noticeable deterioration in the economic outlook across our geographies of interest.
- There’s always a balance to find between financial market liquidity and funds needed to service the real economy. This can be negatively impacted by external shocks, such as a spike in energy prices, for example.
What could cause some of these things to happen?
- China fails to move forward with the amount of fiscal and monetary stimulus we expect; a clampdown on PBOC liquidity would adversely impact most risk markets, especially BTC.
- Global debt levels continue to rise without an adequate increase in funding liquidity (debt maturity wall for private/non-financial debts can cause serious concern and volatility if credit conditions or the availability of funding dries up).
For example, bond market stability could deteriorate if UST debt levels continue to grow without an adequate increase in funding liquidity.
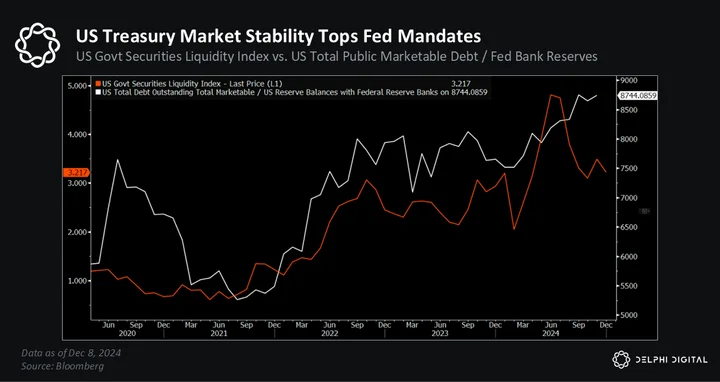
As we’ve said in the past, maintaining stability in the US Treasury market is the Fed’s ultimate mandate. When push comes to shove, inflation and employment are secondary and fall behind global financial market stability, which the US Treasury market underpins.
- Fed continues with QT —> the US Treasury continues to favor T-bill issuance to finance its growing debt, drawing down the RRP, and eventually reducing bank reserves. Again, we foresee the drawdown in the TGA helping to mitigate this risk, at least in first half of 2025.
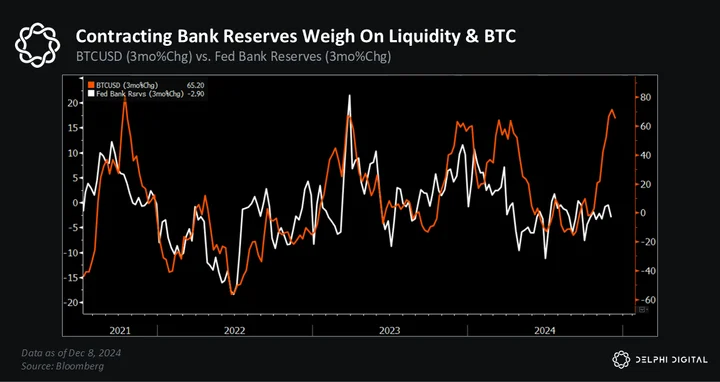
- Re-acceleration in inflation could cause the Fed to pause rate cuts, or project a shallower path for future rate cuts.
- Stronger economic data and rising concerns over the sustainability of multi-trillion dollar deficits could keep a floor under UST yields, or cause a rapid repricing. This would lead to higher bond market volatility.
US Treasury yields have jumped recently, despite two consecutive Fed rate cuts. This isn’t uncommon at the start of a rate cutting cycle, but it causes financial conditions to tighten, at least in the short term.
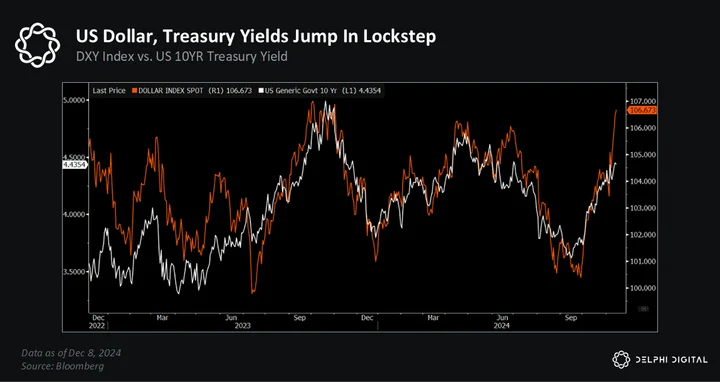
- One of the most notable risks is a stronger US Dollar, which could squeeze dollar liquidity and tighten financial conditions. This would undoubtedly weigh on risk asset markets.
Part of the most recent consolidation in Global M2 has been driven by the recent strength of the US dollar. The DXY is up over 6% since the end of September, marking its strongest period in over two years.
- A less dovish Fed and stronger outlook for US growth vs. RoW keeps US interest rates elevated, and a bid under the USD (”cleanest shirt in the laundry”).
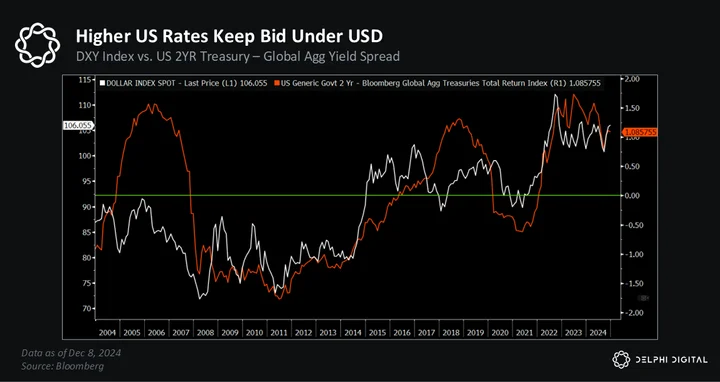
The USD is one of the best indicators to gauge market sentiment on growth, risk, and liquidity. It tracks major equity benchmarks (e.g. NDX), UST yields, commodities & energy prices, and monetary inflation hedges like gold and BTC.
Liquidity upcycles tend to see dollar weakness, another trend we highlighted in last year’s report. Any further increases in global liquidity should apply downward pressure on the greenback. In any event, if you can predict where the dollar will go, there’s a very good chance you’ll know where asset prices will end up.
Parting Words – Anthem For The Underdog
We will look back on 2024 as a turning point for our industry. Bitcoin eclipsed $100,000, crypto won hearts and minds in Washington, and glimmers of mainstream adoption emerged.
One by one, the biggest headwinds holding crypto markets back have started to topple like dominos.
In short time, the most pro-crypto US presidential administration and legislative body looks set to take office. Granted, there’s no guarantee the next wave of leadership will live up to the hype or foster a more supportive regulatory environment. Campaign rhetoric oftentimes falls short on its promises. But even a shift towards a more neutral stance could help crypto finally shed the shackles of its current regulatory overlords.
This should give crypto markets the green light to grow even bigger — and frankly speaking, higher prices solve a lot of problems. Not every problem, but definitely some.
- Higher prices spark a lot more interest and attention, which ushers in new waves of optimism and demand.
- Higher prices increase trading volumes and deepens market liquidity, which broadens the types of capital allocators willing to buy and trade crypto assets.
- Higher prices increases the aggregate balance sheet of crypto market participants — and those who choose to borrow against these bigger balance sheets creates more buying demand.
- Higher prices increase the value of project treasuries — and can reduce insolvency risk — which gives teams more firepower to invest in their ecosystems and incentivize more devs to build the next wave of apps.
- Higher prices attract more entrepreneurs and startups to enter the space and build more cool stuff.
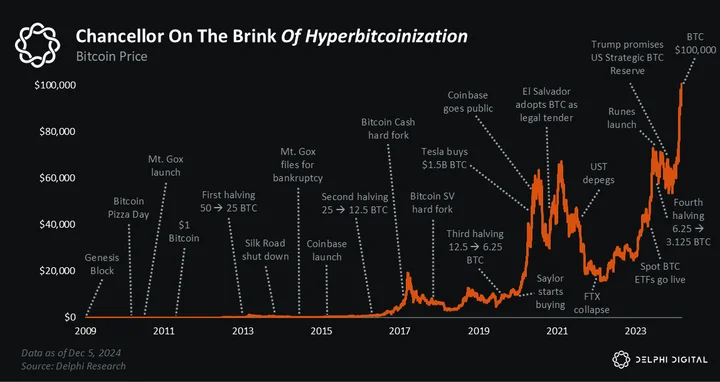
We’ve talked a lot about memecoins, but if we zoom out their rise is in part a manifestation of an even bigger secular trend — one that underpins all the excessive risk-taking and speculation we’ve seen. Simply put, many people don’t feel like The System is working for them, and crypto offers them a way out.
Look at the most recent creative explosion around onchain AI agents. Like all narratives, there’s plenty of noise to go along with the signal, but it’s possible onchain AI agents turn out to be this cycle’s DeFi Summer or NFT bull craze.
Each were defined by a new primitive that sparked an initial wave of excitement and rampant speculation, bringing with it new use cases and sources of demand. When the tide finally washed out, each left behind new infrastructure and building blocks that expanded the capabilities of crypto networks.
The majority of the next “100 million” users may not be human. But the rise of AI agents may turn out to be a key source of demand for all the infrastructure supply that’s been built over the last several years. While many may see this as just another flash in the pan, we believe these things are not only here to stay — things are only going to get crazier from here.
If we think back, this industry has gone through hell and back over the last few years.
It crawled out of the wreckage of FTX’s collapse, only to be hit with an aftershock that destroyed the centralized lending market and reduced many of its largest players to rubble.
Then it took the blame for US bank failures, a tale that was then spun by regulators to support even more aggressive overreach and their “anti-crypto” agenda. Discrimination against crypto banking, Wells notices, lawsuits, and an SEC that refused to lead by example in favor of regulation-by-enforcement.
Oh, and the cherry on top was in the midst of all that, we also experienced one of the sharpest deteriorations in macro conditions on record. That type of environment would’ve been a death sentence for many industries.
But this isn’t just any industry.
Despite everything this industry has gone through, not only is it still standing — it’s getting stronger. The battle scars are still healing, and while the fight is far from over, the momentum is clearly shifting now. Bloodied and bruised, the underdog is coming out of the corner, and it’s got a pretty big chip on its shoulder.
Now ask yourself, is this really an industry you want to bet against?
A special thanks to Christan Cioce, Ph.D. for his help with everything from data collection, to widget and dashboard creation, to review. A special thanks to Sam Friedman and Ajay Kumar for their help with editing, review and marketing.
0 Comments