The Year Ahead for Markets - 2024
DEC 22, 2023 • 76 Min Read
Introduction — Oh, How Far We’ve Come
Exactly one year ago, we published our last Markets Year Ahead report — and so much has changed that it’s hard to know where to start.
This time last year, everything was down. Risk sentiment was in the gutter. Stocks were coming off their worst year since 2008, the crypto market was in shambles, BTC was down over 75% from its prior highs, and many crypto assets were hurting even worse. Global central banks were on a one-way rate-fueled warpath trying to slay inflation, financial conditions had tightened, and many saw little end in sight.
Then 2023 came along and flipped everything on its head. It truly was a non-stop action-packed year for macro lovers and crypto market enjoyers alike.
We saw — what appears to be — the end of the Fed’s tightening cycle. We’ve seen liquidity conditions improve considerably, with more support likely coming down the pike. We’ve seen risk appetite finally start to make a come back, as markets continue to defy the skeptics.
Two years of continuous self-inflicted wounds in the crypto industry finally appears to be nearing its end (knock on wood), with the worst one of all — FTX’s infamous collapse — largely in the rearview.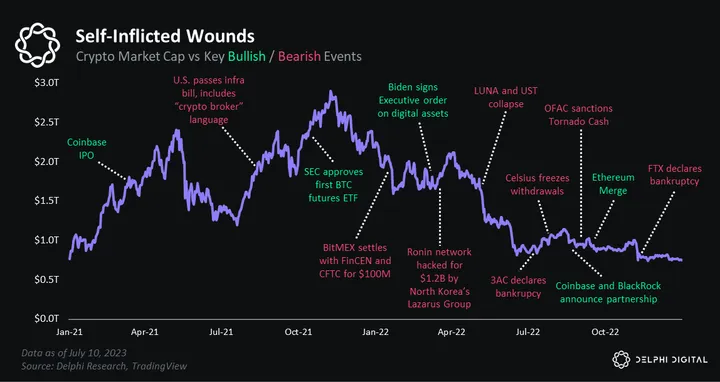
The crypto industry has even gone to battle with rogue politicians and regulators as Operation Chokepoint threatened to curtail crypto innovation and advancement (jury is out on this one but we’re still here).
On top of that, one of the industry’s greatest regulatory overhangs — the whole outstanding Binance-DOJ situation — has recently taken steps towards being resolved, lifting yet another veil of uncertainty.
Throughout it all, crypto markets have displayed staggering resolve, defying expectations and rising to levels many crypto enthusiasts weren’t expecting to see for some time.
All the mixings needed to make a delicious cocktail for crypto markets are coming together, and things are really starting to heat up now.
With macro headwinds transitioning into cyclical tailwinds, and regulatory concerns abating, 2024 could shape up to be one of the most pivotal years for crypto yet.
Without further ado, let’s dive into the key themes we’re tracking for the Year Ahead.
For those who’ve been following our Markets research this year, some of these topics and themes will be familiar. We’ve discussed many of them in detail in some of our prior reports, which complement the commentary and analysis found in this piece. We’ve provided links to many of these throughout the report for those seeking additional context.
Key Theme #1 : Liquidity Tailwinds & Crypto Cycles
Risk Back In Vogue
Risk assets have been fighting cynics all year. Heading into 2023, many were calling for another tough year as inflation, rate hikes, and rumblings of a hard landing threatened to cap any risk rally. Consequently, investors spent much of this year broadly underweight risk.
What most people didn’t anticipate was a rebound in global liquidity, the bottom of which coincided with peak investor pessimism late last year.
And that turnaround sparked a banner year for those brave enough to venture out the risk curve.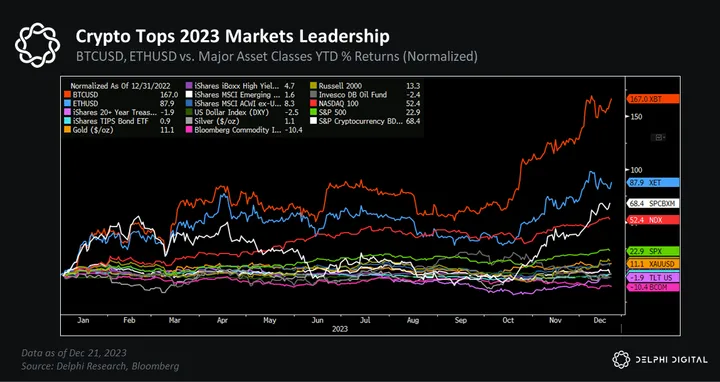
We held a more optimistic view coming into 2023.
In last year’s report, we likened 2022 to ”The Great Reset for Crypto,” making way for a period of accumulation in 2023 that would “set the stage for the next bull cycle”.
Our base case was “a renewed uptrend as early as mid-2023, but that the bulk of the move will occur in 2024-2025 as risk appetite and speculation return in full force.”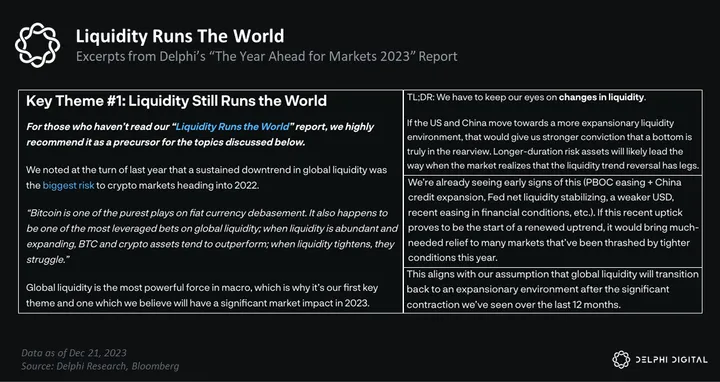
Many saw crypto’s latest rebound as nothing more than another bear market rally. However, our work has suggested the opposite, which is why we started getting even more vocal in recent months that a new cycle was upon us.
“We believe the Global Liquidity Narrative will continue to persist throughout the remainder of 2023 and into 2024, likely reversing many of the headwinds faced by asset markets over the last 12-18 months. As these catalysts continue to stack, we know that smaller, more market-specific narratives will continue to manifest and take shape.” — Catalysts Stacking Up – Will Narratives Drive Fundamentals? (July 2023)
As the rally progressed, many continued publicly chastising risk assets despite evidence that the worst was already behind us. This really has been one of the most hated bull markets in memory.
Today, major US equity benchmarks are within a whisker of breaking to new all-time highs.
For those who follow our work, this isn’t a huge surprise. History has been favoring the bulls.
“Stocks have been on a tear since bottoming back in October – so a pullback is arguably overdue – but the equity market benchmark has never retested its former lows within the following 12 months after it breaks this key retracement level. This adds to supporting evidence we’ve been citing making the case for the worst being behind us.” — Indicator With 100% Hit Rate Implies New Equity Bull Market (July 2023)
New all-time highs make for great headlines, but they’re more important than that. It erodes the notion of “just another bear market rally” and adds pressure on investors and money managers to increase risk exposure (if for no other reason than to keep pace with their benchmarks).
Now that the Fed looks to be on hold indefinitely — with their projections confirming what the market has already started pricing in — we expect more buying pressure as investors reallocate towards risk in the new year.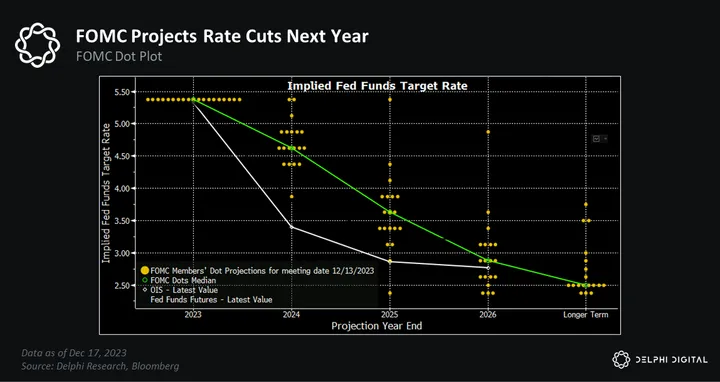
We expect crypto to benefit from this structural shift.
BTC looks to have finally broken out of its long bear market consolidation — and when compared to other asset classes, it’s the fastest horse in the race.
BTC’s latest price surge has propelled it to break out against the NDX, which itself is up >50% year-to-date.
BTC also broke out against its ‘boomer’ peer — even as gold attempts to claim a fresh all-time high.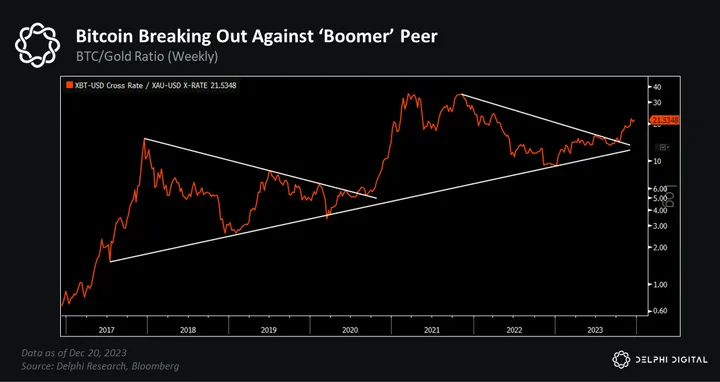
This market rally is no longer siloed to just BTC, either. We’ve been noting how the broader crypto market – ex-megacaps – also turned the corner and is starting to break out.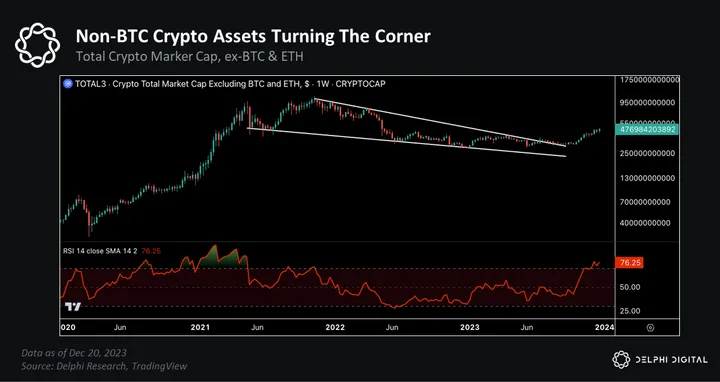
And how market breadth has improved as more crypto assets participate in the latest uptrend.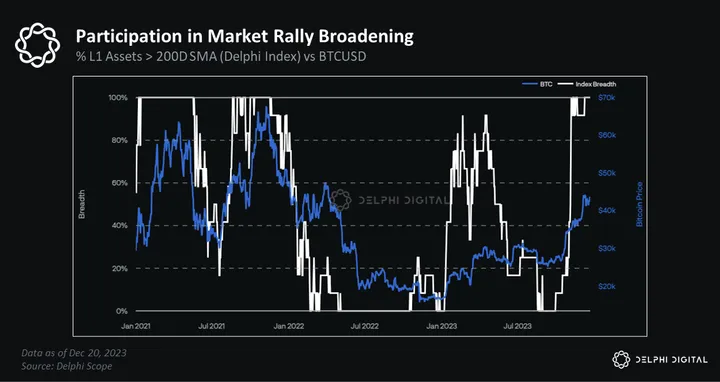
Yet despite this year’s impressive returns, general interest in crypto has lagged.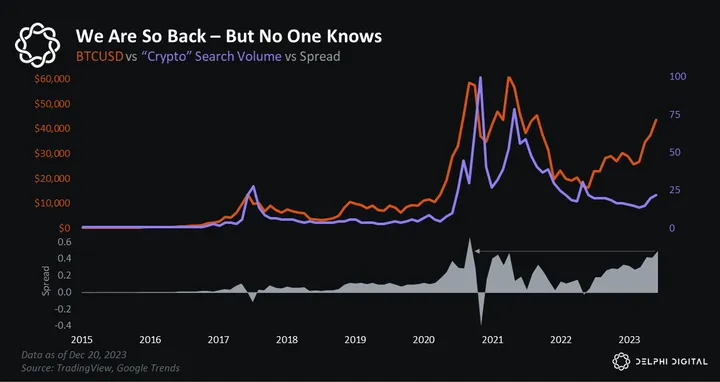
Nor have we seen an explosion in financial media coverage.
Crypto still feels like it’s in its “guilty until proven innocent” phase.
Price is the ultimate driver of attention, capital flows, and onchain activity — so prices likely need to go a bit higher before we see a real influx of new users and capital. But that time will come.
Bitcoin continues to follow our market cycle playbook almost to a T — so there’s still a lot to play for.
BTC’s price is tracking its typical post-bottom price action, implying a majority of gains are yet to be realized.
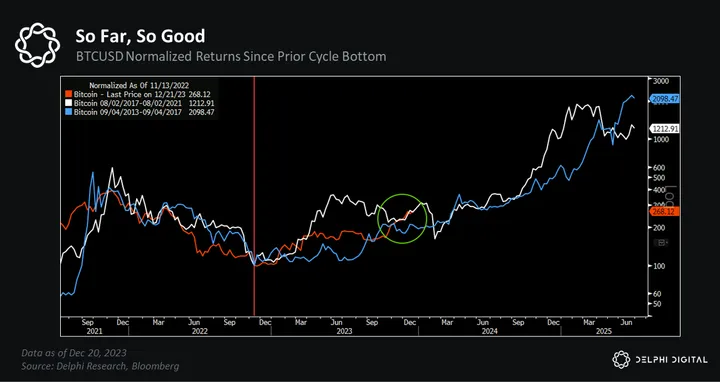
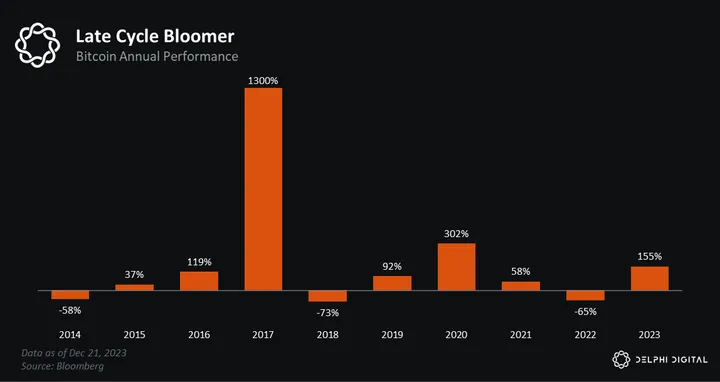
BTC is up >150% YTD, on pace for its best year since 2020. Notably, in the last two major market cycles, most of Bitcoin’s returns came in year 2 or 3.
We’re also ~110 days out from Bitcoin’s next halving (April 2024). Like prior cycles, this highly anticipated event will come almost exactly 18 months after its prior cycle bottom.
Following both prior halvings, BTC’s price was significantly higher 12 months out, with an average return of >400% (~260% post-2016, ~560% post-2020).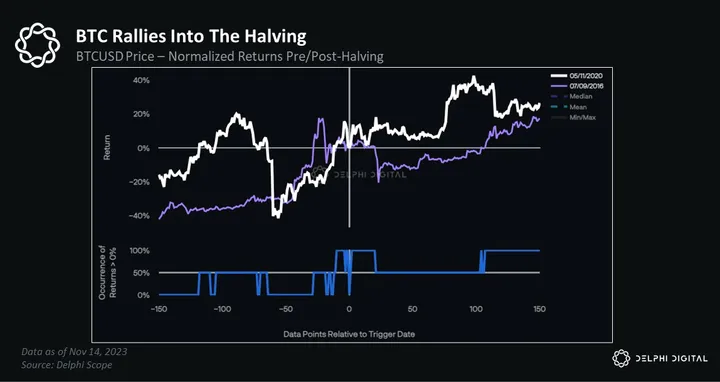
Those who’ve been following our work know the real reason why these consistencies are notable though — and why we remain steadfast in our position that we’ve been in the early stages of a new cycle.
The Fastest Horse During Liquidity Upcycles
Bitcoin halvings aren’t the primary catalyst for crypto market cycles. Evidence shows that liquidity upcycles have been the key driver of BTC and crypto bull markets to-date.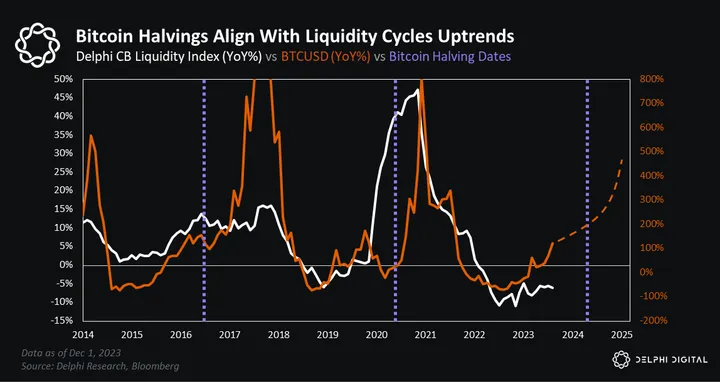
Liquidity goes up, risk appetite increases, prices rise, network activity grows, demand for crypto assets rise, prices go higher, more users and capital come in – and around we go.
We expect this dynamic to continue into 2024, largely driven by more liquidity support from the world’s two most important central banks — The Fed and China’s PBOC.
Bitcoin is not an inflation hedge in the way many believe it to be. Bitcoin is a high beta hedge on currency debasement and monetary inflation, not a hedge against consumer price inflation (CPI) — a point we’ve been harping on for years.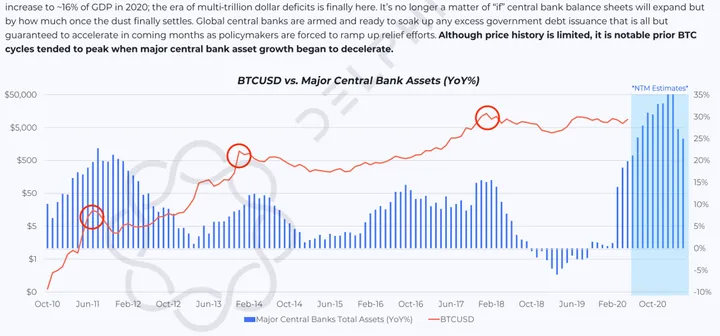
Excerpt from one of Delphi’s State of Bitcoin reports back in 2020 (oh how far we’ve come).
That’s why BTC has such a strong correlation with Fed Liquidity.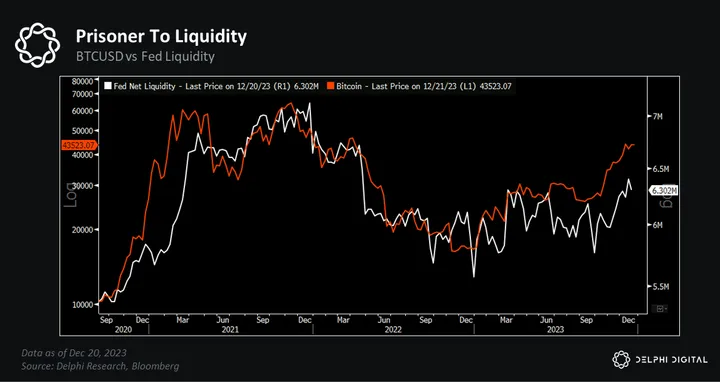
Fed Liquidity essentially tracks changes in the US monetary base.
And monetary growth drives currency debasement, which boosts asset prices, like stocks…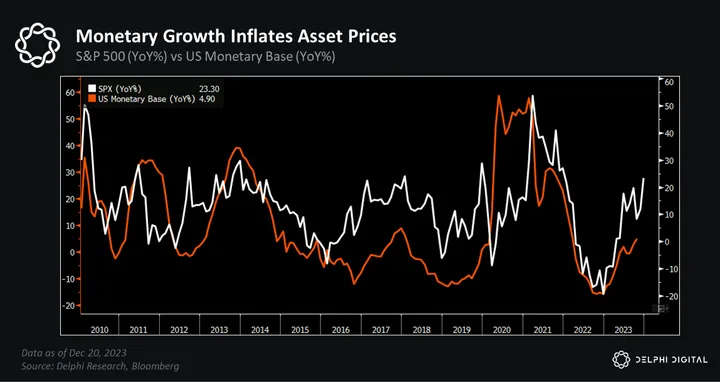
…and crypto prices.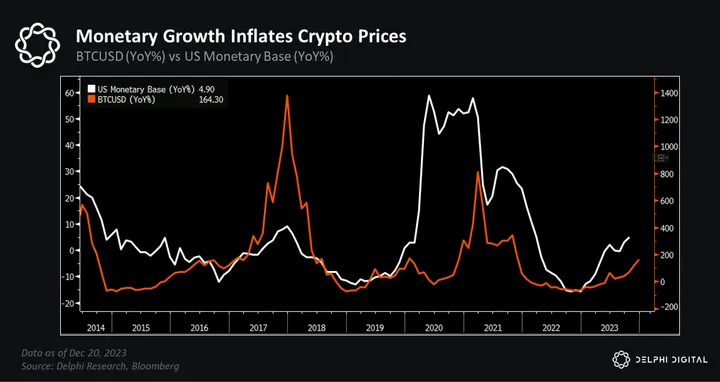
Bitcoin is one of the purest bets on liquidity expansions, so it tends to outperform when Fed Liquidity is rising — as it has been for most of the year.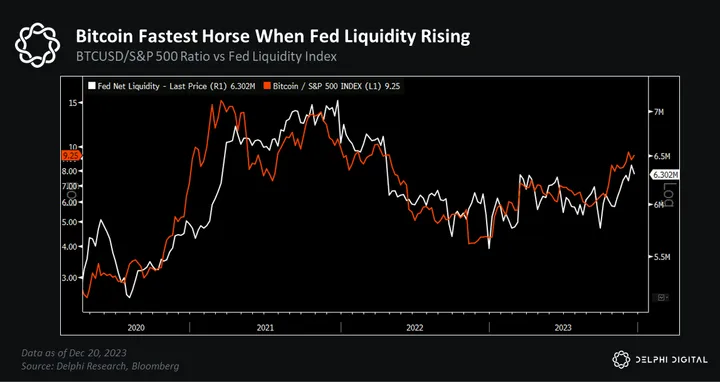
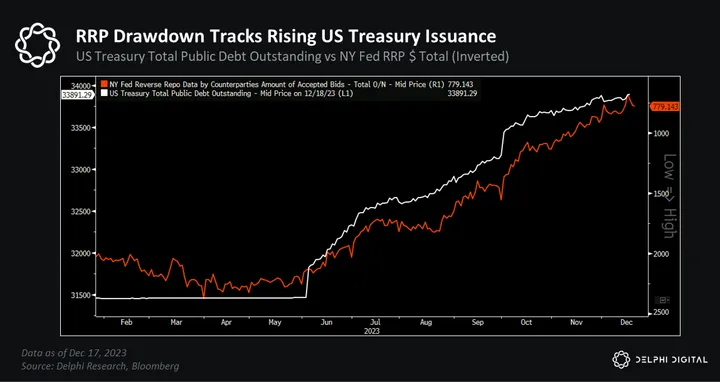
Since the March banking crisis, reductions in the Fed’s balance sheet have been met with a reduction in the amount of excess liquidity sitting in the RRP.
We’ve seen ~$1.6 trillion drained from the RRP since the end of March, more than 3 times the size of the TGA’s increase during the same period.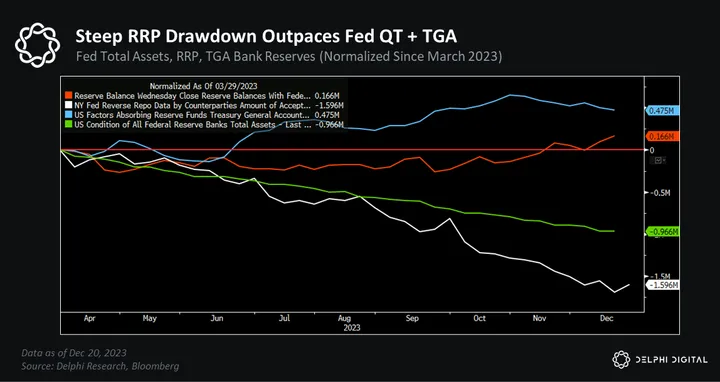
Bank reserves have actually increased over the last few months — even despite the TGA’s rise — given how sharp the drawdown in the RRP has been.
Money market funds (MMFs) have been reallocating out of the RRP into USTs — specifically T-bills — as relative yields have become more attractive.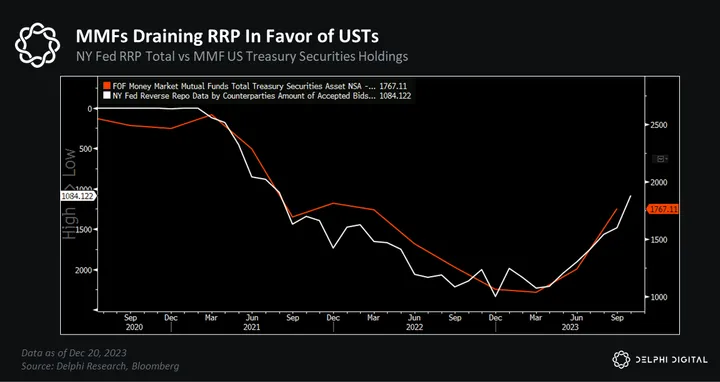
Put simply, the US Treasury has ramped up debt issuance and funds are flowing out of the RRP to absorb this additional UST supply, rather than being financed via a drawdown in bank reserves.
This serves as a liquidity boost for markets.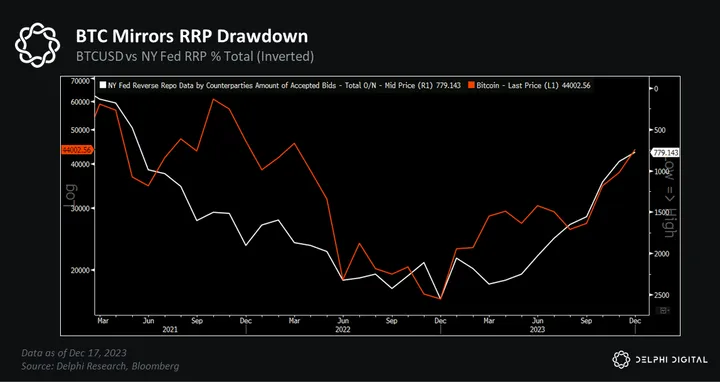
We actually predicted something like this would happen back in February.
“Let’s assume the drama surrounding the US debt ceiling gets resolved eventually (because the alternative is likely too detrimental for policymakers). When it does, we expect to see a material increase in T-bill issuance. This additional supply could help drawdown funds from the RRP given the seemingly insatiable appetite from MMFs for short-duration safe assets. This would serve as a net boost to liquidity.” — Pulse Check on Liquidity Trends (Feb. 2023)
And we expect this trend will continue over the coming months.
Policymakers will likely continue favoring shorter duration T-bill issuance over longer duration coupon debt. That way the increase in UST supply can be balanced by a similar increase in MMF demand — thus pulling more excess liquidity out of the RRP, like we’ve seen in recent months.
The US Treasury is expected to issue over $2 trillion of UST debt over the next two years, with ~$800 billion of borrowing in Q1 2024. The RRP currently has ~$700B still being parked in it.
But at the current rate, the RRP could be completely drained by the end of Q1 2024 (if not sooner). Once the RRP is drained, new UST issuance will start to reduce bank reserves.
This transition could disrupt any uptrend in risk assets since this is when QT will actually start sucking liquidity out of the system (think Fed Liquidity contracting).

There’s no specific level that classifies as the minimal amount of reserves needed. Some estimate it’s anywhere from $2.2 to $3 trillion, while others would argue it’s even higher.
Assuming bank reserves start near ~$3.6-3.8T, and the Fed’s balance sheet runoff of USTs continues to track ~$60B per month, QT in its current form could last well into 2H 2024 before bank reserves start approaching these levels.
However, given the scars of the 2019 spike in repo rates, and banks’ desires to hold more liquid cash buffers following March’s regional banking crisis, we anticipate tapering — or an outright end — to QT well above these levels.
The Fed has also given itself air cover to start cutting rates if any market disruptions arise. And there’s a decent chance they might. If asset prices take another sharp dive, insolvency risks will become increasingly apparent — and at the most inopportune time.
Goldman Sachs estimates there’s ~$1.8 trillion of corporate debt maturing over the next two years.
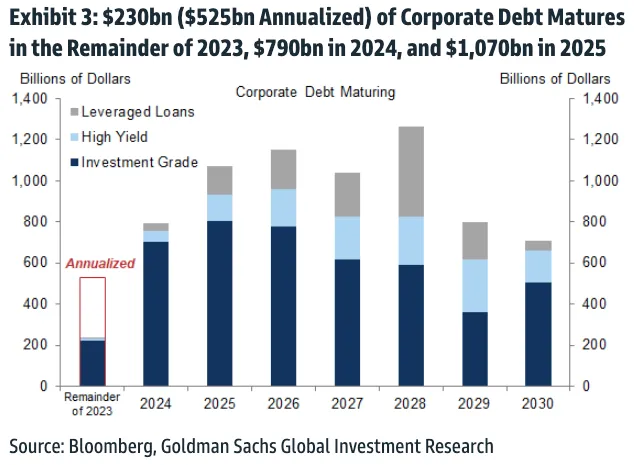
Which means many companies will need to rollover existing debt obligations next year, even those that don’t mature until 2025 as to avoid them converting to short-term debts.
Debt needs liquidity — something we talked about in last year’s report (and again after the March banking fallout).
If credit conditions are too tight — or rates are still too high — when companies go to refinance, easier financing conditions will transition from a nice-to-have to a need-to-have.
This all assumes volatility in the Treasury market remains relatively benign, too. Liquidity conditions in the UST market are still fragile, so any disruptions — like a major unwind in the hedge fund basis trade for example — will call the Fed to action earlier than anticipated (as we’ve seen in the past).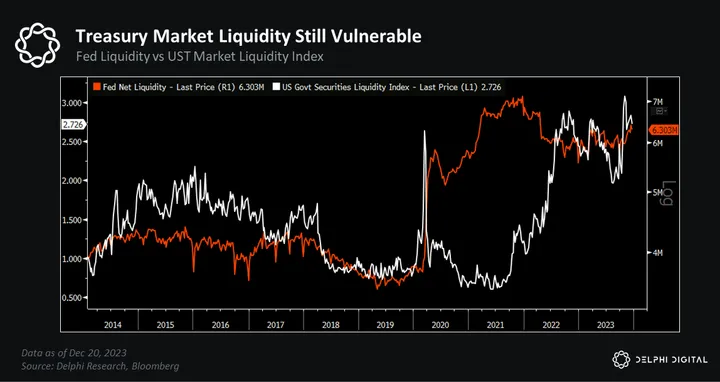
The reality is large fiscal deficits will force the US Treasury to issue more and more debt — and again, more debt will require more liquidity.
Our base case remains that the Fed will need to reverse QT and restart asset purchases to expand its balance sheet over the next 12-24 months. Debt monetization is still the End Game.
In short, we believe funds will continue to flow out of the RRP in Q1 2024, draining a key source of excess liquidity. Once the RRP is drained, new UST issuance will start to deplete bank reserves, which will put more pressure on the Fed to reverse QT and potentially restart asset purchases in 2H 2024.
China Picking Up Liquidity Baton
The Fed gets a lot of attention, but it isn’t the only game in town.
China’s PBOC has become one of the largest contributors to global liquidity — and it’s been getting more active.
We stated early in the year that China looked poised to drive the next phase of liquidity growth, a trend we doubled down on again this summer.
“While the U.S. and its massive Covid-era stimulus received most of the attention in 2020, China is one to watch going forward — it looks poised to take the liquidity baton in its battle against deflation and its renewed commitment to shoring up domestic growth.” — Catalysts Stacking Up – Will Narratives Drive Fundamentals? (July 2023)
Since then, PBOC liquidity injections have continued to increase.
We’ve written quite a bit on this topic (examples here and here), but in short:
- Top officials in the world’s second-largest economy have been staring down the double barrel threat of deflation and struggles to jumpstart a sustainable rebound in economic growth.
- Credit growth tends to pick up when China’s economic outlook wanes, which we’ve seen especially given an even steeper contraction in export growth than many anticipated.
- Similar credit expansions are usually driven by more PBOC liquidity support.
- More liquidity injections tend to boost asset prices, particularly risk assets.
The S&P 500 has been tracking expansions and contractions in the PBOC’s balance sheet since the GFC.
BTC and crypto markets also exhibit a strong correlation with PBOC liquidity expansions.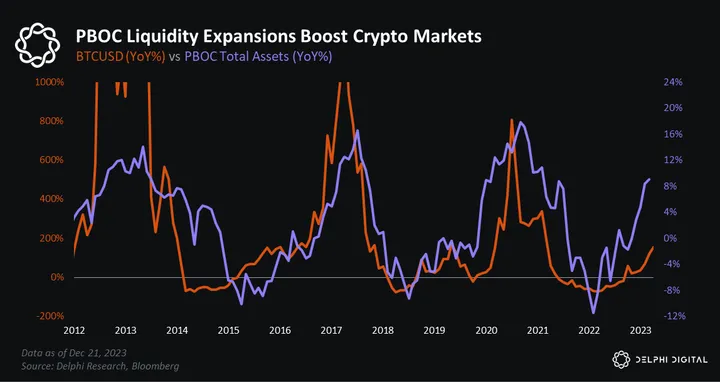
We’ve drawn parallels between this year’s market action and that of 2015-2017.
If we rewind the clock, risk assets had one of their best years in 2017 despite consistent Fed rate hikes and growing anticipation that QT was around the corner.
During this time, the PBOC’s balance sheet was also expanding, and coupled with a weaker USD, helped give risk assets the liquidity boost they needed.
Bitcoin naturally benefited from this as well.
We’ve seen a somewhat similar dynamic play out this year. Even though the Fed has signaled peak rates are now behind us, they’re still higher than they were at the start of the year (and only recently have market expectations shifted dramatically towards multiple rate cuts next year).
Yet risk assets had another banner year as global liquidity rebounded.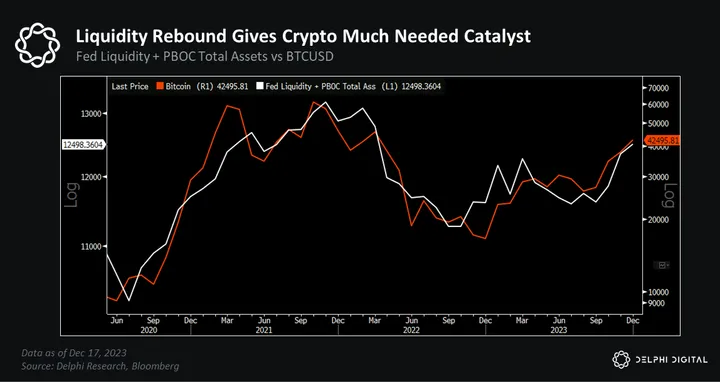
More central bank liquidity drives more demand for monetary inflation hedges like gold, which is also tracking its price action from that period.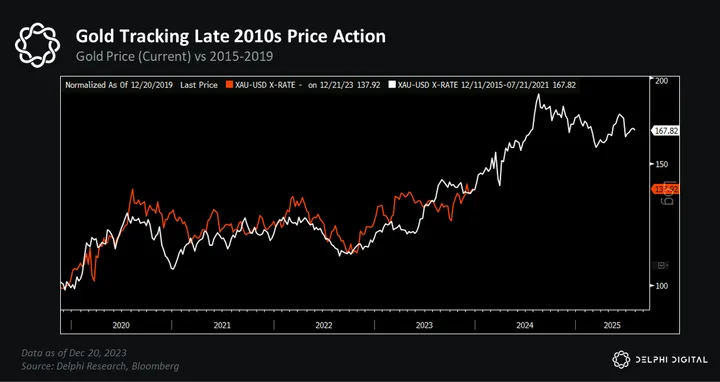
The DXY has also been tracking this period. After a similar +25% surge, the DXY rolled over, making way for asset prices to move higher.
The USD is one of the best indicators to gauge market sentiment on growth, risk, and liquidity. It tracks major equity benchmarks (e.g. NDX), UST yields, commodities & energy prices, and monetary inflation hedges like gold and BTC. If you can predict where the dollar will go, there’s a very good chance you’ll know where asset prices will end up.
Liquidity upcycles tend to see dollar weakness (another trend we noted in last year’s YA report). So further increases in central bank liquidity will apply downward pressure on the greenback…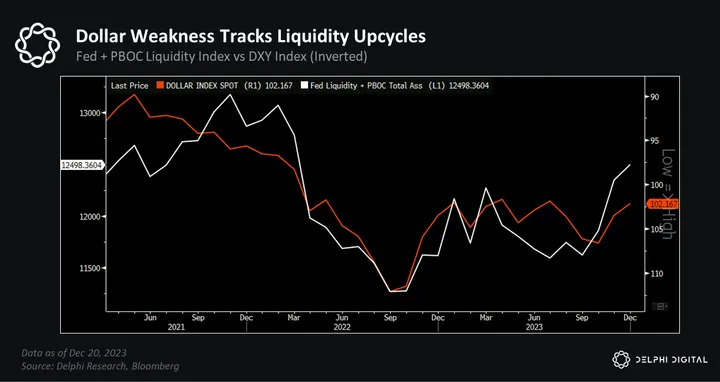
…which is good for BTC and crypto markets.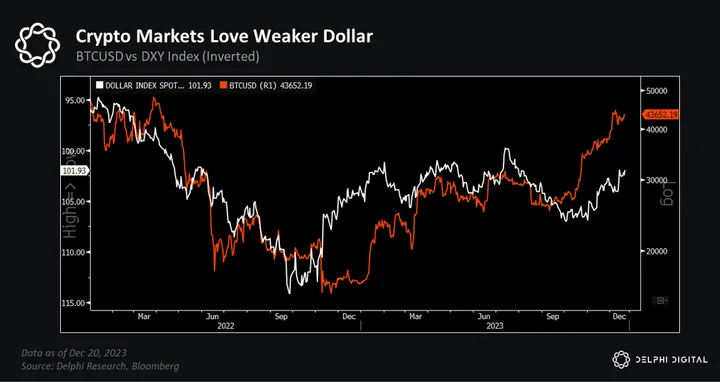
More liquidity should propel higher beta segments of the crypto market to outperform too.
Solana (SOL) is one we’ve been talking about for a while as a candidate primed to outperform this cycle. It reminds us of ETH last cycle, with plenty of upside potential if its ecosystem continues to grow as fast as we anticipate.

In short, the combination of Fed and PBOC liquidity is a powerful force for BTC and crypto. We expect central bank liquidity to continue trending higher next year as we’ve entered into a new liquidity upcycle. More accommodative policy from these juggernauts will also give other central banks the cover they need to ease and support their own economies.
Every Bull Market Sees Consolidation Periods
Despite our more favorable year-end views, there’s a decent chance we see some consolidation in the next few months.
BTC has now officially retraced 50% of its peak-to-trough selloff.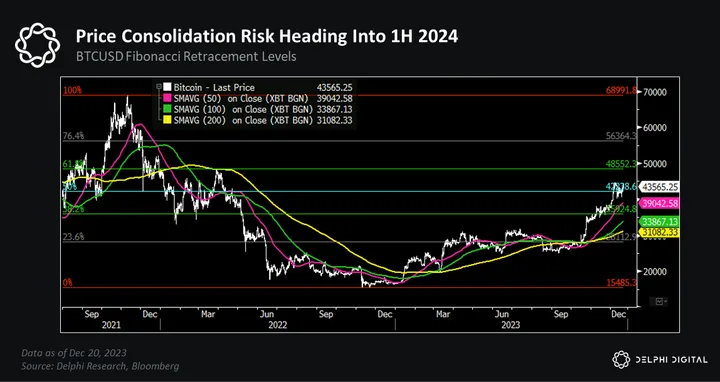
This was a key area of resistance last cycle — BTC traded sideways and eventually saw a sizable pullback that lasted over a year before ultimately making its push to a new ATH. We saw similar price action back in Q4 2016, though the extent of that consolidation was much shorter (~5 months).
The market selloff in March 2020 is an obvious outlier here, but at a minimum, these periods of consolidation tend to last at least a few months. In each prior instance, BTC broke above its 61.8% retracement level before topping out, so a move above $50K could mark a natural consolidation point.
Historically, once BTC retraces >75% of its peak-to-trough drawdown, that’s when it’s game on. If price were to make a clean break above ~$56K, the next logical stop would be a retest of its prior high (~$70K).
Prediction: We will see a period of consolidation in 1H 2024, which sets up the next leg of the bull market. BTC breaks to a new all-time high by the end of 2024.
A *Very* Speculative Timeline for 2024
Obviously, none of us has a crystal ball, but given all of the above and what we’re seeing, here’s how things could transpire next year:
- Liquidity expands into Q1 2024, driven by a continued drawdown in the RRP and further liquidity support from the PBOC.
- Spot BTC ETF gets approved and launches into an ideal backdrop since demand for BTC exposure is a lot more palpable when price is going up (and we know liquidity turbocharges fund flows).
- The Bitcoin halving in early April gives price another boost as BTC tends to run up in the weeks leading up to the event. Again, halvings aren’t the primary driver of crypto bull markets, but they can pour fuel on an already lit fire.
- All these potential near term catalysts (liquidity expansion, ETF launch, Bitcoin halving) could lose steam right around the same time in late Q1 / early Q2. This is where the greatest likelihood for a pullback/consolidation lies in my view, though its possible we see this sooner given how far prices have already run.
- It’s important to remember every bull market sees some period of price consolidation — the market never goes up in a straight line. Pullbacks and price consolidations are not only guaranteed — they’re necessary, healthy resets that setup the next big upside move.
- Mounting pressures will eventually force the Fed to desert QT and restart asset purchases in 2H 2024. Coupled with more liquidity support from the PBOC — and likely other central banks as the year progresses — BTC will break to a new high by the end of 2024.
Key Theme#2 : Crypto Markets Are Transitioning Into A High Volatility Regime
Volatility is one of the most important concepts in financial markets. Many use volatility as a measure of risk; I prefer to think of volatility strictly in terms of the price fluctuations of assets over time. Generally, more risky assets tend to be more volatile on average than less risky assets.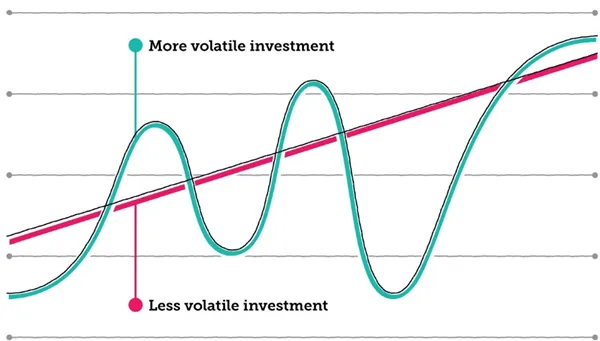
Simply put, higher volatility means an asset is more likely to trade in wider ranges. More risky assets like equities or crypto are likely to resemble the profile described by the green line, whereas less risky assets, like fixed income vehicles, are likely to be described by the red line.
Volatility is the lifeblood of active market participants.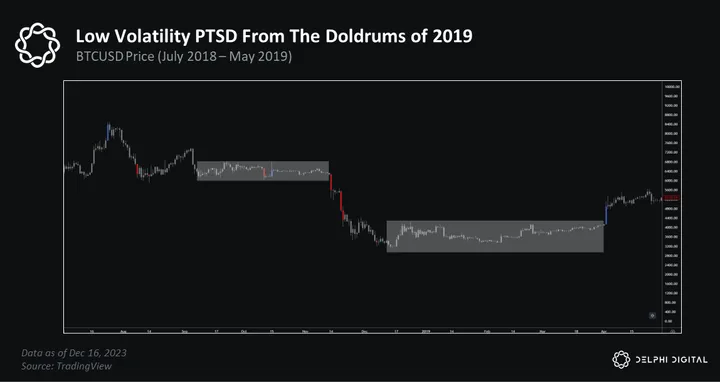
Without volatility, prices move less, leading to fewer money-making opportunities and overall apathy in a market known for its wild behavior. Those who were around in 2019 know this feeling quite well. 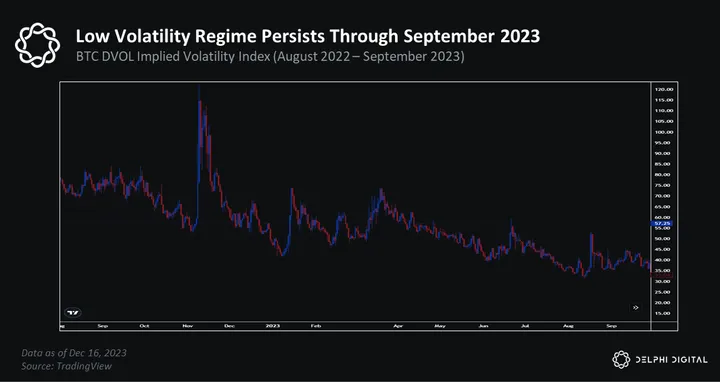
The last 18 months could be characterized as a decreasing/low volatility regime. It’s been a challenging environment for active market participants to navigate.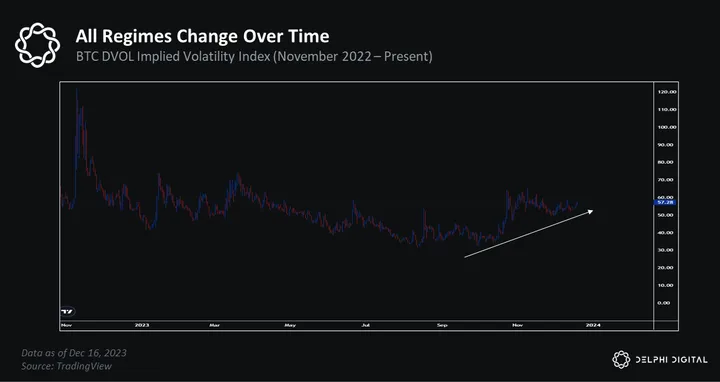
But, as Bob Dylan notes, the times they are a-changin.
Take Notice of Changing Volatility Regimes
Volatility regimes are a defining behavior of financial markets. These regimes, characterized by distinct levels of price fluctuations, greatly influence the performance of various asset classes, including equities, bonds, and cryptocurrencies.
If you are an active market participant, identifying the regime you are in is absolutely essential.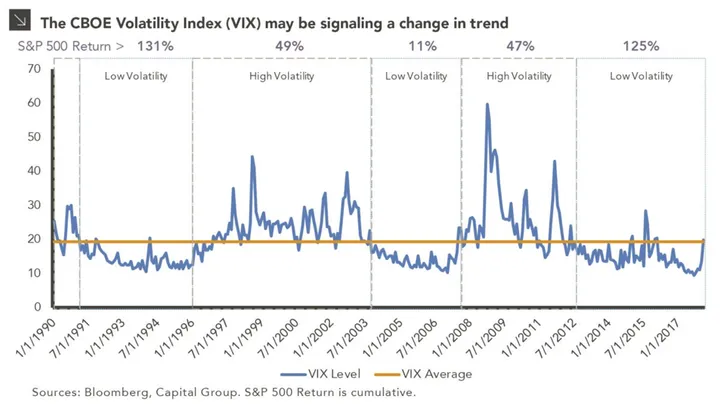
Low Volatility Regimes demonstrate more subdued price movements (and perhaps more consistent growth) on average, whereas High Volatility Regimes are marked by significant price swings in traditional markets, often triggered by macroeconomic uncertainties or geopolitical events. The 2008 financial crisis and the COVID-19 pandemic are prime examples.
In crypto markets, the easiest way of determining the current vol regime is by looking at some volatility metrics, like @velodata BTC DVOL implied volatility index used previously. Another way of visualizing vol regimes is by simply looking at an asset’s daily trading ranges and comparing them to years past.
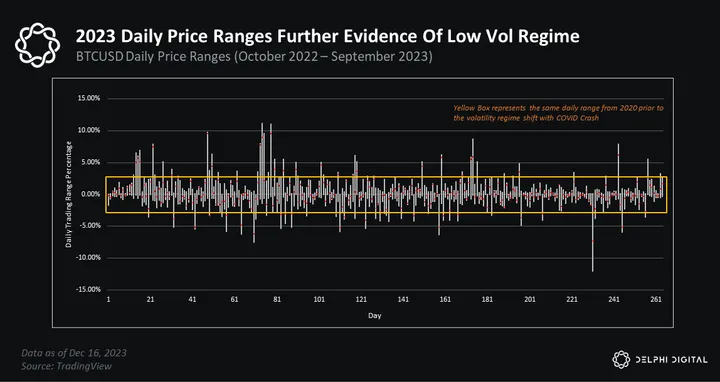
The low vol regime throughout the majority of 2023 is clear for all to see…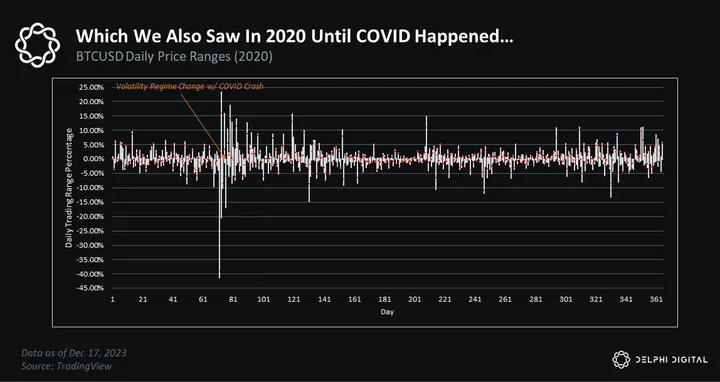
Which is eerily reminiscent of the low vol regime experiences in 2019 through March 2020/COVID. Everything changed when COVID happened as markets went through a vol regime transition.

This persisted throughout the 2021 market cycle, before ultimately ending and transitioning back to the lower vol regime that we’ve been experiencing.
Transitional Phases: Transitional phases refer to the shift between low and high volatility regimes and can be the most important dynamic for investors and active market participants to identify.
In my experience trading financial markets across a few different assets, the biggest volatility regime shifts (and opportunities) have come on the back of external forces such as:
- Clarity or uncertainty around the economic situation or market event
- Major geopolitical events
- Central bank policy changes
“There are decades where nothing happens; and there are weeks where decades happen.” This is what transition phases are to financial markets. The optimal strategies for low vol regimes may not be as effective in high vol regimes (and vice versa).
As it happens, market activity suggests that we are likely in that phase now. We also happen to be on the cusp of an interesting year.
Organic Volatility Events Add Fuel To The Fire
2024 is set up to be pivotal, littered with organic volatility events that promise to shake up markets. As we learned, exogenous events can have profound impacts on volatility regimes and asset price fluctuations, especially within crypto markets.
On the docket for 2024 we have:
- Bitcoin Halving
- BTC Spot ETF
- 2024 Presidential Election
Bitcoin Halving: Bitcoin halvings typically lead to increased price volatility. Whether this is because BTC halvings have typically lined up with larger macro liquidity factors discussed in prior writings or a type of self-fulfilling prophecy, the data has been clear. Coincidentally, we are seeing similar timing with respect to easing liquidity conditions as we head into the 2024 halving event.
BTC Spot ETF: The approval of a Bitcoin spot ETF could mark a significant shift in Bitcoin’s market dynamics, possibly aligning its volatility more closely with traditional financial markets over time.
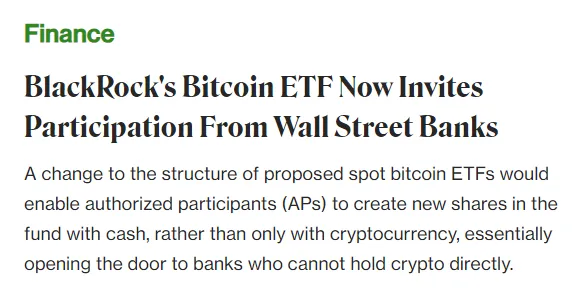 Advocates of crypto markets are hoping a Bitcoin ETF will usher a wave of new capital that was otherwise cautious about wading into crypto markets in the past. After all, up until relatively recently, it was still a career risk to jump into the industry. These financial products, championed by the likes of Blackrock, have essentially stamped BTC with the proverbial stamp of approval.
Investors will be keen to monitor the initial flows that make their way into these new products to gauge demand.
This topic will be discussed in more depth in the following section.
2024 U.S. Presidential Election: Presidential elections can have significant impacts on markets (think back to Trump’s 2016 election and policy decisions that resulted), and election years often bring uncertainty. Market uncertainty breeds volatility.
Obama famously stated that “elections have consequences.” And while he wasn’t referring to financial markets and crypto assets, this statement is extremely fitting for the upcoming year.
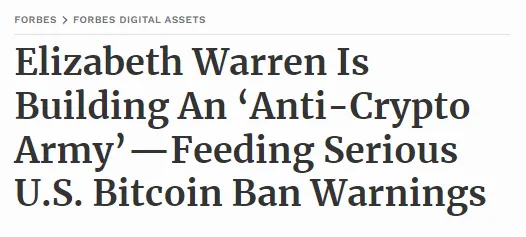 With respect to crypto specifically, this is perhaps the most important election in the industry’s history to date. Crypto innovation and the industry has found itself as part of the typical partisan battles fought in DC, as we’ve seen with Senator Warren’s recent call to arms. This is a shame, as technological innovation should be apolitical.
This has also been a big year for crypto regulation and litigation. The SEC has taken aim at numerous industry participants, such as Coinbase, Grayscale, Ripple, and others, while mostly coming up empty-handed. The outcome of this election will likely have implications on the regulatory landscape for the industry at the same time in which crypto is being opened to broader US capital markets. We believe it will be a pivotal election.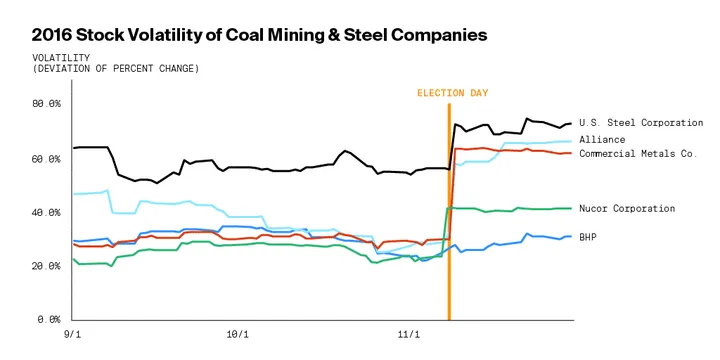 One of Trump’s main campaign promises was to bring back jobs in the U.S. coal and steel industries. When Trump was confirmed victorious, these industries reacted.
 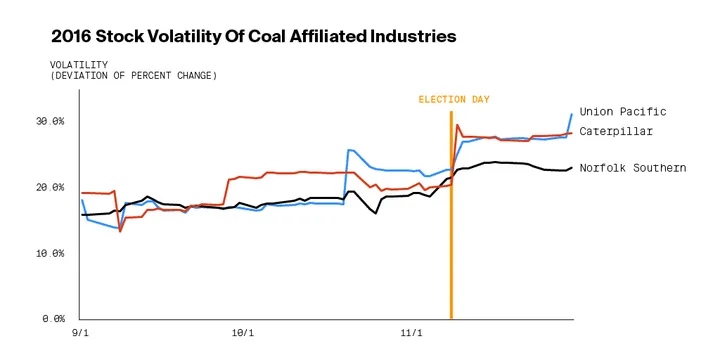 We saw ancillary industries react, as well. If we expect a similar potential outcome for crypto markets on the back of a positive election outcome in 2024, it is worth keeping this historical dynamic in mind when making allocation decisions. A specific example that springs to mind is Coinbase, a juggernaut positioned at the intersection of crypto and traditional finance. As it so happens, we’ve laid out the bull case in our report, Coinbase: From Sleeping Giant To Industry Leader.
Concluding Thoughts
As we wade into 2024, it would behoove active market participants to take note of the changing market environment, specifically the transition from a lower volatility regime into a higher volatility regime that we believe is occurring
Proper identification of these underlying dynamics allows investors to more easily calibrate their expectations and risk parameters. As we’ve noted, these transition periods are often brought upon by exogenous factors, such as:
- Clarity or uncertainty around the economic situation or market event
- Major geopolitical events
- Central bank policy changes
Coincidentally, we have all of these at the moment. On top of this, we also have several KEY events slated for the 2024 calendar, including:
- Bitcoin Halving Event
- Pending Crypto Spot ETF Approval in the United States
- 2024 Presidential Election
Combining these exogenous factors with the organic volatility events discussed above, 2024 promises to be a firecracker of a year. First up on the docket is the Pending BTC Spot ETF in January, fingers crossed!
Key Theme #3: Crypto Spot ETFs… The Institutions Are Coming!
The anticipated approval of a Bitcoin spot ETF in January 2024 is a watershed event in the cryptocurrency market with far-reaching implications.

This development is not only a milestone for Bitcoin, but a seismic shift in crypto’s market structure. To fully appreciate this impact, it is crucial to understand the role of ETFs in equity markets, the active vs. passive management debate influenced by ETFs, and the concept of passive drift.
Role of ETFs in Equity Markets
ETFs have revolutionized investment markets by providing a vehicle that combines the diversification benefits of mutual funds with the liquidity and ease of trading of stocks. They allow investors to gain exposure to broad market indices or specific sectors with lower fees and more flexibility than traditional mutual funds.
The movement toward passive management has been historical shift; gradual and consistent. In 2000, only 12% of equity assets were in passive funds, compared to about 50% by 2020. This demonstrates the growing influence of passive investment strategies, primarily driven by the proliferation of ETFs and their low-cost implementation.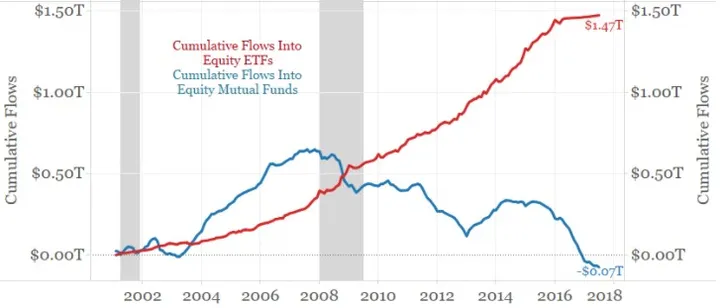 With the approval of a spot BTC ETF, the TAM in terms of institutional market participants increases substantially, as around 50% of assets are held in passive investment funds. We might expect to see similar statistics around BTC ownership in the upcoming years as more institutions and funds begin their allocation processes.
Active vs. Passive Management
The rise of ETFs has intensified the active vs. passive management debate in investment circles. Passive management refers to the investment approach of using ETFs to track market indices passively. ETFs offer a low-cost, transparent, and efficient way of executing this strategy. This has challenged the value proposition of active management, where fund managers attempt to outperform the market through stock selection and timing.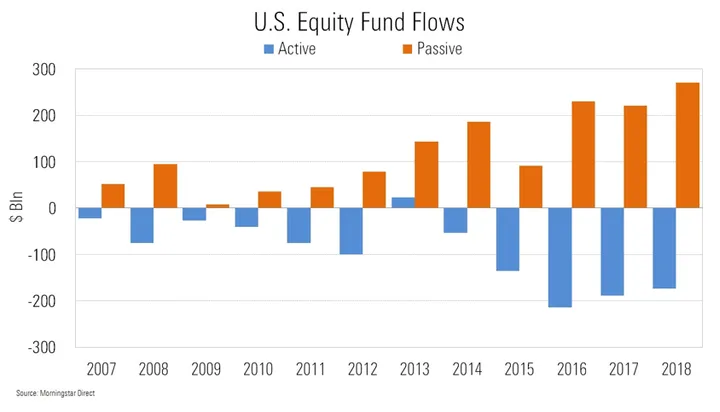
The shift towards passive investment strategies has significant implications on market dynamics. It has led to a concentration of capital in index-tracking products, potentially impacting price discovery and market efficiency.
Some argue that this could lead to market distortions, as securities included in major indices may become overvalued, while those not included are undervalued. We have written about this concept in the report, Liquidity Cascades & the Evolution of Financial Markets.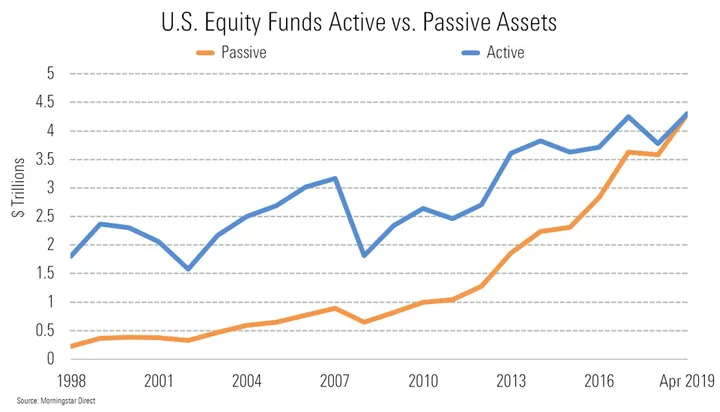 As of 2020, passive U.S. equity funds have amassed about $4.6 trillion in assets, surpassing active funds’ $4.3 trillion for the first time. This shift is indicative of a broader trend in market preference.
For better or for worse, volatility shocks and liquidity cascades have already established themselves as defining features in crypto markets. Will the establishment of passive products and trends we’ve seen in equity markets further exacerbate these dynamics, or will the (anticipated) substantial flow of capital over time help act as a volatility mitigant?
The dominance of passive investing might also strongly influence asset pricing dynamics. As more capital flows into index-tracking products, the prices of securities in those indices could be driven more by their index weight rather than their fundamental value. We have written about this concept in the report, Volatility, Order Flow, & the Inelastic Market Hypothesis.
ETF Rebalancing Dynamics
ETF rebalancing is the process by which traditional ETFs adjusts their portfolios to maintain its original asset allocation and investment strategy. Think of the SPY rebalancing as certain stocks increase (TSLA) and others decrease (Dollar General).
Many asset allocators will create portfolios targeting a specific asset allocation/sector allocation utilizing ETF products. These allocators will also rebalance their portfolios to remain in compliance with their investment mandates.
Bitcoin will now be invited to this ETF party. However, the party might be a double edged sword at times. The impact of ETF rebalancing on market can be viewed through a few lenses:
- Price Impact: Rebalancing can create significant buying or selling pressure, potentially affecting Bitcoin’s market price. For instance, selling large amounts of Bitcoin to align with a benchmark during rebalancing can dampen price action in the short term.
- Market Liquidity: Regular rebalancing trades can enhance overall market liquidity. However, in times of low market liquidity, these trades could exacerbate market stress and lead to more pronounced price movements. Bitcoin is much less liquid than its TradFi counterparts, meaning these impacts can be exacerbated.
- Volatility: Rebalancing activities might amplify Bitcoin’s inherent volatility, especially if the ETF holds a substantial market share.
- Influence on Market Dynamics: Knowledge of the ETF’s rebalancing schedule could lead to front-running by other market participants, potentially impacting prices. Additionally, large ETF trades might have the potential to induce liquidity cascades in the right market environment, something we’ve written about extensively. It has been documented that ETF rebalancing is associated with strong price distortions of underlying securities, so it would be naive to expect the Bitcoin market and ETF to be different.
Institutional Investors’ Approach
The approval of a Bitcoin spot ETF is a crucial step in legitimizing cryptocurrencies as an asset class for institutional investors. However, their participation is not guaranteed to be immediate or substantial. Herein lies a short-term risk factor for markets, as all eyes will be focused on the initial flows and demand for the BTC spot ETF once launched.

Should these numbers disappoint and fail to meet expectations, markets may play out in classic ‘sell the news’ fashion.
Additionally, institutional investment decisions are guided by factors such as investment mandates, risk assessments, and compliance requirements; not the ‘vibes’ and ‘memes’ approach that many crypto natives adore.
- Investment Mandates: Many institutions have specific mandates that dictate their investment strategies. A Bitcoin spot ETF would need to align with these mandates, which often have an emphasize diversification and risk management. Amending old and drafting new mandates may take some time.
- Compliance and Risk Management: Institutions are bound by stringent compliance standards. The volatile nature of crypto markets could pose challenges in risk assessment and management, potentially delaying institutional adoption beyond a blue chip asset such as BTC.
- Market Maturity: Institutional investors typically seek stability and maturity in their investments. While an ETF provides a regulated and structured way to invest in Bitcoin, the overall maturity and liquidity in the market may cause institutions to move a bit slower than anticipated.
Gradual Adoption Timeline
Given these considerations, it’s reasonable to expect a gradual adoption timeline for institutional investors. Initial participation may be cautious, with a focus on small, exploratory investments as institutions gauge the market’s appetite for demand and overall regulatory environment as we wade into 2024.
Gold ETFs: A Historical Precedent
The introduction of gold ETFs in the early 2000s can help serve as a useful comparison. Gold ETFs provided a more accessible avenue for investing in gold, leading to increased demand and a significant rise in gold prices over time. They also contributed to greater liquidity and price discovery in the gold market.
Coincidentally, all of these factors are current impediments standing in the way of more widespread crypto adoption and allocation.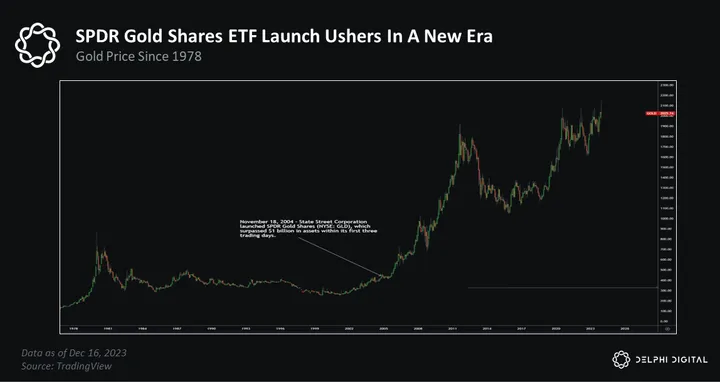
- Initial Flows and Growth: Upon their introduction, gold ETFs witnessed substantial investor interest. For example, the first U.S. gold ETF, SPDR Gold Shares (GLD), launched in November 2004, accumulated over $1 billion in assets in just three days. In its first year, GLD’s assets under management (AUM) soared to over $3 billion.
- Current State of Gold ETFs: As of 2023, the AUM of gold ETFs globally stands at approximately $150 billion, demonstrating the profound long-term impact of these investment vehicles on the gold market.
We know that many investors are justifying a BTC investment allocation under the premise of it serving a similar role as gold in their portfolios. Digital gold, if you will. Don’t take my word for it, this is what was said between legendary investors PTJ and Stanley Druckenmiller during a fireside chat. Given similarities and portfolio roles shared by these assets, we may begin to see history start to rhyme.
Concluding Thoughts
The introduction of a Bitcoin spot ETF is poised to initiate a sea change in the cryptocurrency market, much like the transformative impact ETFs have had on traditional equity markets.
We’ve seen the dramatic growth in passive fund assets, from a mere 12% of equity assets in 2000 to approximately 50% by 2020. This underscores the substantial influence ETFs have over equity markets, and might offer a glimpse into the future trajectory of cryptocurrency investment strategies.
The phenomenon of passive drift in ETFs, and its consequential impact on market dynamics, cannot be understated. Significant rebalancing within large ETFs has been known to trigger market movements worth billions. These dynamics will provide new opportunities for crypto market participants.
We also expect that institutional adoption is likely to be gradual, mirroring the cautious approach historically taken in new and emerging markets. Watching initial demand for these products may provide a useful early signal.
And the historical analysis of gold ETFs has been particularly telling. The meteoric rise in the AUM of gold ETFs, from $1 billion in just three days post-launch in 2004 to approximately $150 billion in 2023, and the striking similarities between the assets suggests the potential for Bitcoin to do something similar in the coming years. What will this mean for the price of the orange coin? Probably higher.

In our view, integrating these factors—market structure transformation due to the rise of ETFs, the nuances of the active vs. passive management debate, the historical impact of gold ETFs, and the cautious yet optimistic outlook for institutional investment in Bitcoin—provides the best framework for thinking about the post Bitcoin spot ETF approval era coming soon.
This development could signal a major shift in the cryptocurrency landscape, influencing investment behavior, asset valuation, and market dynamics, and we believe investors should plan accordingly. Afterall, the Bitcoin spot ETF is not the only spot ETF on the docket for 2024.
A new challenger soon approaches… the Ethereum spot ETF.
Key Theme #4: Endless (Solana) Summer
After a brutal 2022, Solana was one of 2023’s biggest winners.
SOL’s move was sparked by the broader market rally. BTC and ETH pumped, and SOL pumped even harder as a higher beta play.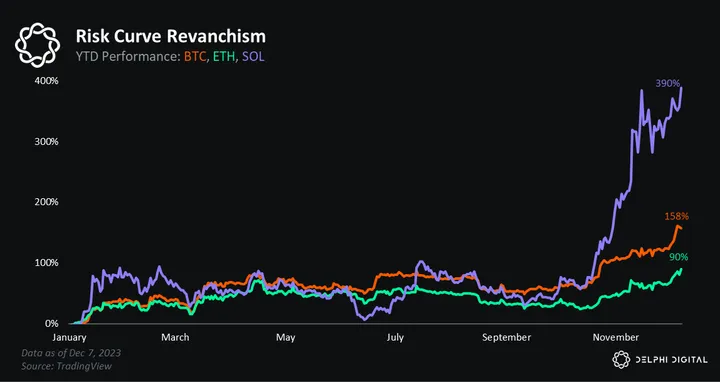
But SOL didn’t just outperform the majors — it blew its closest comps outta the water, too. It’s been a market leader and is now seen by some as heir to Ethereum’s throne.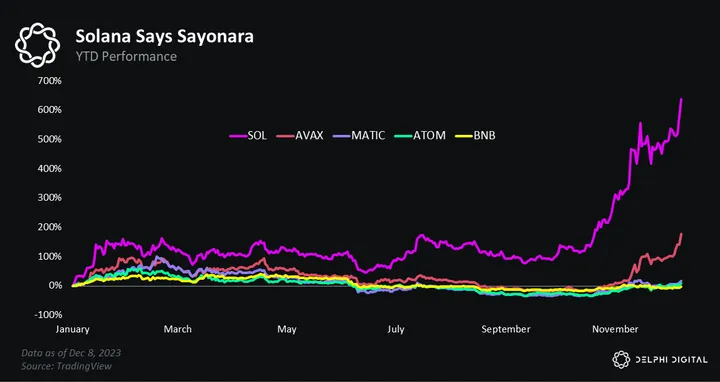
The question heading into 2024 is whether SOL will continue to outperform. We think so. And in the sections below, we outline three drivers that inform our view:
- mean reversion
- market share normalization
- narrative shots on goal
Mean Reversion
2024 Predictions:
- SOL outperforms ETH — SOL/ETH ref: 0.1
- BTC outperforms ETH — ETH/BTC ref: 0.05
The mean reversion thesis is easy to grok. Thanks to SBF, SOL got whacked harder than other tokens and suffered a more severe drawdown. Once the market woke up and realized SOL wasn’t going to literal zero, some reversion to the mean was inevitable.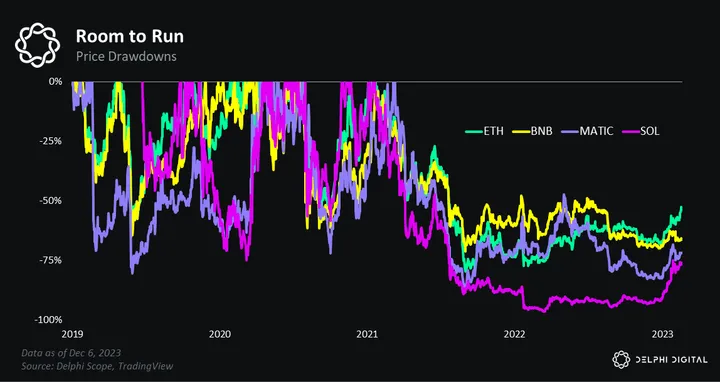
We’re now at the point where reflexivity kicks in. SOL is no longer some non-consensus ‘Sam coin.’ It’s now seen as perhaps the only viable Ethereum alternative. As a result, many .eth’s are suddenly realizing they’re dangerously underexposed.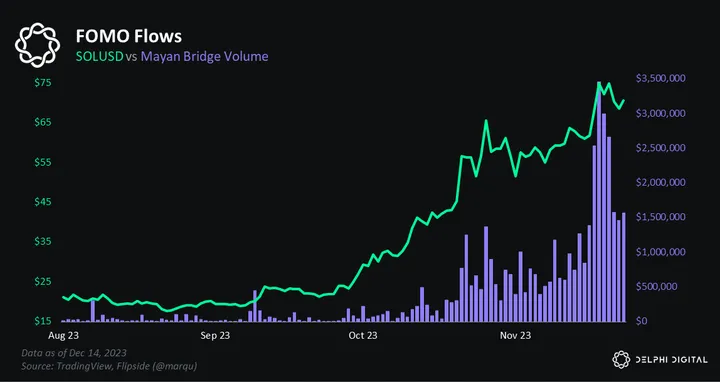
SOL might not even need ETH-aligned chasers to outperform in 2024 because its TVL is still farther off the highs than competitors like *checks notes* BSC.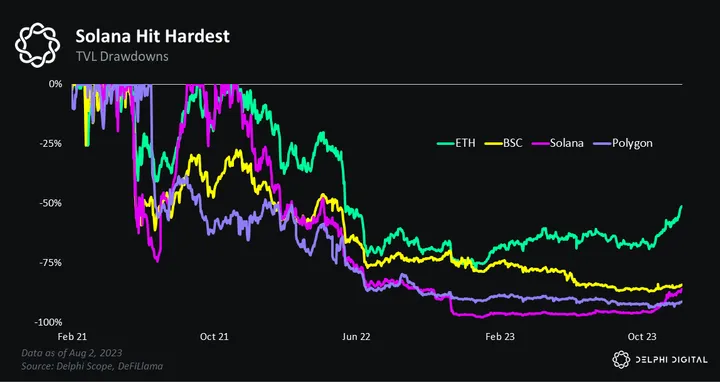
There’s still plenty of juice left in the mean reversion trade. This is most apparent with respect to stablecoin market caps.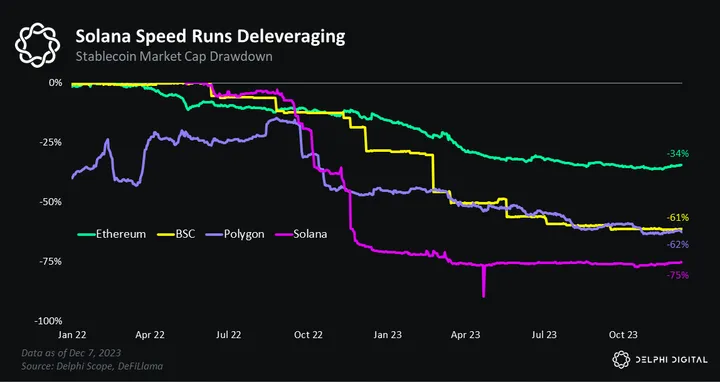
Solana’s relative youth is likely to blame for its vicious deleveraging. We must remember that SOL is still a young pup in the grizzled eyes of BTC and ETH hodlers. And in uncertain times — e.g. the largest ponzi scheme since Madoff and a bone-crunching bear market — the market seeks out the ‘certainty’ BTC and ETH offer.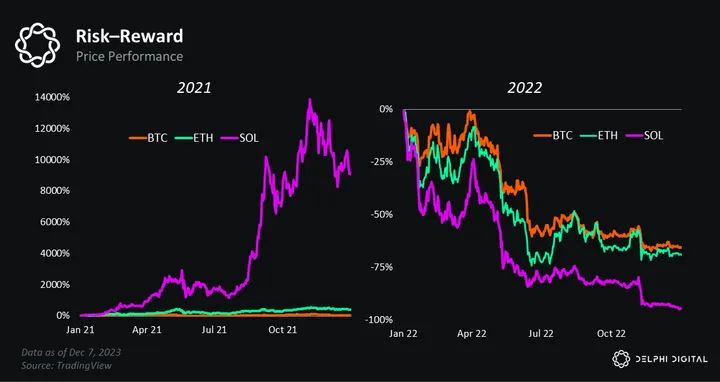
In crypto parlance, we call this the Lindy Effect. BTC has survived longer than ETH, so it’s deemed safer. And ETH has survived longer than SOL, so it’s deemed safer. So on and so forth…
Since last cycle was Solana’s first, it was anything but Lindy. But today — after surviving the cataclysmic collapse of FTX — Solana is much closer to earning a spot alongside BTC and ETH on the Lindy throne. Instead of “BTC and ETH,” 2024 will usher in the “BTC, ETH, and SOL” era.
We expect the implications of such a profound psychological shift to go far beyond mean reversion.
Market Share Normalization
2024 Predictions:
- Non-EVM chains make up 50% of onchain TVL
- Solana mints more NFTs in one week than Ethereum does all year
- Solana flips Ethereum in annual NFT volume (USD)
- Solana flips Ethereum in annual DEX volume (USD)
Ethereum Rules Everything Around Me
Crypto is a technology but also a financial asset. We’ve never seen this before. Yes, we have Facebook and Google, which are publicly traded stonks. But these are corporations with private IP, not foundational technological infrastructure.
The fact that blockchains have been financialized from Day 1 has led to some pretty weird outcomes. I mean, is there a single example in the history of technology where the first two entrants remain the two most valuable in perpetuity?
This “oldest is best” dynamic reveals crypto’s immaturity. We are pre-PMF. No one knows what will work, go mainstream, or consistently make money. As a result, we cling to abstractions like “Lindyness.” In such a memetic market, ‘experience’ becomes a useful shelling point.
The market will continue to value protocols off narratives and memes until more objective measures materialize. For now, the market remains enamored with Lindyness. And as the eldest smart contract platform, Ethereum is the obvious beneficiary.
Ethereum and its constellation of surrounding stuff — the EVM eco — is valued at an eye-watering premium to everything non-Ethereum.

Today, 9.5 out of every 10 dollars onchain is EVM-aligned. While all this dough isn’t long ETH in the literal sense, it’s still a vote of confidence — the market is putting capital at risk within the EVM ecosystem.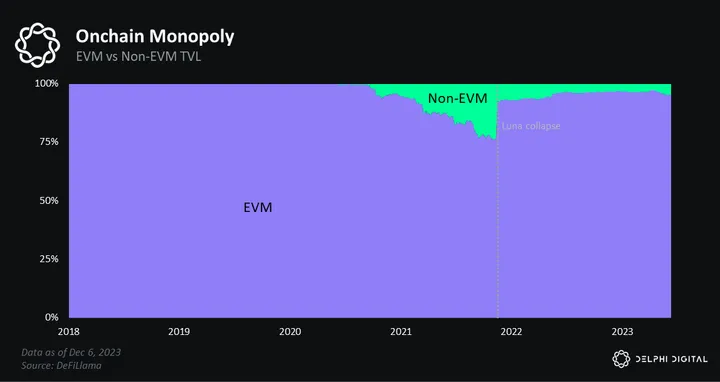
We believe Ethereum’s dominant market share is bound to deteriorate. And as the largest and most vibrant non-EVM ecosystem, we expect Solana to be the main recipient of market share normalization.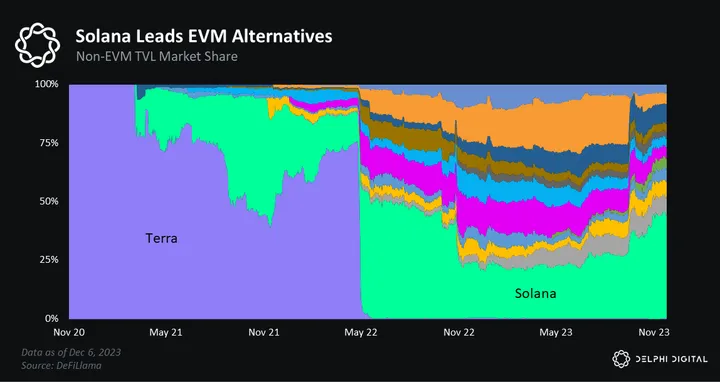
It’s worth reflecting on why the EVM is so dominant. The most obvious reason is its first-mover advantage. This brought Lindyness but also gave Ethereum’s prolific developer ecosystem a head start. Newer chains start from zero — zero track record, zero liquidity, and zero community — and bootstrapping each component takes time.
ETH’s rising price also helped reinforce Ethereum’s dominance. In crypto, fat protocols still reign supreme. The fat protocol thesis argues that, unlike the Internet, where value accrued to the top at the application layer (Google, Facebook, etc.), in blockchain, value will accrue to the bottom protocol layer (Bitcoin, Ethereum, etc.).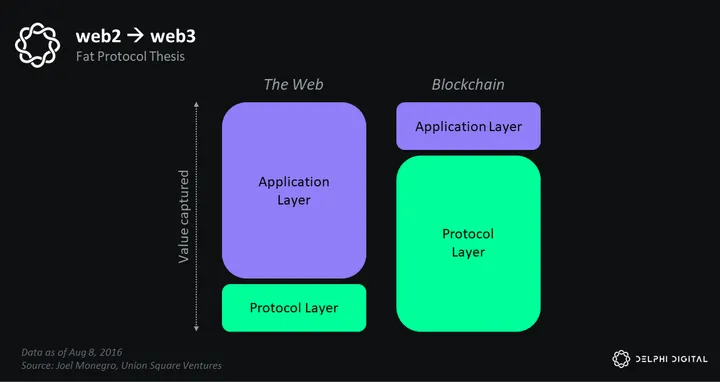
A more cynical version of the fat protocol thesis is it serves as a convenient excuse for capital allocators. Similar to the old TradFi adage, “nobody ever got fired for buying IBM” — in crypto, “nobody ever got fired for buying ETH.” And since our industry is still pre-PMF, why take concentrated risk at the app layer when you can just buy ETH and get index-like exposure to everything built on top?
Over the years, ETH’s rising price has been a flywheel: number go up → more devs → more apps → more users → number go up. Since Ethereum is the oldest L1, its flywheel has been spinning the longest. But this dynamic also exists in other ecosystems — it just takes time to get going.
 SOL’s rising price — now on its second cycle — is finally starting to pay dividends. Solana has cultivated a loyal developer base, many “only possible on Solana” apps, and a fierce “manlet” community. For non-Solana devs, it’s a compelling mix.
Developers attention continues to dramatically increase on Solana pic.twitter.com/KAbXqoXLv1
— Jacob Creech (@jacobvcreech) December 13, 2023
History Doesn’t Repeat, But It Does Rhyme
Outside of Google Search, finding another major technology with >95% market share is near impossible. It’s an anomaly.
Even Google — a once-in-a-generation business that absolutely prints cash — would blush at Ethereum’s dominance.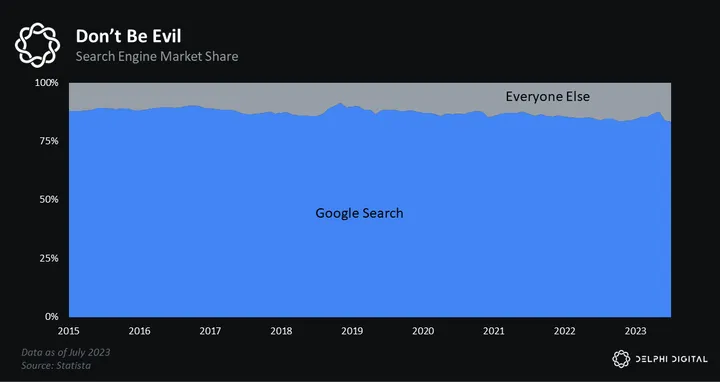
Most new technologies start with a clear leader, who, through first mover advantage, stakes a claim on the lion’s market share. But over time, competition arrives and the market fragments.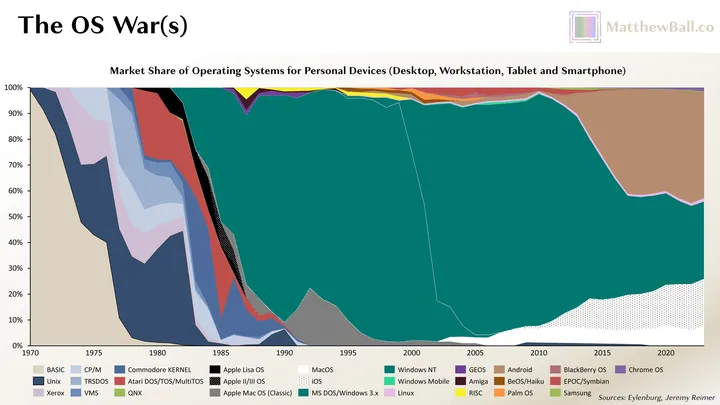 As technologies mature, new winners emerge and consolidate market share as their network effects kick in. We saw this in the OS wars (above) and the mobile wave (below). This delayed winner-take-most dynamic also demonstrates how first-mover advantage doesn’t matter nearly as much as people think it matters.
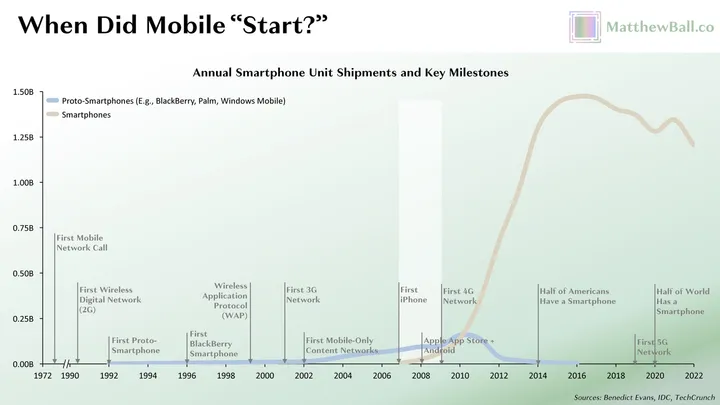 These new technologies are, by definition, highly disruptive and incredibly difficult to predict. Take mobile phones. In the early 2000s, everyone thought mobile phones needed a keyboard because nobody had ever seen one without it. The upshot here is predicting the future is hard! And anointing “winners” in the first inning is a fool’s errand.
Another lesson we can draw from history is the market values differentiation. In the mobile OS wars, Apple’s iOS established itself as the premium, high-end offering. But Android countered by positioning itself as a more accessible, open-source alternative.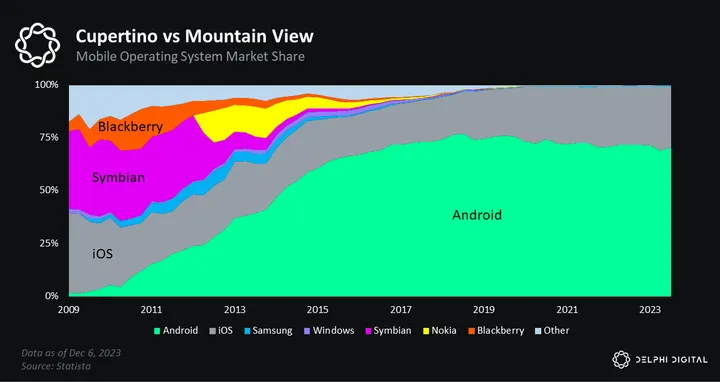
In the end, Android won a majority of the market share, while iOS captures most of the revenue. 
A more recent platform shift — cloud computing — shows the market’s preference for redundancy. Similar to blockchains, cloud computing serves as a base layer of technological infrastructure. If your cloud goes down, you go down.
The market has logically de-risked this by building redundancy. As the technological substrate that underpins web3, blockchains will be no different. A multichain world is coming — it’s just not evenly distributed.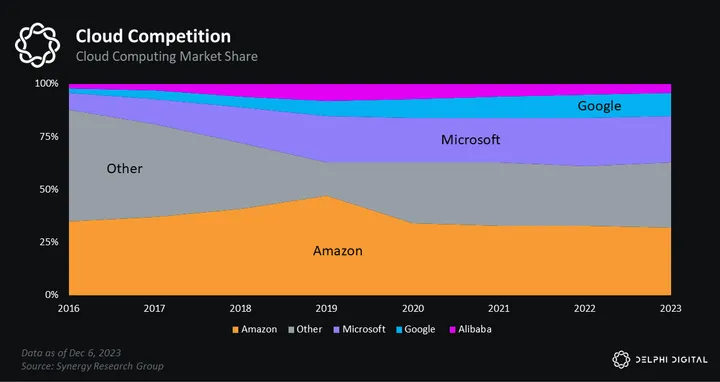
Crypto’s app layer resembles the evolution of past technologies more closely than its infra layer. The app layer is littered with examples of incumbents failing to innovate and being usurped by new entrants. It remains unclear to us what law of physics prevents this same dynamic from playing out on the infra layer.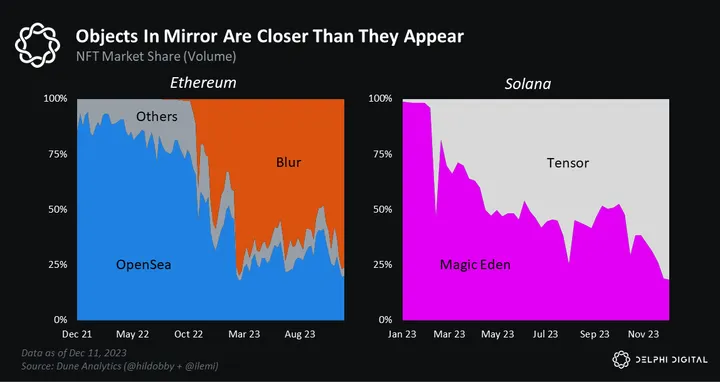
The Flipping Future
There will be many flippenings before the flippening. We expect leading indicators on Solana, like users, volume, and transactions, to all flip Ethereum before we get the big dramatic TVL and market cap flippenings, which will lag more real-time data points.
In short, we hold three beliefs:
- The cheapest, fastest, and easiest-to-use L1 will be the most widely used
- The most widely used L1 will be the most valuable
- And as L1 usage changes, valuations will follow
We’re already seeing this thesis take shape. Take NFTs. Thanks to state compression, Solana can handle significantly more NFT mints than Ethereum. In fact, Solana minted more NFTs in one month than Ethereum did all year.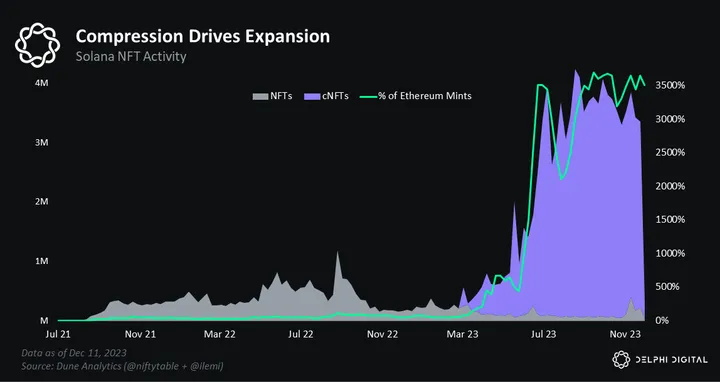
As a result, NFTs are no longer just PFPs on Solana. They are many things, like cheap digital collectibles (DRiP) and messaging sticker packs (Dialect). These are fundamentally novel experiences uniquely enabled by Solana’s larger design space. And, importantly, these apps are onboarding new users who were either priced out or uninterested in legacy apps.
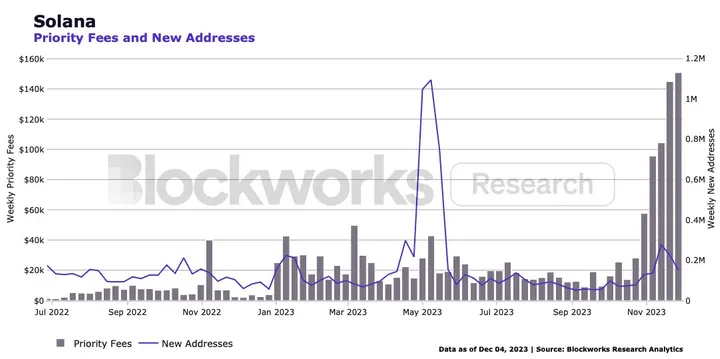
We see the same dynamic in DeFi. Degens can actually use Solana DeFi, thanks to its low fees and speed. It’s why Solana now boasts ~2x the number of traders as Ethereum.
And while notional volume still lags, we believe it’s only a matter of time (or airdrops) before it closes the gap.
Solana now exceeds or is at parity with Ethereum across many verticals, including:
- DEX Volume
- Stablecoin Volume
- Active Addresses
- NFT Volume (mints + trading)
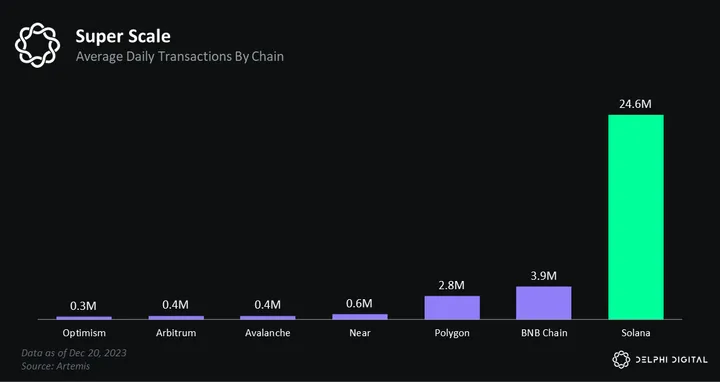
- Transaction Count
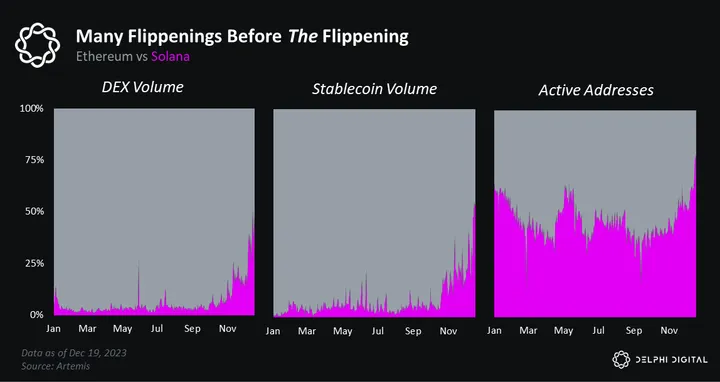
In summary and summation, we believe the days of EVM domination are numbered. If past is prologue, Ethereum will soon face fierce competition. L2s, appchains, and Solana all promise to play a role. But we expect Solana to be the chief beneficiary of the EVM’s decline. This is already showing up in lower-level data. And in 2024, we expect Solana’s emergence as a near-peer to Ethereum to be visible in higher-level data like TVL and market cap. Gradually, then suddenly…
Narrative Shots on Goal
2024 Predictions:
Solana will benefit from more narratives than any other L1.
- DeFi Summer-style liquidity mining, airdrops, and wealth creation
- Only Possible On Solana
- The Stake Must Flow
Double-Edged Narratives
Hailing from my home state of New Hampshire, Robert Frost taught us to “take the road less traveled.” It’s a catchy IRL aphorism since humans operate in meatspace and can only take one road: left or right. But technology operates in the world of bits — it can actually take both roads: left and right. Bits are not bounded by the same constraints as atoms. Why take both roads? Well, because you don’t know which is better!

New Hampshire’s White Mountains during the fall
The future is path dependent. And there’s a huge amount of uncertainty regarding disruptive technologies like crypto. The only way to manage this uncertainty is to compile a portfolio of parallel bets. The goal being to replicate the diversity, unpredictability, and dynamism of the market at large, thereby maximizing the odds of success in any future state.
In the context of smart contract blockchains, these chains aim to be world computers. A substrate upon which anything can be built. As Anatoly often jokes, he never could have guessed that monkey pictures and dog coins would be crypto’s most popular use cases in the year 2023.
While all the major L1s are open and permissionless — meaning anyone can build anything — they optimize for different things.
- Bitcoin is betting people will value censorship-resistant digital value
- Ethereum is betting people will value censorship-resistant access and deflationary, “ultra-sound” money
- Solana is betting people will value a global state machine operating at the speed of light
Each of these bets comes with a different set of optimizations. Bitcoin has a 21M fixed supply to emphasize its “digital scarcity” element. Ethereum implemented EIP-1559 — “the burn” — to make ETH a deflationary asset. And Solana has higher hardware requirements to enable better performance.
Downstream of these optimizations are narratives and use cases. Bitcoin’s narrative and use cases remain very much focused on BTC, the asset, and not much else. It prioritizes stability over dynamism. Ethereum is focused on becoming a settlement layer and ETH as deflationary money. Solana aims to synchronize information at the speed of light and use SOL as a spam filter.
Narratives can be useful shelling points and rallying cries for communities. But they can also be restrictive. Ethereum’s “ultra-sound money” narrative offers a case in point. EIP-1559 was intended to make Ethereum’s transactions more predictable, which it has! But it also (perhaps inadvertently) led to a myopic fixation on the burn. The more ETH burned, the better. As a consequence, computationally expensive activities that burn a lot of ETH are celebrated. While cheaper activities are less exciting to ETH bagholders.
 Today, Ethereum finds itself in an unenviable position: its narrative is parasitic to its future success. Its narrative demands that it be maximally extractive — high fees are better than low fees. But its future success hinges on its ability to scale and cheaply process transactions en masse. Even if we ignore the mental gymnastics at play here, Ethereum’s scaling roadmap — its Firedancer — is nowhere near ready for prime time. L2s and danksharding may save Ethereum sometime in the distant future, but not today. For now, Ethereum is narrative-poor.
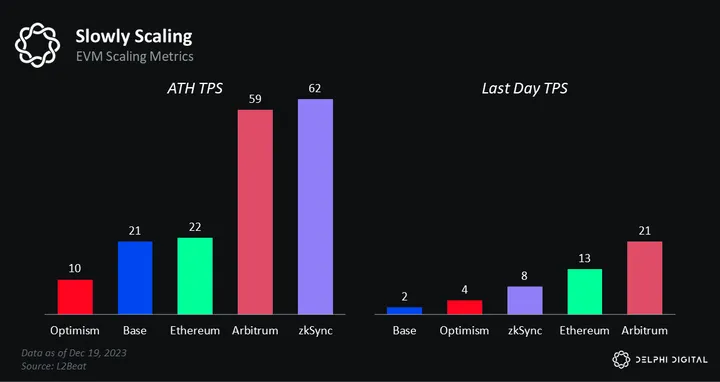
On the other hand, Solana is narrative-rich. We will discuss three of Solana’s most promising narratives below and highlight how they are enabled from the top down yet proliferate from the bottom up.
Solana’s DeFi Summer
Note: we covered this narrative at length in Ghosts of Cycles Past. Read that report for a deep-dive.
Last cycle, Solana pumped too fast.
friendly reminder that in 2021, SOL went from $25 to $200 in 50 days
— rinko (@mrink0) November 10, 2023
There literally wasn’t enough time for builders to build stuff. By the time apps went live and dropped tokens, the market was already rolling over. As a result, Solana never really had its “DeFi Summer” moment.
Yes, a lot of SOL wealth was created, but it was highly concentrated and never really permeated the broader DeFi ecosystem. Solana’s low TVL — which *checks notes* is still below Arbitrum — bears the scars of last cycle’s turbo pump-and-dump.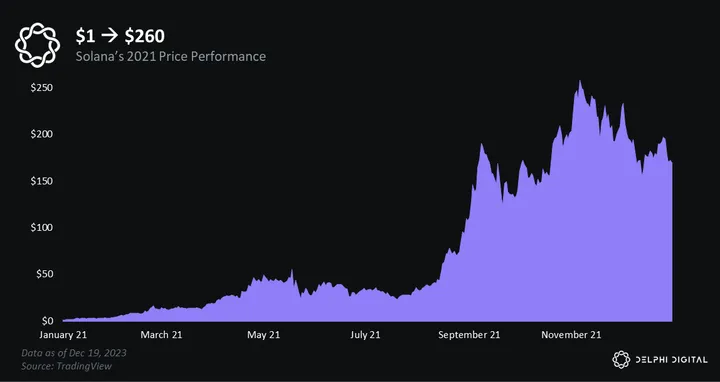
Solana also failed to make its power users rich and convert them into patrons of the chain. These are the people who seed projects, LP, and, more generally, proselytize the chain. Power users were central to Ethereum’s growth but have so far been MIA on Solana because not enough manlets “made it.” Hence, all the “Solana is for the poors” memes.
Ethereum’s DeFi Summer set off a gold rush of new users and fresh capital flows. In just a few months, the stuff you could do onchain exploded. The ensuing speculation cemented Ethereum as the network.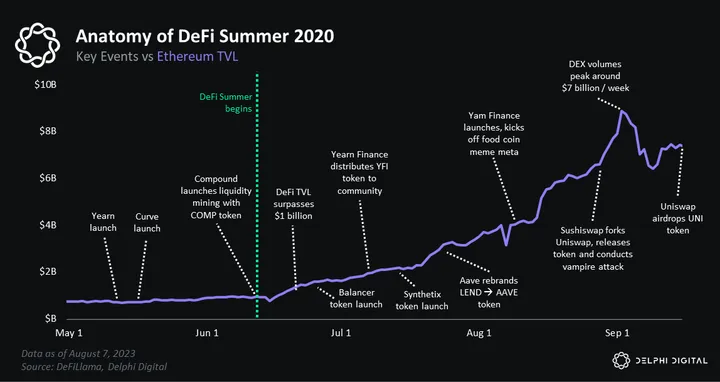
All this uponly resulted in serious onchain wealth creation. DeFi Summer minted many millionaires. And importantly, the nouveau riche became patrons of Ethereum. They spent their spoils supporting other projects, buying NFTs, and, more broadly, engaging in onchain activity. This helped bootstrap Ethereum’s now vibrant economy.
We’ve been talking about how Solana is set up for a similar DeFi Summer moment. Points were a prelude. And now all of the ingredients are there: users, pre-token projects, and core supporting infra. In fact, Jito’s recent airdrop may have been Solana’s “Compound moment.” Ever since JTO dropped, Solana DeFi has been on a straight heater.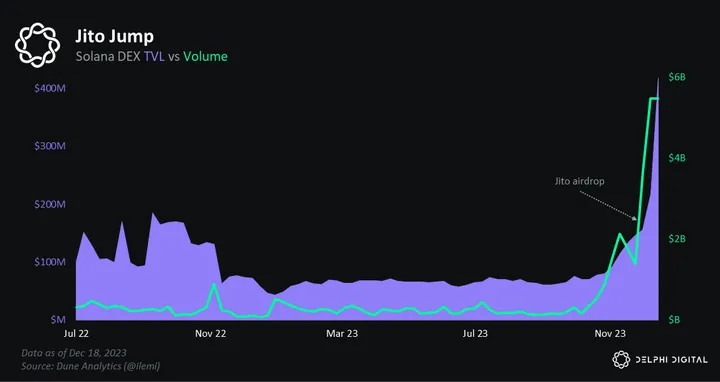
We expect future airdrops to fuel the fire. Jupiter will likely be the biggest and arrive sometime within the next month. MarginFi will happen in Q1. We also have Tensor, Kamino, Drift, and Meteora (among others) to look forward to.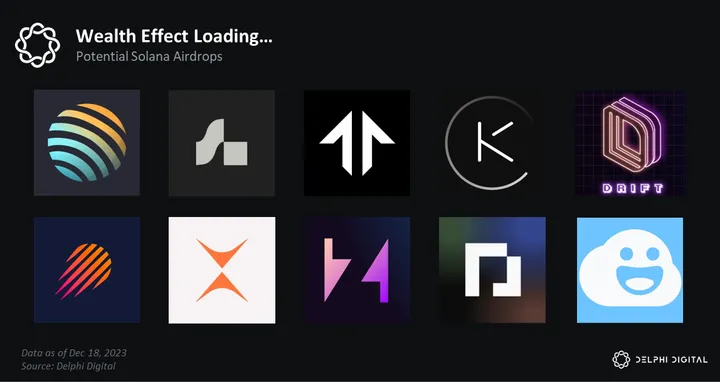
The way to play Solana’s airdrop szn is simple. Stay curious and explore everything. But do so safely — create a new burner wallet for each app and size your positions properly. It’s not worth losing your whole stack over “points.” This is only the beginning. For the manlets who hodled through the bear: they will say you got lucky, but we know there’s no such thing.
One final note. The thing that sticks out when looking at the order of events in the OG DeFi Summer is how quickly all the tokens launched post-COMP. This stuff moves fast. So, when protocols start liquidity mining — the kids call it “points” these days — pay attention. That usually means airdrops and liquid tokens are inbound. 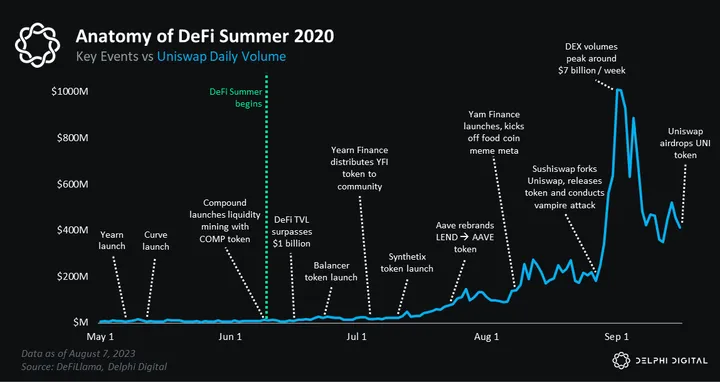 We expect things to only get crazier from here — stay steady lads.
Only Possible On Solana
Note: we covered this narrative at length in Return of the Coins. Read that report for a deep-dive.
Blockchains have been around for 15 years and still haven’t gone mainstream. Why? Well, people put forward a buncha reasons. Regulation. Volatility. Complexity. Scalability. Or the fact that blockchains are a backend technology, not a friendly front end like Facebook. All of these are compelling, but scalability stands out as perhaps the most deterministic way to judge blockchain viability. They can either handle a lotta activity or they can’t; it’s binary.
To date, blockchains have struggled to scale. Bitcoin averages circa 5 TPS, while Ethereum isn’t much better at around 16 TPS.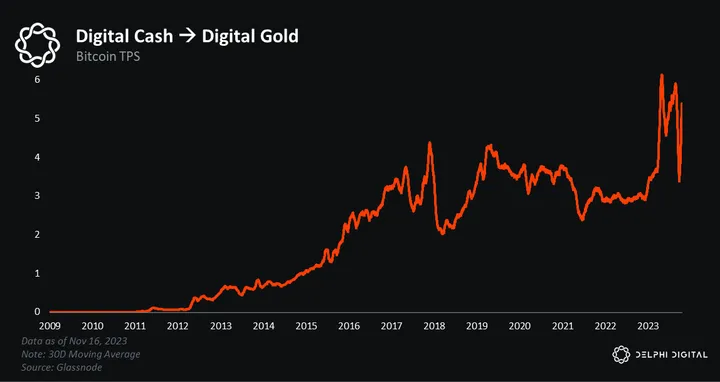
Solana was the first blockchain to scale.
Thanks to its scale, Solana enables fundamentally new stuff. Enter the “Only Possible On Solana” meme. OPOS challenges developers to build from first principles. It asks: what’s possible on Solana that’s impossible everywhere else?
The meme is salient because, to date, most Solana applications have been EVM copycats. We’ve yet to see many apps push the bounds of Solana’s larger design space. We could discuss many OPOS applications, but we’ll stick to five.
First is Jupiter — Solana’s largest and most popular aggregator. Jupiter’s smart order router takes advantage of Solana’s speed and low fees to route orders.
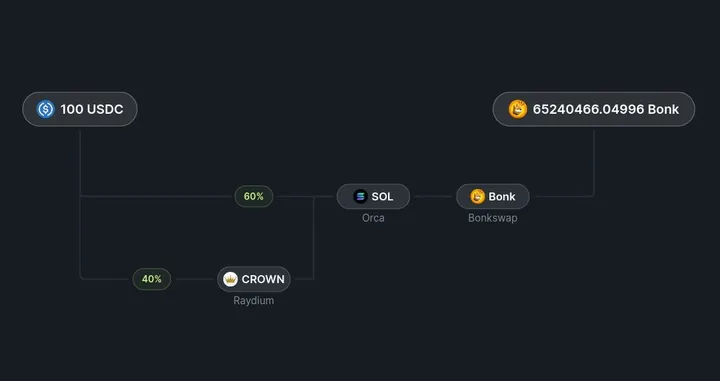
On other chains, routing an order across this many pools would take forever and be prohibitively expensive. On Solana, it’s trivial. OPOS.
Next up is Phoenix — Solana’s top central limit order book (CLOB) DEX. Phoenix’s design helps market markers remain profitable while offering tight spreads to takers (retail tradoors).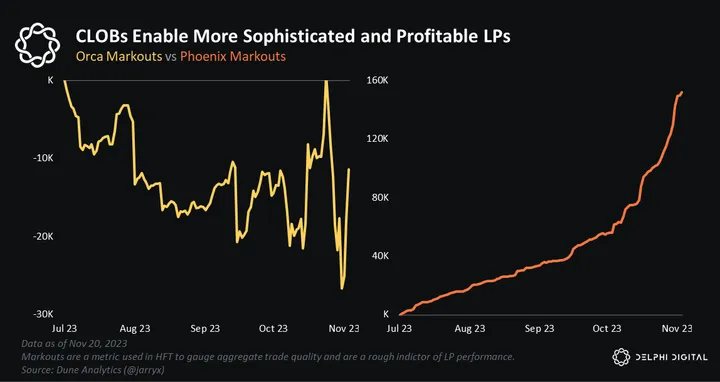
Because of their high throughput, CLOBs aren’t feasible on Ethereum, so AMMs were invented as a workaround. AMMs are useful for long-tail assets, but CLOBs are superior for highly traded pairs that benefit from more granular liquidity provision vs the blunt approach AMMs take. OPOS.
The third example is DRiP — a creator platform for collectibles. DRiP leverages Solana’s state compression in order to mint thousands of free cNFTs for its 500,000+ user base.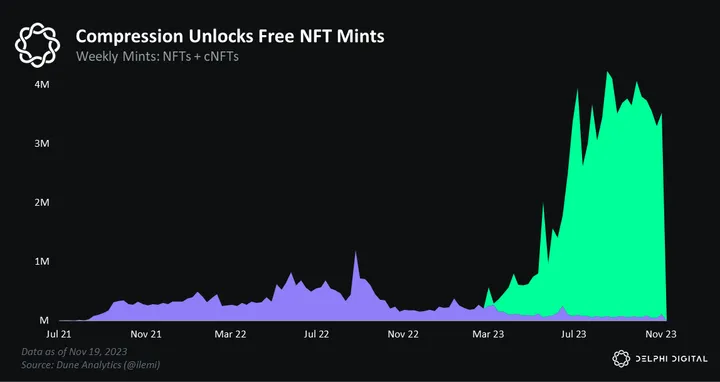
DRiP was one of the first apps to subsidize NFT mints at scale — a luxury that’s only possible thanks to Solana’s ultra-cheap minting fees. OPOS.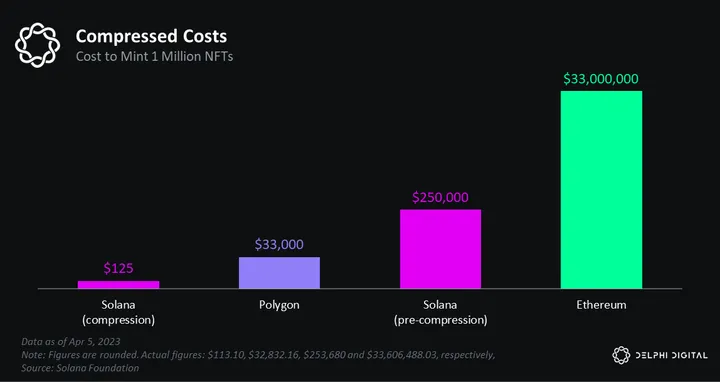
Numero cuatro is Helium — a decentralized wireless protocol that just launched a nationwide $20/month unlimited phone plan. The plan is 87% cheaper than the average American’s cellular bill.
IT’S HERE🔥
Our nationwide $20/month Unlimited Phone Plan is now available!The average American spends $157/month on their phone plan, but starting today, anyone in the US can join Helium Mobile & say goodbye to overpriced bills.🙌
Read the news: https://t.co/qXWCpm6zbo
Sign… pic.twitter.com/A2hqPppCMB— Helium Mobile (@helium_mobile) December 5, 2023
Helium actually ran its own blockchain before realizing Solana would be easier, faster, and cheaper. When Helium migrated, it essentially had to turducken one blockchain inside another. Check out Breakpoint talks one and two for more. The TLDR is Helium leveraged Solana’s state compression to mint ~1 million NFTs to represent its IRL hotspots. Notably, this historic burst of activity went completely unnoticed on the network. OPOS.
 The fifth and final ‘Only Possible On Solana’ example is Code. Admittedly, Code is a personal favorite; check out Return of the Coins for a deep dive. Code is a Solana-based wallet that powers instant, reliable and private payments. The Code team has built three consumer products: digital paper cash, cash links, and micropayments for the web.
Code is the best crypto payments app I’ve ever seen. It’s one of the only apps I’ve shown to normie friends and family. It’s like Venmo — payments are free, instant, and reliable. OPOS.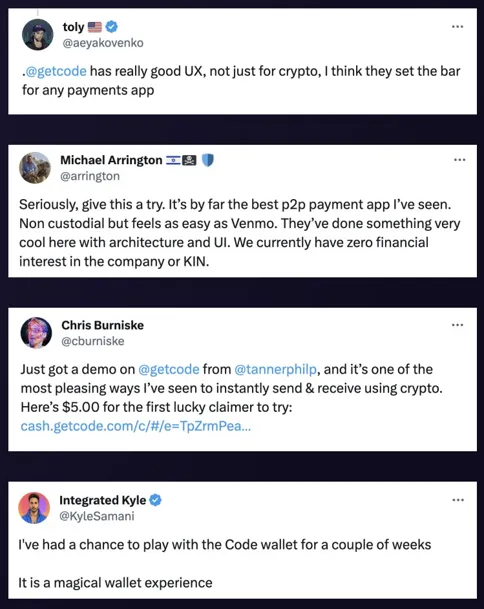
The Stake Must Flow
Note: we covered this narrative at length in Ghosts of Cycles Past. Read that report for a deep-dive.
We believe liquid staking offers the single biggest opportunity to boost Solana’s TVL and DeFi yields. And we expect Jito to play a key role in bringing liquid stake online.
LSTs have been a critical part of Ethereum’s DeFi growth.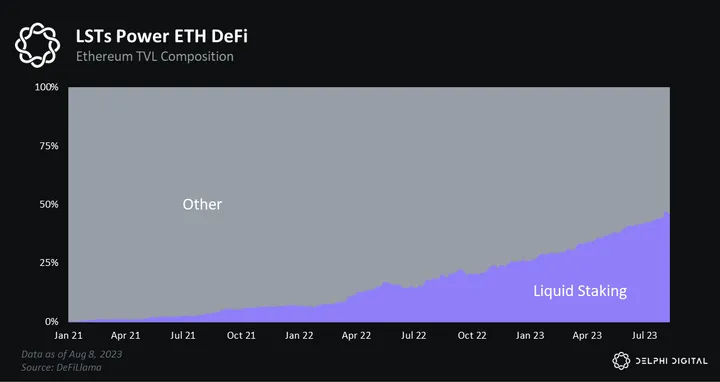
They are equally important on Solana, where LSTs are the most popular collateral type across many DeFi protocols.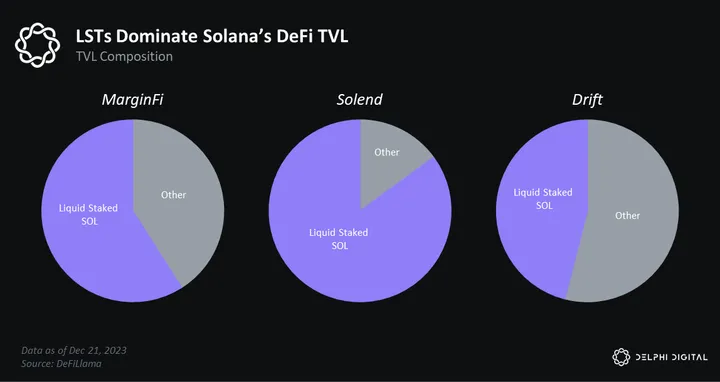
The difference between Ethereum and Solana’s LST markets is their size. Despite having the advantage of starting off as a proof-of-stake layer 1, liquid staking on Solana is significantly less popular than Ethereum. Compared to Ethereum, Solana has a higher percentage of staked SOL but a lower percentage of liquid staked SOL.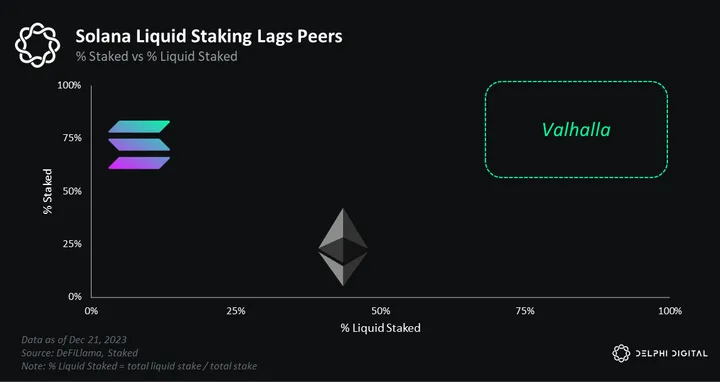
24% of Ethereum’s total supply is staked. But 40% is liquid staked — 5x more than Solana. More liquid stake means more DeFi liquidity, which catalyzes critical onchain activity like borrowing and lending.
If Solana were to go from 7% to 15% liquid staking penetration, Solana’s DeFi liquidity would jump 33%. If it were to reach parity with Ethereum (40% liquid staked), available liquidity would more than double. We’re talking gigachad size here.

Solana devs are well aware of LSTs untapped potential and Jito is leading the charge here. To understand Jito, imagine if Lido and Flashbots had a baby on Solana – that’s Jito. Ceteris wrote a great technical deep dive on Jito in Solana the Monolith. The TLDR is Jito built a Solana mempool.
With Jito, searchers can see the transactions coming in, simulate what’s going to happen, and then create a bundle around them to ensure they get executed atomically. These bundles then get priority access to the leader through a separate processing pipeline with a high success rate. Searchers’ execution can now be based on the highest auction bid vs a probabilistic guarantee through spamming.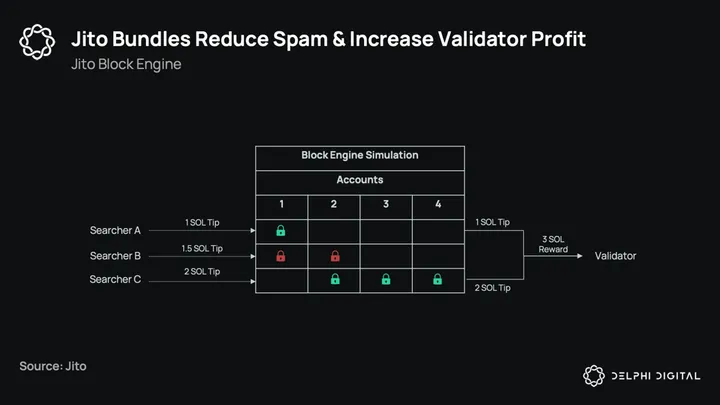
The upshot is Jito reduces spam by incentivizing would-be spammers to compete in auctions and boosts staking yields by democratizing access to MEV capture on Solana.
Jito is designed to be a flywheel. More stake → stronger transaction execution guarantees → more transaction flow → more MEV → more yield → more stake. Multicoin wrote a nice blog post on this dynamic.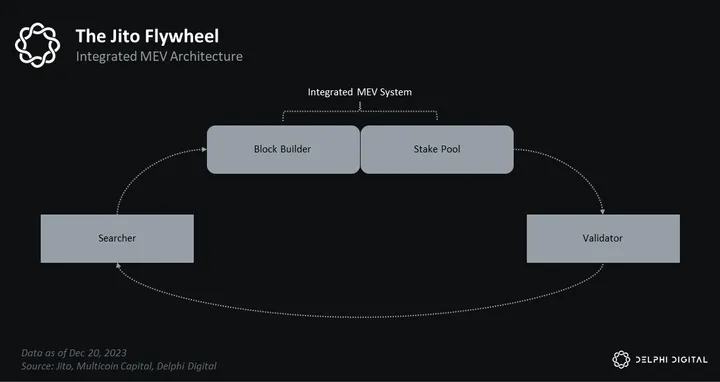
So far, Jito is executing on all fronts. TVL is over $545 million. Weekly bundles surpassed 3.3 million. And 750+ searchers are now competing in Jito’s auctions. The flywheel is spinning.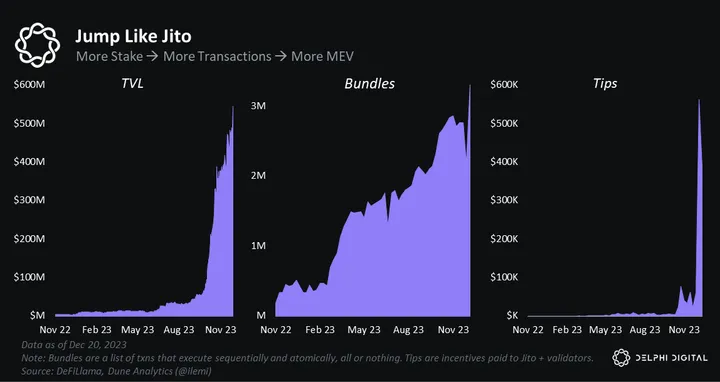
Jito’s success is inextricably tied to that of Solana’s DeFi ecosystem. More onchain activity means more MEV. It’s no surprise that Jito was the first to market with their token. The airdrop — the largest ever on Solana — has so far resulted in a Cambrian explosion of activity. Future historians may one day speak of two Solana ages — before and after Jito.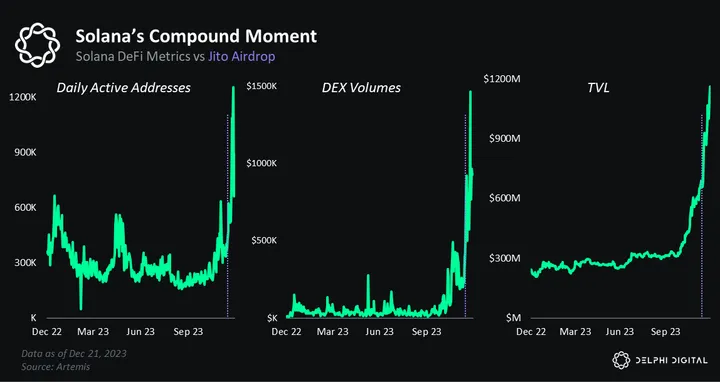
We believe Jito and Solana will have a symbiotic relationship going forward, feeding off each other and growing the pie together. As Solana’s DeFi Summer takes shape, more and more economic activity will move onchain. Inevitable arbs and market dislocations will ensure, generating MEV for Jito’s searchers and liquid stakers. This, in turn, will boost trading returns and staking yields, which should bring even more liquid stake online. Jito knows: the stake must flow.
Key Theme #5: E.V.M. – Everything’s Very Messy
While we recognize Ethereum as the most resilient (“Lindy”) among L1 blockchains, it no longer stands as the clear-cut top choice for L1 investment as we move into the next cycle. This is unfamiliar footing for the Ethereum ecosystem.
Asset Appeal & Investability
The appeal and investability of an asset depends in part on how easily the prevailing investment thesis can be understood by the masses. In the aftermath of the 2017 market cycle, advocating for Ethereum and the EVM thesis was relatively simple.
“Ethereum killers” (e.g., EOS, NEO, ADA) largely failed to meet expectations. For those looking to invest and allocate to the L1 thesis and the rise of decentralized applications (dApps), Ethereum was the obvious choice (alongside a selection of leading DeFi blue chip assets such as Synthetix, Aave, Compound, etc.).
For a bit of extra risk and market beta exposure, some users flocked towards the top NFT collections and meme coins. But holding ETH was the most straightforward strategy to get exposure to everything being built on top.
Allocating to the EVM investment thesis delivered substantial returns for those who got involved. But the landscape has evolved since then, and the EVM thesis is a bit more confusing and complex now than arguably any time in the past.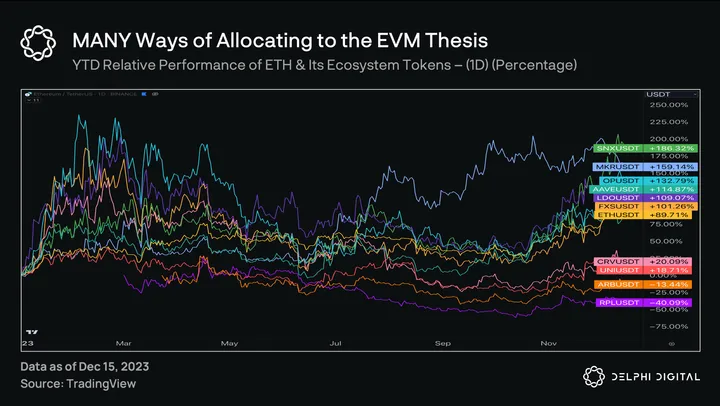
The proliferation of L2 solutions like Arbitrum, Optimism, and zkSync are attempting to address issues like high gas fees and network congestion — but it also fragments attention and capital for those seeking the highest return potential on Ethereum exposure.
In its simplest form, allocating to the EVM thesis is inherently more difficult than some of the other L1s like Solana — or even Avalanche — due to the increasing amount of optionality for investors to express their preferences.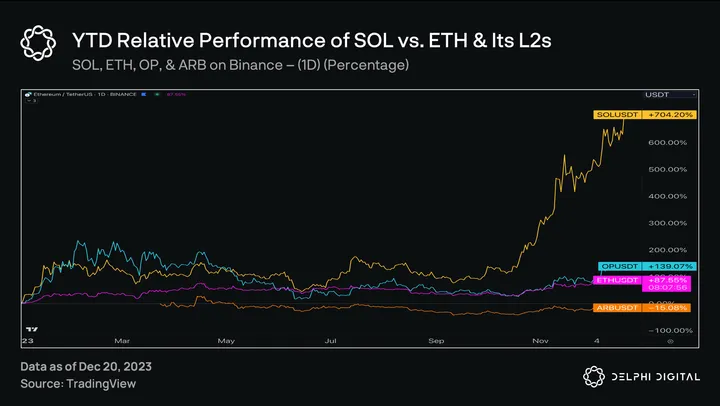
This evolution has also resulted in fragmented liquidity within the Ethereum ecosystem.
Liquidity is fickle and tends to follow incentives. While liquidity can easily shift from one L2 to another, relocating dApps is far more challenging. This creates a dilemma for developers in choosing the most suitable L2.
Developing separate versions of a dApp for different L2s further fragments the landscape, diminishing potential network effects.
Solana vs. Ethereum L2s, a UX comparison
— pencilflip 🍄 (@pencilflip) December 12, 2021
This complexity also detracts from the user experience. Engaging with multiple L2s is more intricate and cumbersome than interacting with a single, unified blockchain. Users face challenges such as navigating different wallet interfaces, understanding diverse fee structures, and learning to bridge assets between networks.
These challenges form barriers to entry, especially for less experienced users. Additionally, bridges carry their own security assumptions and risks, as evidenced by numerous high-profile bridge-related hacks such as Ronin Network ($600M), Wormhole ($300M), and Nomad ($190M).
While these UX challenges may be solved in time, they still pose issues for near-term adoption and asset allocation.
From Clarity to Complexity: Ethereum’s Evolving Landscape
For those less technical, allocating to Ethereum has become more challenging. Should one just buy ETH? Or some dApp tokens? Or ARB? Or dApps that run on Arbitrum? Or OP? Or dApps that run on Optimism? What about bridge tokens? Or governance tokens of LSDs?
Those who spend a vast majority of their time keeping track of all the developments on all these different derivations can certainly outperform the broader market. But for the average hodler, this growing complexity is increasingly difficult to navigate.
Conversely, the investment thesis for monolithic blockchains like Solana is far more simple to understand. If one is bullish on Solana, then SOL is a core position in that portfolio, supplemented by holdings in select dApp tokens. This approach is reminiscent of how many got exposure to the early days of Ethereum, a parallel we discussed at length in the Ghosts Of Cycles Past report.
Additionally, Ethereum and L2s can still become prohibitively expensive for the average user during periods of high demand. This will likely drive them towards more cost-effective, monolithic blockchains like Solana and Avalanche, promoting a positive feedback loop of adoption and development on these platforms.
We saw this exact dynamic play out last cycle with the SOL and AVAX trade rotation.
Ethereum may offer greater security compared to these alternatives, but given the tradeoffs average users will likely begin to prioritize lower transaction costs and speed.
That said, institutional investors are not able to simply allocate to the ‘next hot narrative’. They are severely bound by liquidity constraints, an area Ethereum still commands a big advantage over its competitors. Ethereum has the highest TVL and has stood the test of time, making it a more viable option for institutional investors.
The recent Blackrock ETH spot ETF filing helps provide the asset with a stamp of approval in the eyes of traditional investors. This will help drive more institutional investment over time.
Absolute returns on an asset are largely a function of its market cap and liquidity. Generally, a higher market cap translates to higher liquidity, which means that more dollars are required to move the price.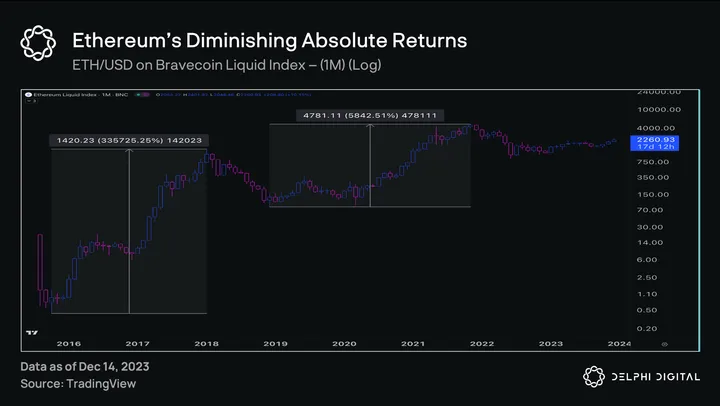
As their market caps and liquidity have grown over the years, both BTC and ETH have sported smaller absolute returns in each subsequent cycle. It will be a tall order for Ethereum to replicate its performance from the last cycle – at least in magnitude.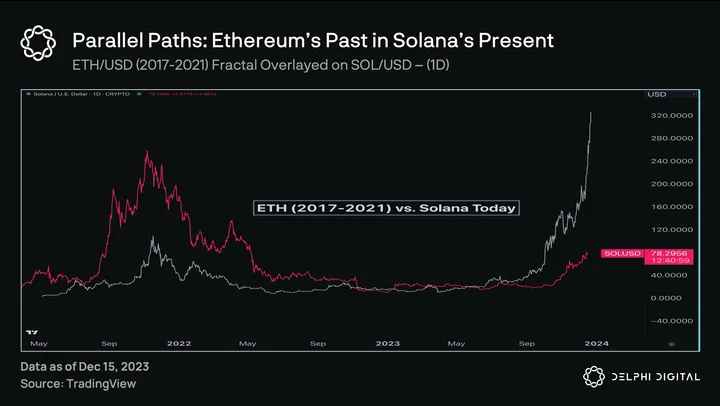
However, other L1s have significantly less liquidity and lower market caps, making it easier for them to outperform ETH (as we’ve already started to see this year).
It will take a while for liquidity to get deep enough for larger capital allocators to get equally as comfortable as they are with Ethereum, so the advantage favors the more nimble participants over the institution, at least for now.
Ethereum: Down, But Not Out
Does all of this mean that Ethereum is dead? Certainly not. Will ETH/BTC ever rally again? We think so.
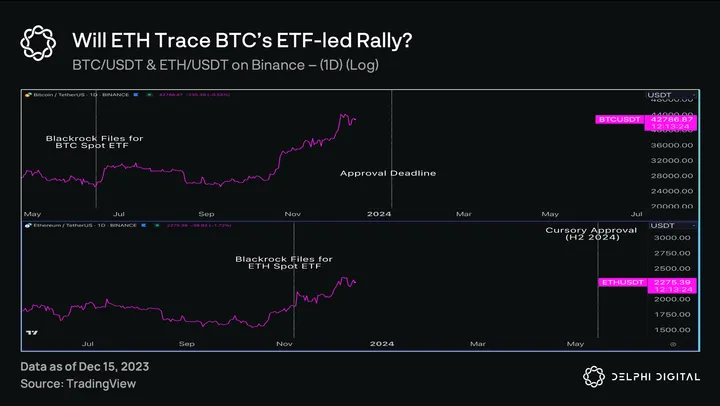
In bullish markets, narratives often drive price — which eventually drives fundamentals. Currently, all eyes are on BTC as the approval of its spot ETF draws ever closer. Not only has BTC posed an impressive rally, but the BTC beta assets — e.g. Stacks (STX) — have also performed quite well.
As the ETF deadline draws closer, the risk-reward profile of allocating towards BTC relative to other higher beta names diminishes significantly.
This begs the question, where will the money flow next? What is the next dominant “narrative” that might take form? Well, seeing how much significance is put on spot-based ETFs, all eyes will probably shift towards ETH.
The speculative money that has entered BTC in anticipation of its spot ETF will likely start looking for the next big trade. Ethereum will seem like the most obvious choice, which could drive flows from BTC toward ETH. The sidelined market participants who missed out on BTC’s ETF rally will be looking to run the same trade with ETH next time around.
Besides, Ethereum has a couple of tricks up its sleeve that make it quite appealing, especially from a traditional investor’s perspective.
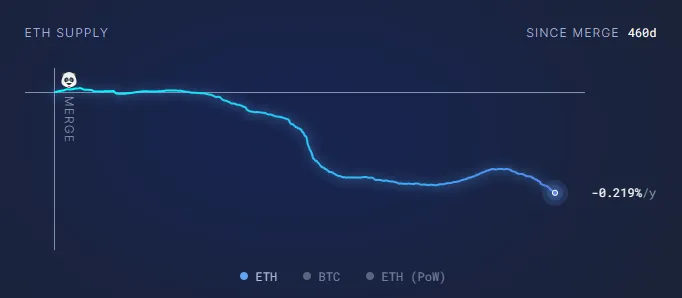
Since EIP-1559 was implemented, higher usage equals higher gas, which equals more ETH being burned. And despite the fact that the recent bear market has significantly curbed the demand for Ethereum’s blockspace, thereby bringing down the gas fees, ETH is still slightly deflationary. Imagine what happens when onchain activity picks up again.
With the transition to PoS, staking Ethereum provides a ‘real’ native yield. The yield (reward rate) currently sits at ~4.2%, or a real yield of ~4.5% if we account for expected deflation. And this is with minimal network demand.
As major economies are eventually forced to cut rates, traditional investors would be desperate for positive real rates – something that ETH offers.
However, this comes with a major caveat. This yield is not paid in USD, but in ETH. Given the volatile nature of digital assets, if ETH slumps by 5-10%, the appeal of positive real rates quickly diminishes. That said, if investors are bullish on Ethereum and a resurgence in onchain activity, then ETH is bound to become more deflationary over time.
An increase in institutional demand coupled with a declining supply is a powerful combo that theoretically should put upward pressure on price. This change in supply-demand dynamics can quickly tip the scales in ETH’s favor, as an expected yield of 4-5% can quickly turn into 10-15%.
In summary, most people aren’t buying ETH just for the yield. But if one is bullish on its growth potential, earning additional yield — denominated in ETH — while maintaining long exposure to the underlying is an attractive proposition.
Concluding Thoughts
Historically, Ethereum has often been the leader during bull markets. That’s one of the reasons some have found its tepid YTD performance relative to other peers — and BTC — somewhat perplexing. This is quite unfamiliar territory for ETH, which is why some are worried if this trend were to continue its position as the leader of L1s might under threat.
ETH’s “laggard” behavior can be attributed to a few things:
- The ease with which one could “bet” on Ethereum’s success is more complex than prior cycles
- Ethereum development has led to fragmented liquidity within the ecosystem
- Perhaps most importantly, Ethereum is suffering from a narrative crisis at the moment
On the other hand, monolithic blockchains, such as Solana, address some of these issues. Liquidity is concentrated, and dApps can form novel synergies that wouldn’t be possible otherwise. The market appears to be realizing this, in part evidenced by the mind and attentionshare that Solana has managed to capture.
That said, mindshare is something that individuals closely associated with the respective market can “feel” but can’t necessarily quantify.
But things such as increased developer’s attention…
Developers attention continues to dramatically increase on Solana pic.twitter.com/KAbXqoXLv1
— Jacob Creech (@jacobvcreech) December 13, 2023
…or the active number of addresses growing by 2x in a month…
The number of active addresses on Solana has grown over 2X since November. pic.twitter.com/XMmVY5IETu
— Steven (@Dogetoshi) December 16, 2023
Or Coinbase, an exchange known for being a bit more selective in the tokens it decides to list, quickly listing BONK…
Bonk (BONK) is now live on https://t.co/CD3RBjtMAO & in the Coinbase iOS & Android apps with the Experimental label. Coinbase customers can log in to buy, sell, convert, send, receive or store these assets. https://t.co/676miKRrfh
— Coinbase Assets 🛡️📞 (@CoinbaseAssets) December 14, 2023
… and JITO as volumes started to explode.
Jito (JTO) is now live on https://t.co/CD3RBjtMAO & in the Coinbase iOS & Android apps with the Experimental label. Coinbase customers can log in to buy, sell, convert, send, receive or store these assets. https://t.co/676miKRrfh
— Coinbase Assets 🛡️📞 (@CoinbaseAssets) December 7, 2023
Ethereum may be down, but it’s not out.
And so all of this begs the question — if ETH were to outperform, when’s it most likely to do so? That time might not be far away.
If participants are looking to play the ETHBTC rotation in anticipation of a spot ETH ETF, sometime between now and the BTC ETF approval deadline (early Jan. 2024) would likely be the optimal time to do so.
When looking at the BTC and ETH charts, we believe we are starting to see this activity pick up.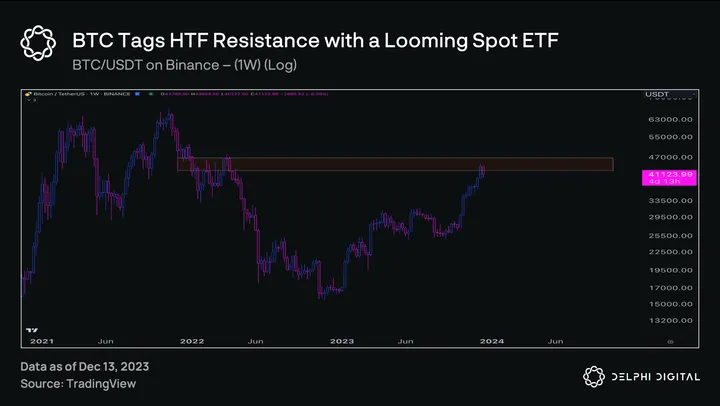
BTC is currently tagging HTF resistance after sporting an impressive rally.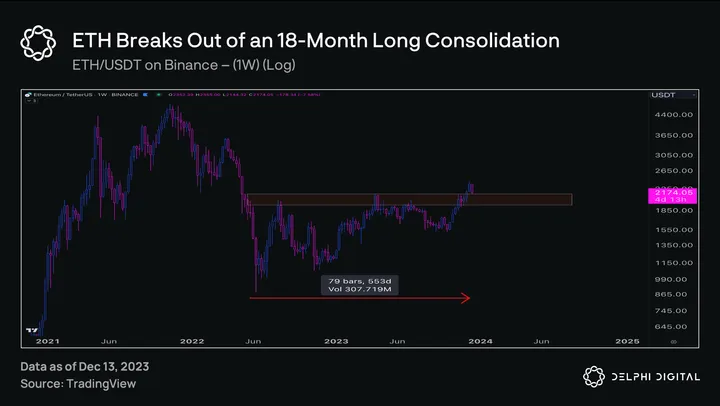
ETH, on the other hand, has underperformed throughout BTC’s rally. Yet ETH has broken out of an 18-month-long consolidation and is currently retesting it as support. Bulls and ETH rotators are looking for this breakout area to hold, which would set up a nice base for another leg higher.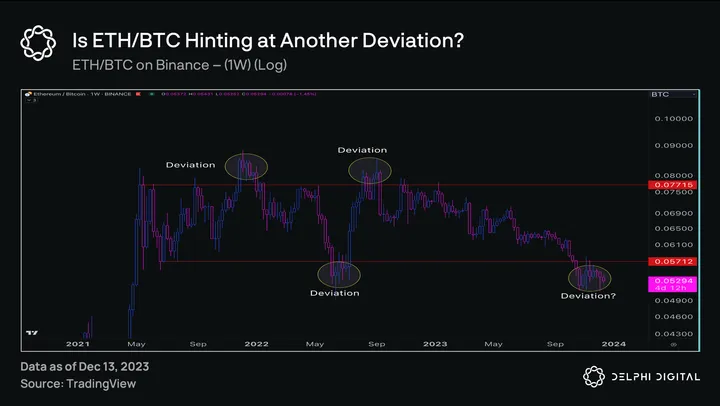
Unsurprisingly, the ETH/BTC chart has broken down from its HTF range. But it hasn’t seen further continuation to the downside yet. The breakdown will become a deviation upon a successful reclaim of the range lows (0.057). If that were to happen, all eyes would be on the range high at 0.077 or ~$3500 (assuming BTC is at $45K).
If an ETH rotation does manifest, we can expect higher beta ETH alts such as ARB, OP, LDO, etc. to outperform as well. In particular, ARB and OP might act as proxies with EIP-4844 fast approaching. Just look at the level of their outperformance on a day when ETH was breaking out.
the god candle that everyone was waiting for on $ETH pic.twitter.com/7HIFkbNcCi
— 3xLiquidated 🎢 (@3xliquidated) December 7, 2023
While ETH finds itself in unfamiliar territory as a laggard YTD, we believe there will be a period of outperformance for those allocated to the EVM thesis. It may just look a bit different than cycles past
A Few Surprises From 2023
2023 was a year full of surprises. As is tradition, we have compiled a list of a few of our favorite headscratchers from the last twelve months!
Surprise #1 — Economic Resilience
One of the more shocking – and impressive – trends this year was the resilience of the US economy.
Almost everyone expected near-record monetary tightening would be too much for the economy to handle. The gap between consensus GDP forecasts and actual reported real growth has been staggering.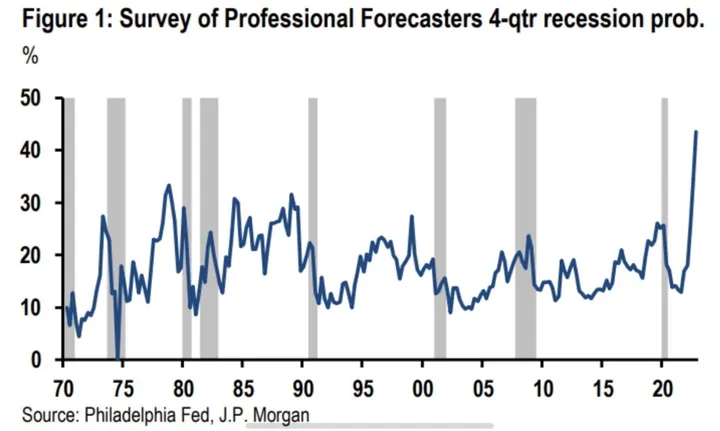
As improbable as it once seemed, a soft landing is within reach. This outcome has become more consensus recently — which is usually when we start to get a bit worried — but as we’ve said in the past, the US really can’t afford to go through another deep economic downturn at this point.
Economic growth will likely slow at some point next year, but easing inflation pressures, a relatively tight labor market, and substantial fiscal spending could keep the US economy humming along.
Consumer spending won’t go gangbusters like it did after trillions of stimulus dollars were pumped into the economy during 2020-2021. But lower inflation and decent wage growth could keep a floor under consumption next year, especially if asset prices remain elevated.
The financial markets and the real economy are intertwined. When households feel richer, they tend to spend more.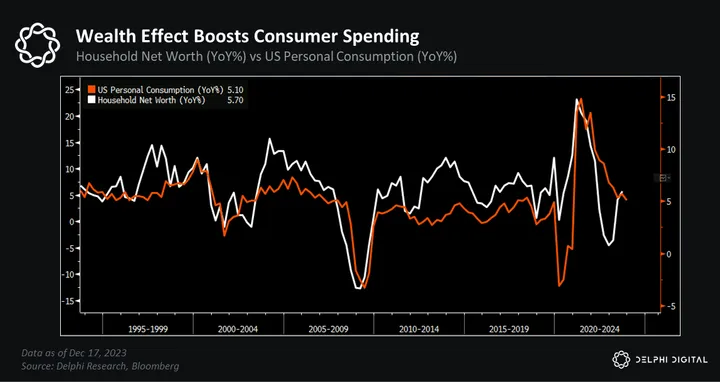
The equity market tells you when to expect a recession – and the market was already pricing in a pretty severe downturn at the end of last year.
If the business cycle has in fact bottomed, we should see at least modest growth in corporate profits. Couple that with more liquidity — which drives higher price multiples — and equities could fair pretty well next year.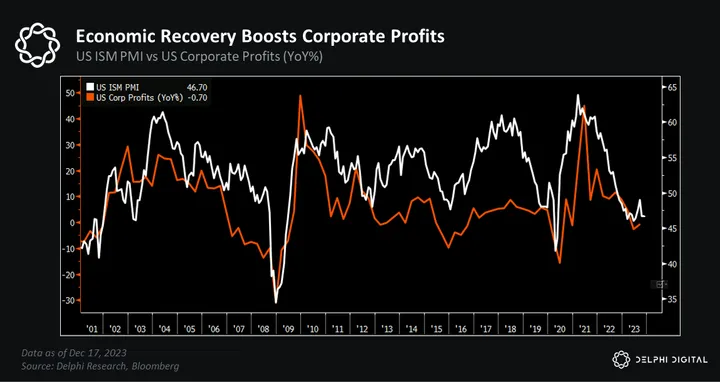
And, as the outlook improves, so too does risk appetite. We’ve highlighted how each of the last three business cycles lined up almost perfectly with the price peaks of the last three crypto market cycles.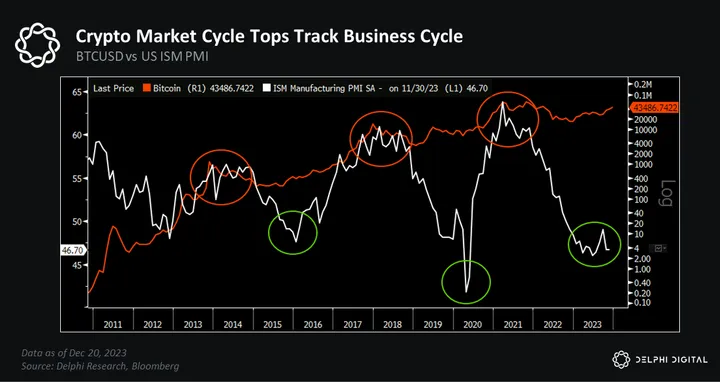
As well as how troughs in ISM momentum tend to line up with prior crypto cycle bottoms.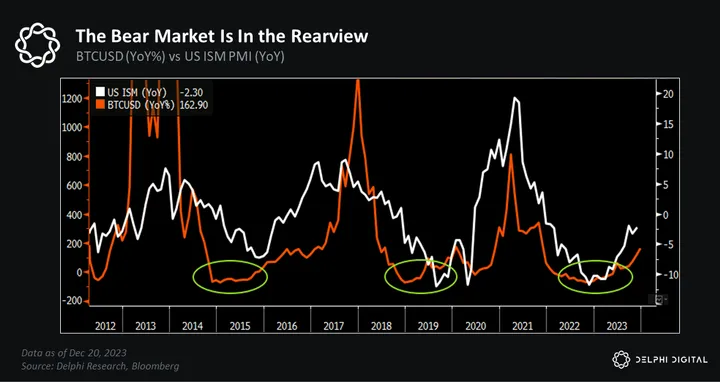
On top of that, if we are past the point of peak rates, the mountain of cash that fled to MMFs may get mobilized as investors reallocate to riskier investments, like equities and crypto.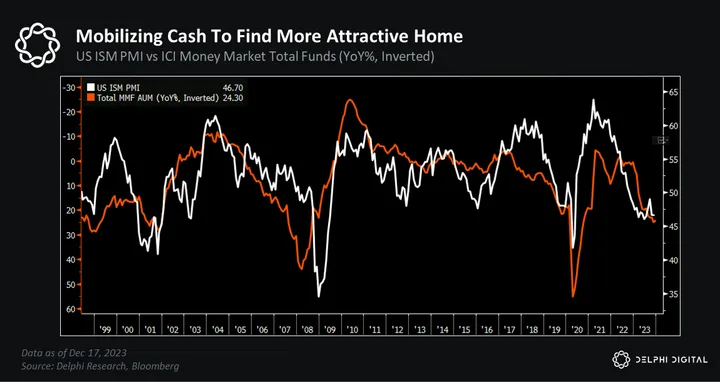
If economic growth slows but remains positive, that would be an ideal setup for sectors like tech and crypto as investors actively seek out high-growth opportunities.
Surprise #2 — Bitcoin As Outside Money
Despite the rate hikes and hard landing fears, Bitcoin was 2023’s best-performing macro asset. If you bought BTC in Q1 and held – congrats! – you outperformed ~99% of hedge fund managers.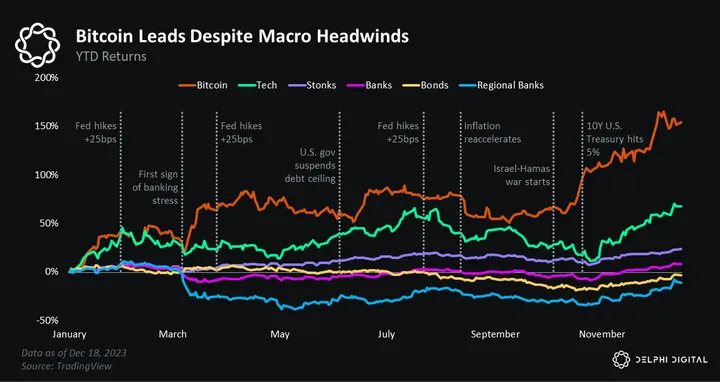
Outside of BTC’s overall strong year, it exhibited remarkable strength during two of the most uncertain and volatile trading periods of the year. The first was during the banking crisis in March. We wrote about this saga here and here.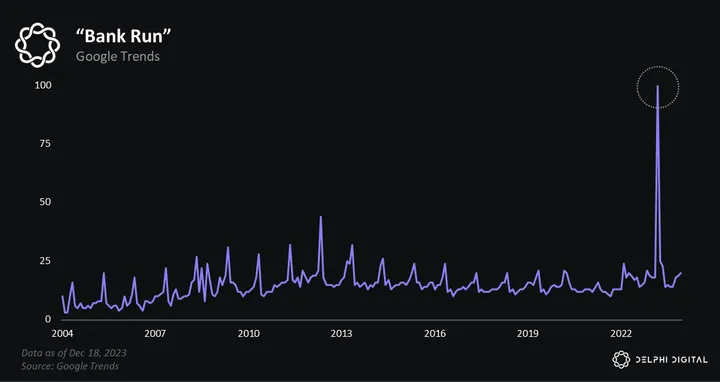
During this period, every financial asset known to man sold off. Global markets were understandably spooked. But then something weird happened: Bitcoin ripped. With blood on the (financial) streets, the world turned to Bitcoin. Pomp’s long-awaited prophecy had come true. 
Bitcoin didn’t just pump; it was one of the only assets that went up. Pretty much everything else traded flat to down, even high beta stonks like ARKK (green line above). This was the market signaling for the first time ever that Bitcoin is a viable hedge against the global financial system.

Later in the year, Bitcoin proved its risk-off bona fides once again. This time, instead of a financial crisis, it was geopolitical. On October 7th, Hamas carried out a heinous terrorist attack on Israeli civilians. Ever since, the two sides have been at war — a conflict that still threatens to spread.
Immediately following Hamas’ attack, global assets sold off. Investors worried over energy prices, shipping routes and the possibility of a confrontation between Iran and the U.S.
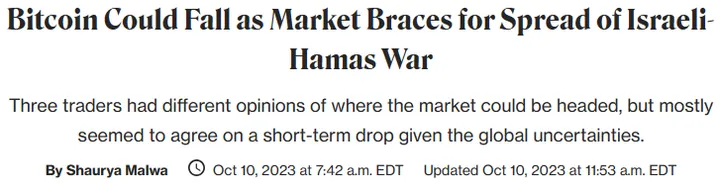 But then something weird happened (again). Bitcoin ripped. Despite all the geopolitical fears and drop in risk assets, Bitcoin bounced. It offered global investors a gold-like instrument to hedge escalatory violence that wasn’t beholden to earnings, shipping lanes, or vulnerable fiat currencies — all of which could be disrupted in the event of war. As Larry Fink said, the rally was a flight to quality.
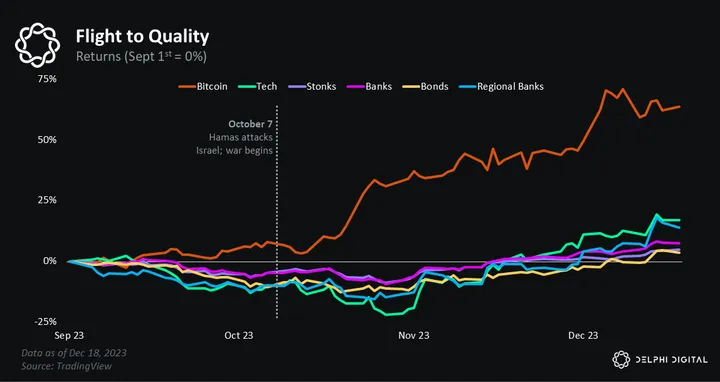
We believe these two events — the banking crisis and the Israel-Hamas war — have quietly shifted the Overton window. Bitcoin maxis talk a lot about BTC being a hedge for this and a hedge for that. But now, real investors are putting real dollars behind these narratives.
We expect Bitcoin’s role as a form of outside money, alongside gold, to only grow more prominent as the world becomes more volatile. The Pax Americana is dead and a more contested world has awakened. The implications will be vast and unpredictable, but the need for a hedge against “the system” has never been greater. Bitcoin is that hedge.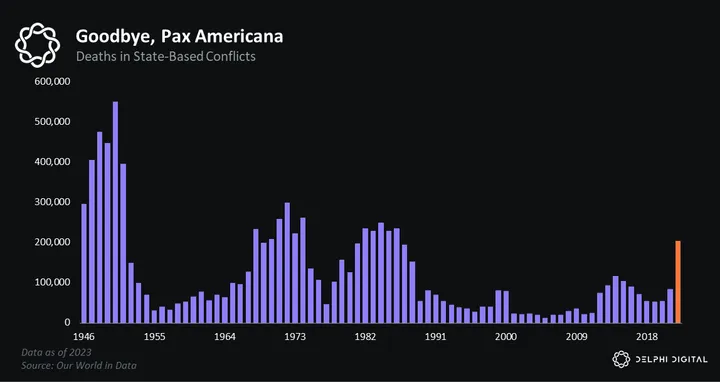
While we cannot forecast the financial or geopolitical tremors 2024 might bring, we can say next year will be politically volatile. 2024 will see the highest number of worldwide voters, ever.
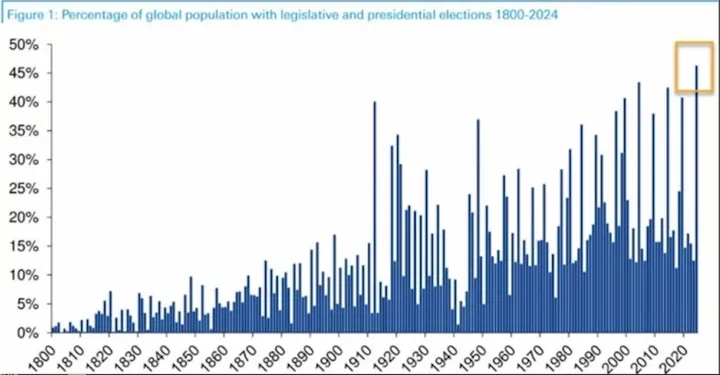
Among this group are geopolitically significant elections in the United States, Taiwan, Russia, India, and Brazil. We expect Bitcoin to perform well amid the inevitable political volatility. Unlike stonks, which are sensitive to taxes and other political levers, and bonds which are also highly politicized, Bitcoin is apolitical. It transcends politics.
We believe 2024 will highlight Bitcoin’s valuable division of money and state.
Surprise #3 — Injective’s Uponly Year
We wrote a Market Note on Injective’s impressive strength earlier this year. In a time when most coins failed to impress, INJ continued to outperform. This trend of exceptional performance dates back to January 2023, coinciding with the announcement of Injective’s $150M ecosystem fund.
In the report, we drew comparisons with other L1s that had launched similar ecosystem funds, examining their impact on the token’s price and the overall growth of their respective chains.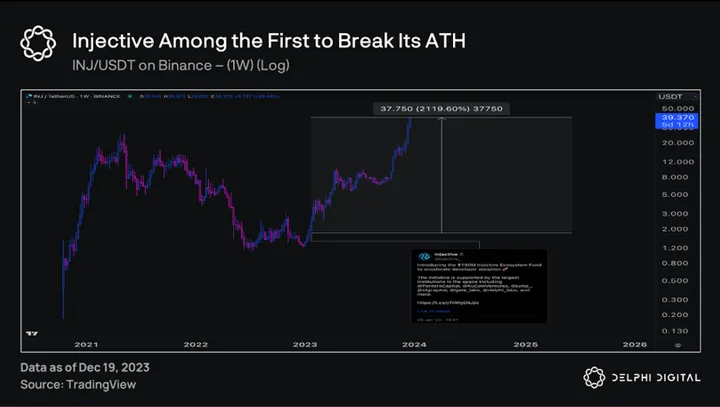
What sets INJ apart is its since surpassed its ATH, while most other assets are still down from their prior peaks.
The surprising part is how clearly INJ has deviated from the “ecosystem fund” playbook. Generally, the pattern follows a predictable sequence: the announcement of an ecosystem fund leads to a surge in token price as speculators pile in.
Then new projects starting launching on the chain, leading to an influx of users, higher TVL, and an increase in transactions (which then leads to more projects launching). This cycle typically lasts ~3-4 months before its momentum fades (sometimes reversing trend quite dramatically).
However, Injective’s journey has been different. While its token price did appreciate, the other growth metrics that usually follow didn’t mirror this trend — and there hasn’t been a significant uptick in its fundamentals since the announcement.
The number of core developers and commits has actually decreased compared to pre-announcement levels, and although there has been an increase in TVL, it’s not that noteworthy.
Additionally, INJ’s price has continued to climb for nearly a year, well beyond the average outperformance we typically see. This discrepancy between fundamental growth and INJ’s price performance has been one of the more surprising developments of the year in our opinion.
We know that fundamentals have historically taken a backseat in bull markets, giving way to more narrative-driven price action. Perhaps this is one of the early confirmation signals for what is to come next year? Afterall, a hallmark of crypto bull markets is this narrative driven price frenzies which are typically muted or absent entirely in bear markets. And if we know one thing, its that narratives matter much more in bull markets…
Futuristic Ideas & Rapid Fire Predictions
The DEX User Experience Will Close The Gap With Centralized Exchanges
In last years report, The Year Ahead For Markets 2023, we wrote about this very idea. As we know, while the DEX experience continues improving and offers many benefits to existing financial rails, it still lags behind in the experience that many retail and institutional users in the traditional finance world have become accustomed to.
Think about the experience for the 10 million plus monthly average users on apps like Robinhood, this is our target audience!
Last year we wrote, “As crypto continues to move from cycle to cycle, one theme continually re-emerges — self custody and the famous motto, “not your keys, not your coins.” In the aftermath of what has been a horrendous year (2023), this lesson has never been more important. Surprisingly, it is precisely the horrific nature of these events that has given rise to perhaps the greatest opportunity for DEXs to challenge the incumbency of the CEX experience.”
And the more that you think about it, the more you realize it is a catch-22. This exact feature is also a large barrier that must be overcome!
Not your keys, not your wallet, as they say
— Elon Musk (@elonmusk) December 7, 2023
We know most people don’t want to think about self custody, it is always a pain point when any crypto native discusses the subject with non crypto natives. Many of which could never fathom keeping significant amounts of money on a USB stick or browser extension wallet that they might lose access to forever. Self custody (or the lack of wanting to) is one of the major factors behind the push for spot ETF products!
Perhaps this feeling is the naivety of those of us fortunate enough to live in areas with relatively stable financial systems and currencies, but this is exactly what going bank-less means. It is an arduous task to be sure, but not an impossible one.
Speed and cost have always been an issue with this topic. These are usually the two things users (both retail and institutional) prioritize the most. It is no secret that transacting on the Ethereum ecosystem is becoming expensive, even on the L2 scaling solutions, which is increasingly pricing the average user out of the ecosystem.
Additionally, the speed limitations of the Ethereum network in its present state simply cannot compete with the traditional finance world, or even other L1 alternatives like Solana.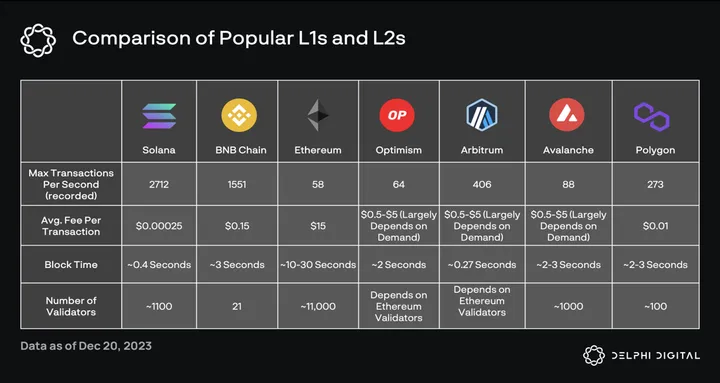
Ironically, this has provided an opportunity and narrative for the Solana ecosystem to attach itself to, and revive the famous Layer-1 wars debate from last cycle. Admittedly, transacting on Solana is very cheap and fast, and dare I say painless, when compared to Ethereum.
This is a breath of fresh air when you’ve become accustomed to paying anywhere from $15 to $100+for a swap depending on which NFT mint is happening. It would not be surprising to see Solana based DEXs like Jupiter to put in a run reminiscent of what Uniswap was able to accomplish last cycle.
Another topic we highlighted last year was the added challenge posed by DEXs requiring users to have a minimum level of technical knowledge to use them effectively. We’ve started to see progress on this front, but deciding which L1 to transact on, bridging/moving tokens on-chain to the correct wallet, etc. is still a cumbersome task for a non native.
Again contrast this to what the average user on Robinhood might experience when buying their favorite meme stonk. Login, click GME, press green button, go post on wall street bets. Easy. We still have a long way to go. Abstracting away this process is one of the keys to unlocking escape velocity for these products.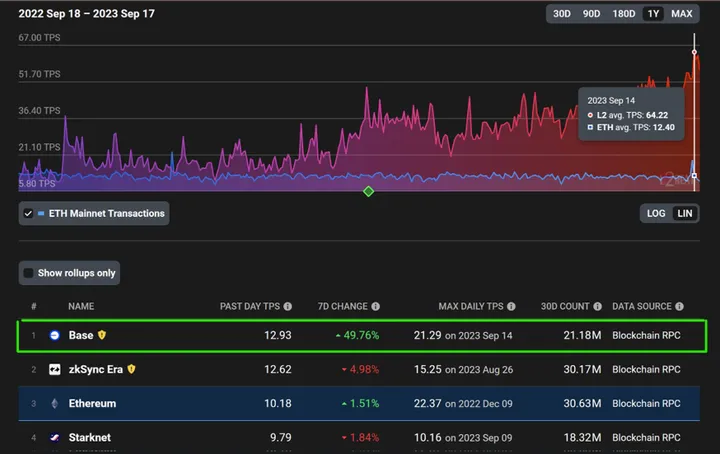
Interestingly, Coinbase might be in one of the best positions, with their newly launched BASE chain, Coinbase Wallet and their 100 million verified users who will likely be targeted for conversion to on chain users. It remains to be seen if the Base chain will be capable of supporting this type of escape velocity and the network usage it would bring. Remember, Base is an Optimism Fork, a Ethereum based L2 scaling solution which brings us back to the same problem as before!
The liquidity issue is one worth noting as well. While the Ethereum ecosystem has the deepest liquidity, it is also the most fragmented of the bunch which only adds complexity to the user experience. While Solana’s liquidity is concentrated, it is a small percentage of what can be found on Ethereum!
While it is clear that DEXs are still not quite at the level that would be expected of a significant challenge to CEX incumbents, the progress being made is palpable, which is exactly why this idea makes it back into the futuristic ideas section of this report.
Central Limit Order Books (CLOBs) Will Makeup >30% of Solana’s DEX Volume
Today, CLOBs make up ~10% of Solana’s DEX volume.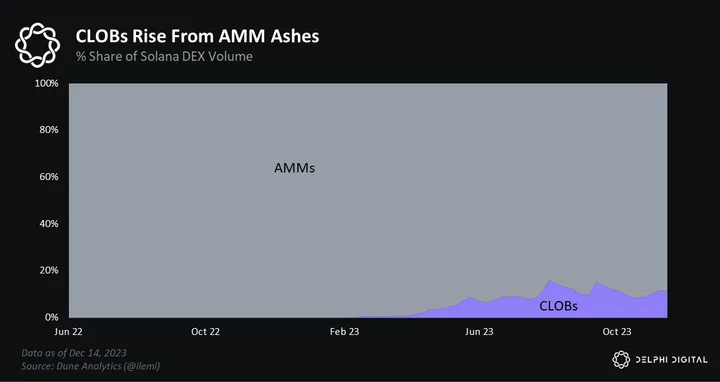
However, they boast wildly higher capital efficiency (volume/TVL) than AMMs.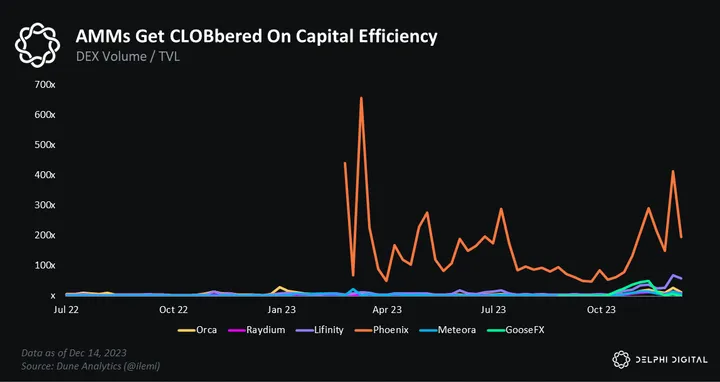
If you ask high-frequency traders, an overwhelming majority will say they prefer CLOBs because they allow for more granular liquidity provision vs the blunt approach AMMs take.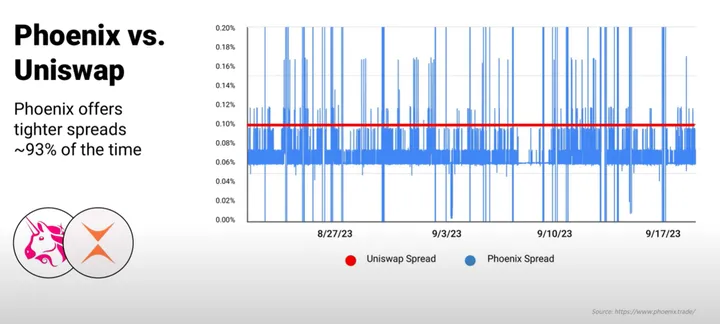
The ability to quote tighter spreads makes for a better retail trading experience and helps LPs stay profitable.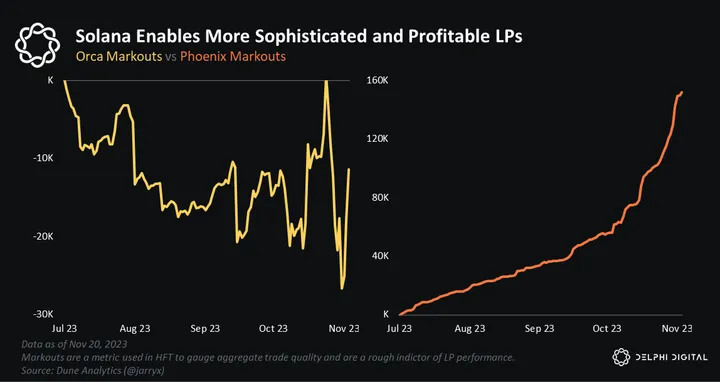
AMMs remain useful for long-tail assets, but CLOBs will power future trading on high volume pairs. 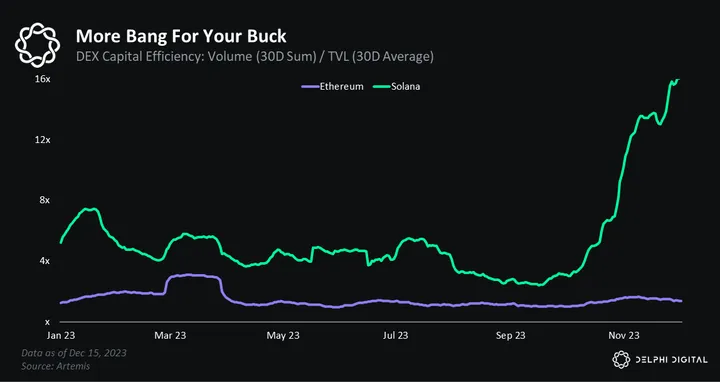
And with talented teams like Phoenix building in this space, we expect CLOBs’ share of DEX volume to rise to over 30% in 2024.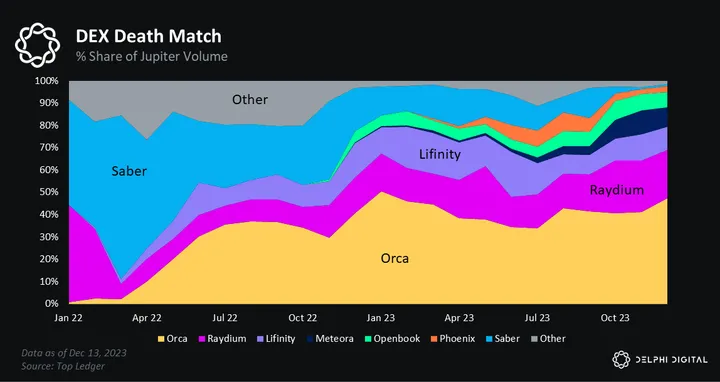
Argentina becomes the fifth nation-state to invest in BTC
Bitcoin offers nation-states three things:
- Monetary sanity
- Fossil fuel arbitrage
- Geopolitical hedge
Many fiat currencies suffer from hyperinflation due to printing-prone central bankers. Buying Bitcoin — with its 21M max supply — helps restore fiscal sanity and injects monetary dynamism.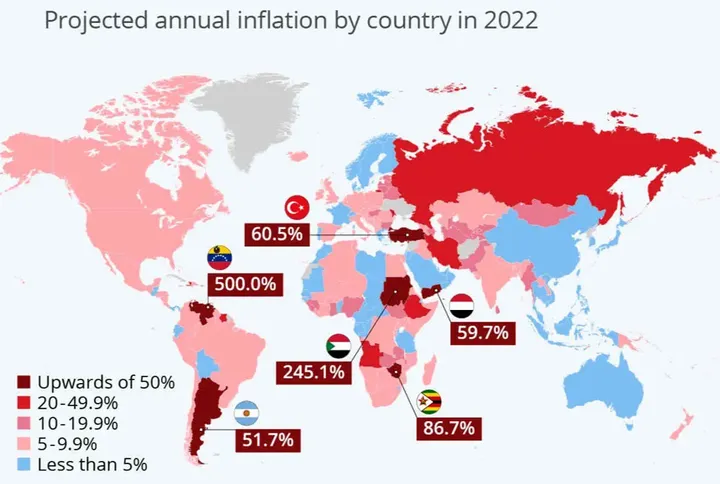 The second — fossil fuel arbitrage — is driving several Middle Eastern countries to mine Bitcoin. These countries produce an abundance of cheap energy, which can be harnessed and transformed into BTC. As the Gulf countries continue to diversify their economies, Bitcoin mining could become a key revenue source and a way to signal their tech ambitions.
Bitcoin as a geopolitical hedge is the orange coin’s most salient narrative. Bitcoin is outside money; it exists outside the traditional financial system. Similar to gold, Bitcoin is not anyone’s liability. It is a bearer instrument, meaning you actually have custody of the asset. Recently bearer instruments have come back en vogue because:
Amid financial weaponization…

Amid war…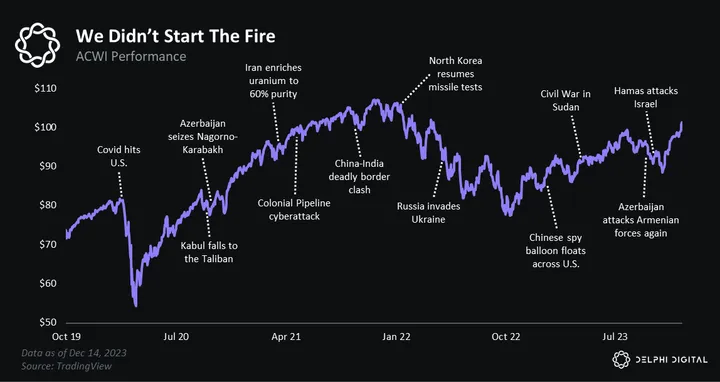
Amid uncertainty…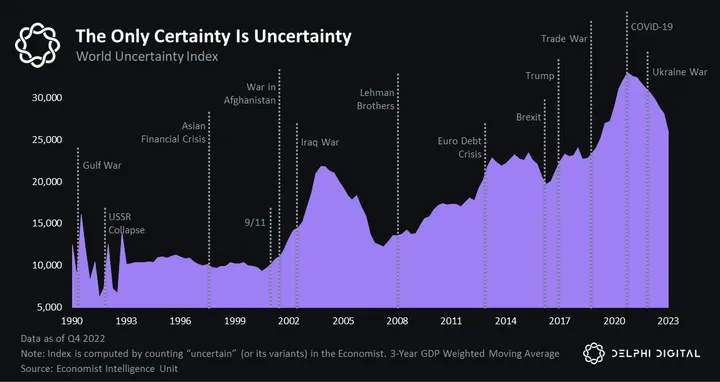
…Holding outside money is increasingly seen as a hedge against “the system” breaking.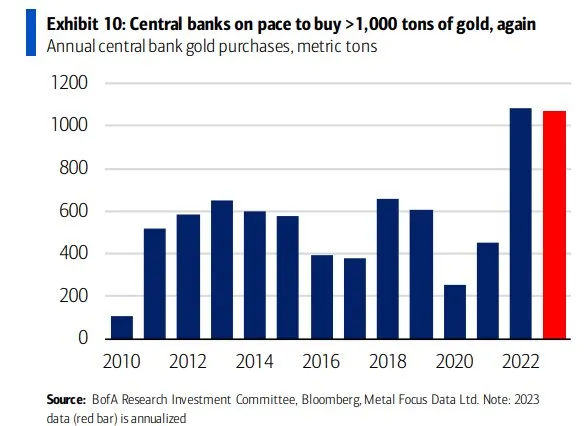
Argentina checks all three boxes:
- Hyperinflation
- Bountiful energy resources
- Caught in between the U.S. and China’s Cold War
Bitcoin offers Argentina economic hope, energy revenues, and a hedge against geopolitical instability. The new president, Javier Milei, likes Bitcoin on a personal level. And we expect his personal admiration to manifest itself more officially when Argentina joins Bhutan, El Salvador, Oman and the UAE as the fifth nation-state to invest in Bitcoin.
A Few Parting Words
The stars have begun aligning for our heavyweight macro narratives as expansionary global liquidity conditions look to propel risk assets to new heights, with crypto leading the proverbial charge.

Lord of the Rings: The Ride of the Rohirrim, The Third Age
The sun has started shining on our lightweight narratives, ranging from continued BTC outperformance, Solana’s spectacular rise from the ashes, to Ethereum’s slower-than-anticipated start, galvanizing the defiant crypto native community hellbent on running it back again. Only this time, they won’t be alone.

Troy Movie: Achilles takes the beaches of Troy.
On the horizon, we are beginning to see the emergence of ships, carrying institutional investors ranging from degenerate hedge fund jockeys to the most principled pension fund managers, all looking to lay anchor when the SEC gives the all clear. Each and every one of them salivating at the opportunity that this new asset class promises to bring.
After all, when was the last time a new asset class was created and opened to institutional investors? Both equities and bonds — resembling their modern versions — made their respective debuts in the 1600s. Commodities go back thousands of years. Even paper money traces it roots to the 7th century. Real estate has been around for ages, but only took up something resembling its modern form around the turn of the 19th century. It is impossible to overstate how important of a development the crypto industry has been when viewed through this lens.
The convergence of these heavyweight and lightweight narratives, crypto-specific advancements, and seismic global events have begun to coalesce at a pivotal moment. 2024 has all the makings for a blockbuster year — and we’re here for it.
0 Comments